Briefly: in our opinion, full (250% of the regular size of the position) speculative short position in gold, silver, and mining stocks are justified from the risk/reward perspective at the moment of publishing this Alert.
After Tuesday's reversal, gold has been treading water in a narrow consolidation. Certainly, it is an exceptional moment that it has challenged the mid-2013 highs. While that's exciting on its own, let's remember that it has failed in keeping gained ground. But it hasn't been really declining much since, one might rightfully object. So, is it taking a breather now? Just take a look at the strong miners' showing of yesterday. It shows that...
Before answering this pressing question and diving into the implications, let's turn to what we wrote about the fractal pattern in the gold market: the situation developed quite in tune with our expectations. But we still have two key things to address in today's Alert: the daily comeback of mining stocks, and the situation in the USD Index. As promised, let's start with the golden fractal.
The Fractal Lesson and Today
Do you remember how gold topped in 2011? Do you recall its immediate and sharp decline followed by a correction that hasn't made it to the previous high, and then - after a few months of pausing - making a final attempt to move higher but failing to break above the most recent high? And then, in April 2013, it truly plunged, which was immediately followed by a sharp correction and then the slide continued to new lows?
If you've been interested in the precious metals market at that time, you definitely remember - it was impossible to miss these moves.
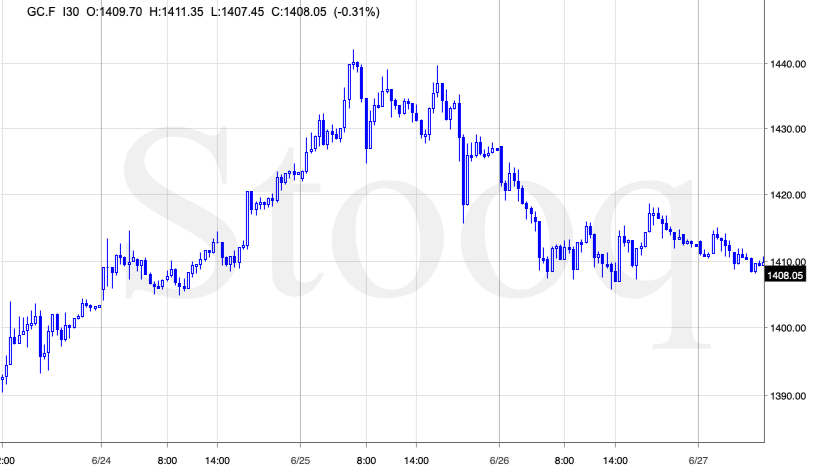
The beautiful thing here is that... The above chart doesn't feature it. These are not weekly or monthly candlesticks. These are 30-minute candlesticks and what you see above is what gold did in the last two days or so. You probably thought that it was gold's performance from 2013, because the price pattern is almost identical. Please take a look below for details.
Entirely different time frames, entirely different candlestick length, and yet, the pattern repeated itself almost to the letter. The fractal near-perfection.
We detected it during yesterday's session, but since it simply confirmed what we wrote in our regular Gold & Silver Trading Alert, we didn't send an intraday follow-up. What does it mean going forward?
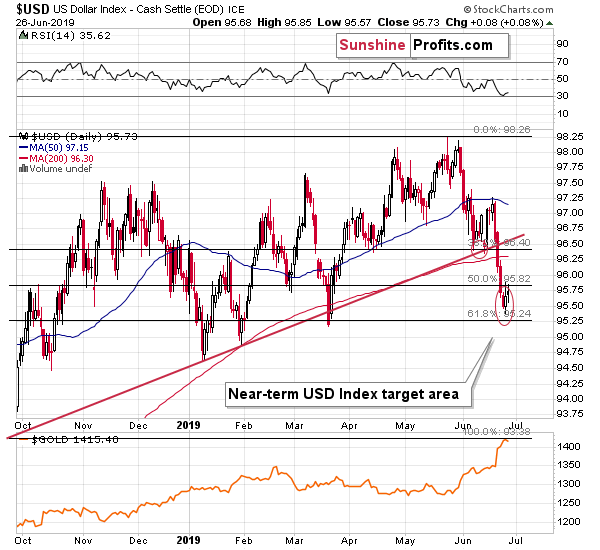
The similarity is likely to persist for some time. Unfortunately, we don't know for how long it's going to be the case, but it's definitely likely to remain in place for a day or two. Given the current volatility, a day or two can change quite a lot, so the above is important. What happened after the 2013 slide? Gold entered a few-years-long consolidation. Applying it to this week's terms, it means that we could see some back and forth trading today or tomorrow. This could be accompanied by another move lower in the USD Index, during which it reaches its 61.8% Fibonacci retracement level. Or it could be more or less random, or Twitter-politics based.
What the above doesn't tell us is what happens after the one- or two-day consolidation, and if gold is done declining in case of this immediate-term move. The volatility has been extraordinary recently, which means that gold could slide some more before today's daily bottom is reached. It might be the case that gold slides below $1,400 and then consolidates. This would complete the analogy to the long-term price pattern.
And this is where things are likely to get really interesting. You see, the fractal similarity works both ways. Gold's small (it could be just several hours) consolidation and a daily close below $1,400 could result in a powerful slide in the following hours (possibly tomorrow). Yesterday, we mentioned this week being critical, as it's where we'll get also the monthly and quarterly closing prices, which are paramount. This means that if the bearish picture remains intact, we should see a decline before the end of the week and that's more or less what we're getting right now. Let's move back to the similarity. If gold plunges in the following days and weeks, it will also indicate what gold is about to do from the long-term point of view - in the following months. Please assess gold's performance with regard to the overall volatility - it should provide a taste of what's to come (multiplied many times in terms of price and time).
We have indeed seen some back and forth movement in gold yesterday and overnight, just like we saw it in the previous years.
The consolidation is taking place above the $1,400 level and not below it and it seems that today's price action could turn out as the one that makes it clear what happens in the next several weeks. Actually, we already have myriads of signs pointing to lower precious metals prices and it's only gold's performance that "went rogue", so the overall bearish case has remained intact. Theoretically, tomorrow's closing price is the most important, but the USD Index and mining stocks both suggest that the really meaningful action could be seen as early as today.
The Clues to Tomorrow's Setup
The USD Index seems to have bottomed, especially that it moved 0.14 higher (so far) today. While the previous bottoms of similar importance - both January bottoms and the March bottom - formed through a single move lower, we can't rule out a case in which the USD Index bottoms in a double-bottom manner, just like it did early June. The second bottom could reach the 61.8% Fibonacci retracement that was not reached so far this week, which means that it's relatively close.
This means that gold might move higher one more time before declining, or that it might move higher in general. Naturally, based on multiple signs from other markets, ratios, volume readings etc., the continuation of gold's rally is unlikely. However, the above does indicate that if gold moves higher one more time today, we shouldn't necessarily panic as this move would be likely very brief.
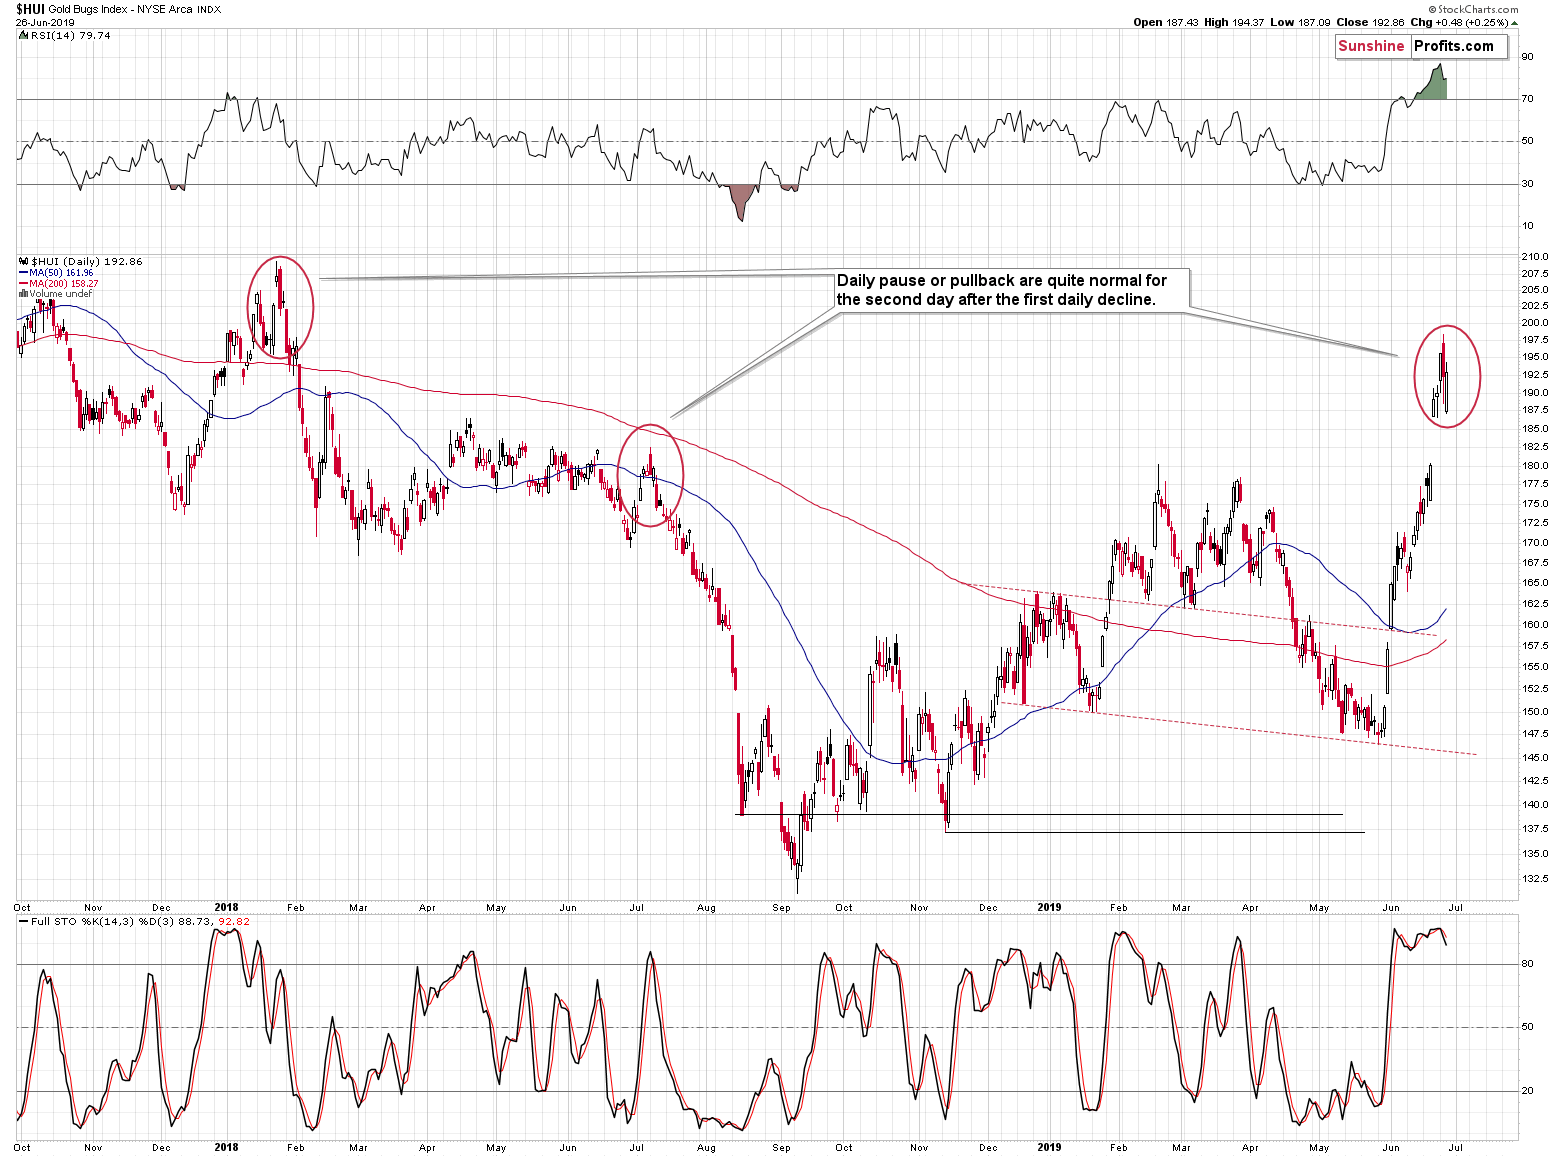
OK, but why did miners show strength once again yesterday? Doesn't it make Tuesday's decline just a daily pause?
No, it doesn't, because of what happened in gold. It moved briefly above its final resistance level and then it invalidated the breakout. That's what happens at the top, not during a daily pause.
Besides, yesterday's comeback is a typical way for miners to behave on the second day after the initial daily slide. We saw the same thing at the January 2018 top, and at the July 2018 top. Sometimes miners just pause, and sometimes they come back, just like they did yesterday. In particular, the July 2018 top was similar to what happened in the last two days. What happened next? A big daily decline. It's quite likely that we'll see one also today.
Summary
Summing up, gold paused yesterday and earlier today while the miners' showed daily strength yesterday, but both events appear perfectly normal during this part of the decline. The gold-silver ratio, silver itself, gold stocks to gold ratio, the size of the upswing in the gold stocks, and the situation in the USD Index, and gold's invalidation of the breakout above the mid-2013 high all suggest that the most recent move higher in the precious metals sector is nothing more than just a corrective upswing within a bigger trend. It is only the gold price itself that can make one wonder if gold has truly broken out and that it will now continue to soar. This is doubtful, because this strength is not confirmed, as it happened right after a series of rather chaotic and surprising news. Adding extremely positive sentiment as confirmed by volume across the precious metals board and the very strong triple vertex-based reversal indication, makes the outlook for gold much less bullish that everyone and their brother would have you believe. Please note that we are not "married" to the bearish outlook for gold and we will return to viewing the medium-term outlook as bullish, but not until the cold analytical facts suggest that the tables have indeed turned. This is not the case right now - please take a look at today's charts for details. In particular, it's a bad idea to adjust one's outlook just because many people got excited. The excitement itself is a sign of a turnaround, not something to take at face value.
As always, we'll keep you - our subscribers - informed.
To summarize:
Trading capital (supplementary part of the portfolio; our opinion): Full short position (250% of the full position) in gold, silver, and mining stocks is justified from the risk/reward perspective with the following stop-loss orders and exit profit-take price levels:
- Gold: profit-take exit price: $1,241; stop-loss: $1,452; initial target price for the DGLD ETN: $51.87; stop-loss for the DGLD ETN $31.67
- Silver: profit-take exit price: $13.81; stop-loss: $16.32; initial target price for the DSLV ETN: $39.38; stop-loss for the DSLV ETN $23.87
- Mining stocks (price levels for the GDX ETF): profit-take exit price: $17.61; stop-loss: $26.47; initial target price for the DUST ETF: $34.28; stop-loss for the DUST ETF $9.87
In case one wants to bet on junior mining stocks' prices (we do not suggest doing so - we think senior mining stocks are more predictable in the case of short-term trades - if one wants to do it anyway, we provide the details), here are the stop-loss details and target prices:
- GDXJ ETF: profit-take exit price: $24.71; stop-loss: $37.17
- JDST ETF: profit-take exit price: $78.21 stop-loss: $22.47
Long-term capital (core part of the portfolio; our opinion): No positions (in other words: cash)
Insurance capital (core part of the portfolio; our opinion): Full position
Whether you already subscribed or not, we encourage you to find out how to make the most of our alerts and read our replies to the most common alert-and-gold-trading-related-questions.
Please note that the in the trading section we describe the situation for the day that the alert is posted. In other words, it we are writing about a speculative position, it means that it is up-to-date on the day it was posted. We are also featuring the initial target prices, so that you can decide whether keeping a position on a given day is something that is in tune with your approach (some moves are too small for medium-term traders and some might appear too big for day-traders).
Plus, you might want to read why our stop-loss orders are usually relatively far from the current price.
Please note that a full position doesn't mean using all of the capital for a given trade. You will find details on our thoughts on gold portfolio structuring in the Key Insights section on our website.
As a reminder - "initial target price" means exactly that - an "initial" one, it's not a price level at which we suggest closing positions. If this becomes the case (like it did in the previous trade) we will refer to these levels as levels of exit orders (exactly as we've done previously). Stop-loss levels, however, are naturally not "initial", but something that, in our opinion, might be entered as an order.
Since it is impossible to synchronize target prices and stop-loss levels for all the ETFs and ETNs with the main markets that we provide these levels for (gold, silver and mining stocks - the GDX ETF), the stop-loss levels and target prices for other ETNs and ETF (among other: UGLD, DGLD, USLV, DSLV, NUGT, DUST, JNUG, JDST) are provided as supplementary, and not as "final". This means that if a stop-loss or a target level is reached for any of the "additional instruments" (DGLD for instance), but not for the "main instrument" (gold in this case), we will view positions in both gold and DGLD as still open and the stop-loss for DGLD would have to be moved lower. On the other hand, if gold moves to a stop-loss level but DGLD doesn't, then we will view both positions (in gold and DGLD) as closed. In other words, since it's not possible to be 100% certain that each related instrument moves to a given level when the underlying instrument does, we can't provide levels that would be binding. The levels that we do provide are our best estimate of the levels that will correspond to the levels in the underlying assets, but it will be the underlying assets that one will need to focus on regarding the signs pointing to closing a given position or keeping it open. We might adjust the levels in the "additional instruments" without adjusting the levels in the "main instruments", which will simply mean that we have improved our estimation of these levels, not that we changed our outlook on the markets. We are already working on a tool that would update these levels on a daily basis for the most popular ETFs, ETNs and individual mining stocks.
Our preferred ways to invest in and to trade gold along with the reasoning can be found in the how to buy gold section. Additionally, our preferred ETFs and ETNs can be found in our Gold & Silver ETF Ranking.
As a reminder, Gold & Silver Trading Alerts are posted before or on each trading day (we usually post them before the opening bell, but we don't promise doing that each day). If there's anything urgent, we will send you an additional small alert before posting the main one.
=====
Latest Free Trading Alerts:
What a week! On Tuesday, gold prices hit a six-year peak of almost $1,440. But they declined since then to almost $1,400. What is happening? We got the Fed speaking... Let's dive in to the implications of what has been said.
Gold Declines As the Fed Dampens Rate Cut Expectations
Stocks were mixed on Wednesday, as investors hesitated following Tuesday's decline. The S&P 500 index reached the new record high of 2,964.15 on Friday. Then it broke below the 2,950 mark and it retraced most of the recent rally. So was it a downward reversal or just another short-term correction?
S&P 500: Will Tuesday's Decline Resume?
=====
Thank you.
Sincerely,
Przemyslaw Radomski, CFA
Editor-in-chief, Gold & Silver Fund Manager


