Briefly: in our opinion, full speculative long position in silver is justified from the risk/reward point of view at the moment of publishing this Alert.
Gold, silver, and mining stocks rallied visibly yesterday, but they also declined quite markedly - especially the miners. At this time, you might be wondering if the corrective upswing is already over. That's the question we'll aim to reply to in today's analysis.
Let's start with examining what exactly happened yesterday.
The Short-Term in PMs
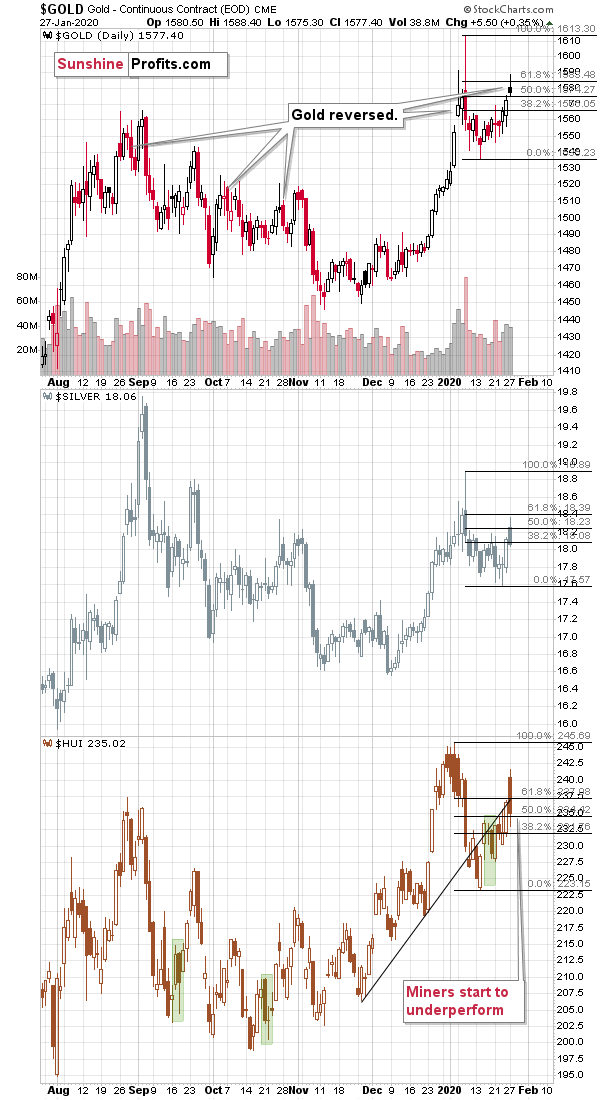
Gold reversed on an intraday basis, but still ended the session $5.50 higher. The volume was big, but not enormous. So, it might be the case that it confirmed a top, but it doesn't have to be the case. Similar situations from the recent past show all kinds of immediate-term follow-ups for gold's intraday reversals that were not accompanied by huge volume.
In August, it was close to the top, but not yet it. In early October, it was the intraday top, but there were quite a few days to switch sides and short gold after that top. And in late October, gold declined but merely for two days, only to come back up and then slide.
The overall takeaway here is that gold is likely very close to the top, but it might not be at it just yet.
Silver closed slightly lower after rallying early in the day. It rallied more or less in tune with gold. It didn't lag gold, and it didn't outperform either. While it might have been the case that silver topped yesterday, the shape of silver's session by itself doesn't "scream it" just yet, for instance like it screamed in late August, where its outperformance of gold was crystal clear.
Gold stocks moved sharply higher early in the day, but they closed the session lower, even though gold closed higher.
Interestingly, in case of the GLD ETF, we saw a close at a new yearly high (gold futures trade almost 24h / day, but the GLD ETF doesn't) while neither the HUI Index nor the GDX ETF did. Miners are underperforming gold once again.
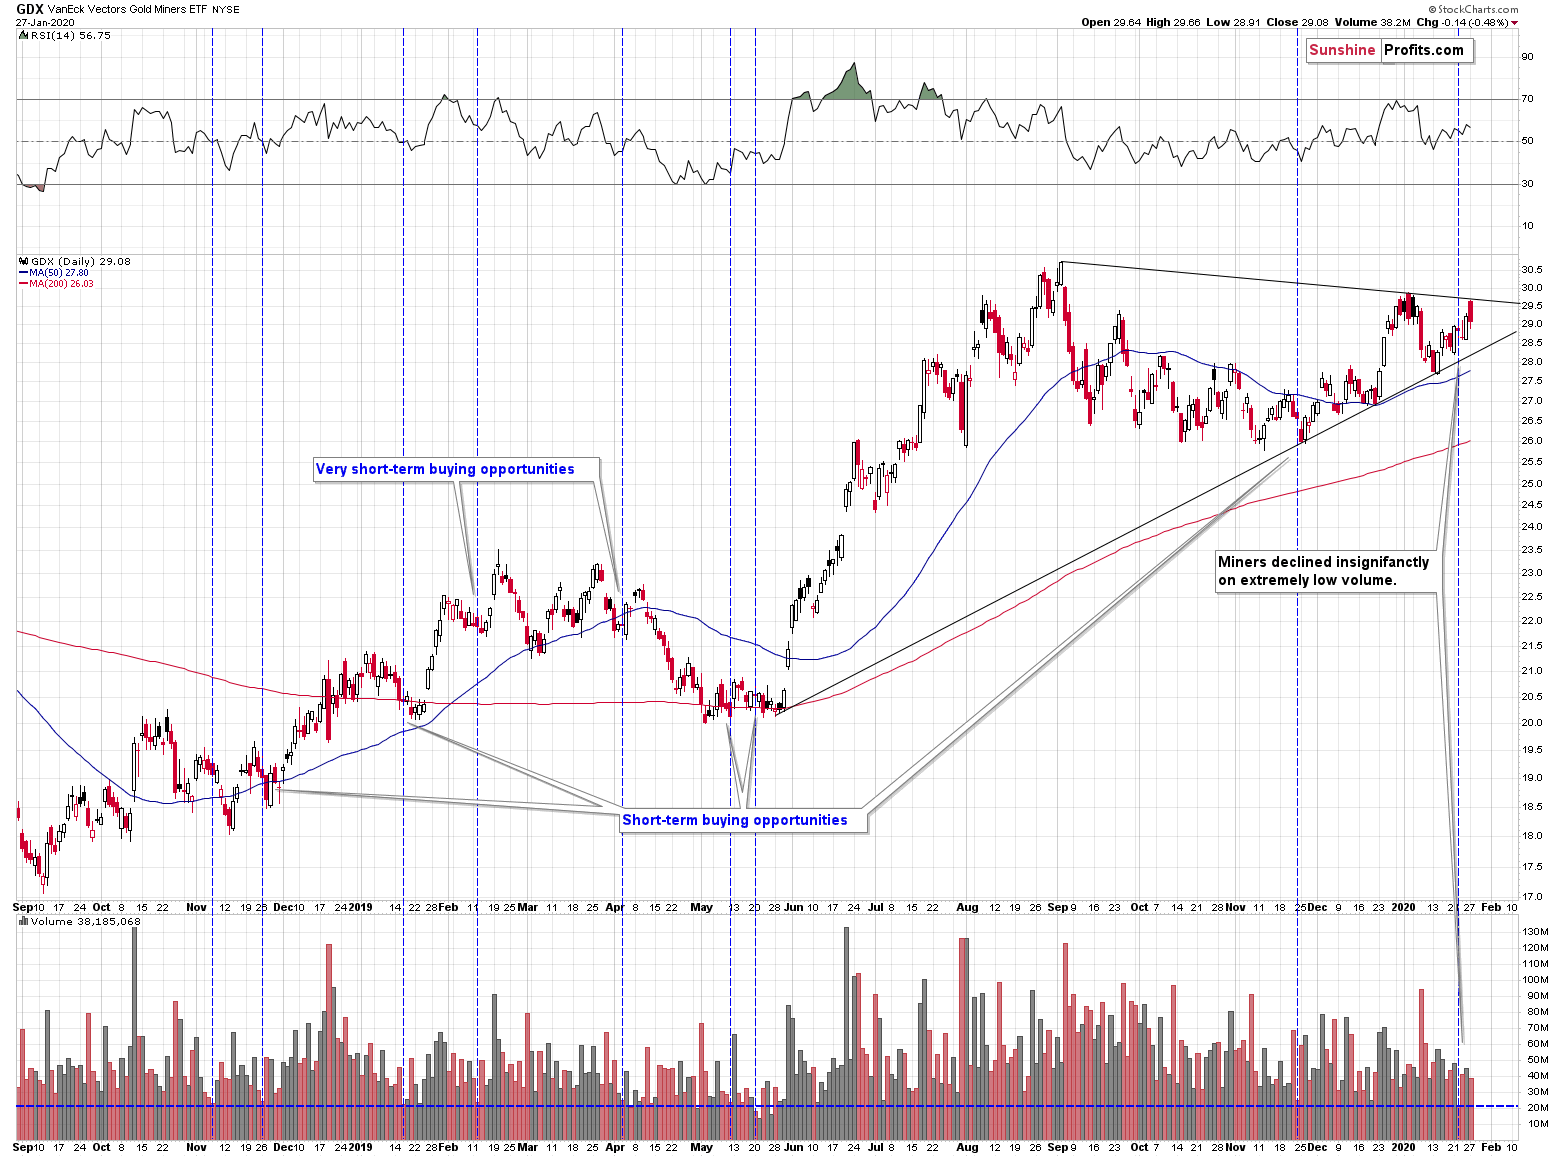
In fact, while this may have not been the case with gold or silver, miners might have formed their top yesterday, as GDX reached its declining resistance line.
With silver's performance being relatively average, and miners starting to underperform gold, it seems that we are entering the final part of the short-term upswing.
During this part, it would be natural to expect miners to continue to underperform and silver to rally particularly strongly on a short-term or even intraday basis. In case of miners, we might see a repeat of what we saw in early January. While gold and silver were moving to new highs, miners refused to do so.
There are two triggers that could make gold and - especially - silver move higher in the following days and then top.
We already wrote about the first one in the previous Alerts - it's a good possibility of seeing a pullback in the USD Index.
USD Index Examination
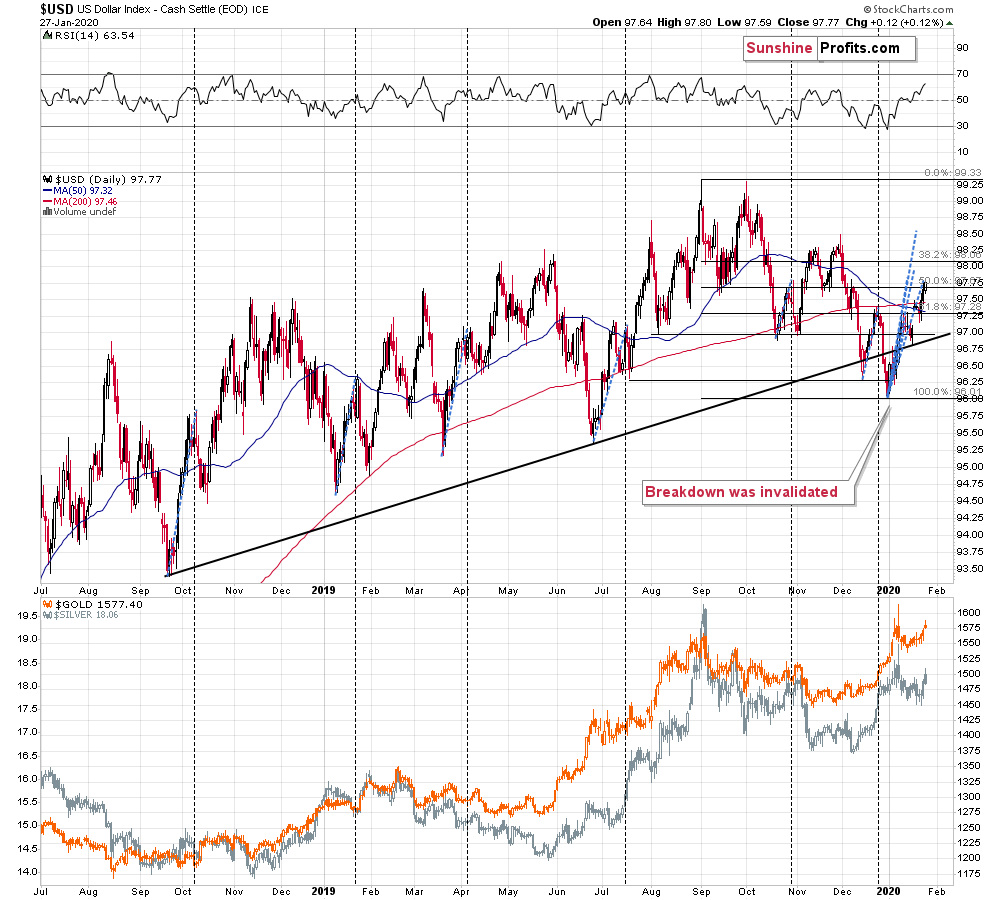
We previously wrote that it was about "time" for the USD Index to correct based on the lengths of the previous post-bottom rallies. Before taking its first breather, the USDX used to rally for about 2 weeks and applying the same to the recent bottom implied some sort of pullback.
What makes the situation unclear is the fact that we already saw "some sort of pullback". It was not as big as the previous pullbacks, but it was definitely present. So, at this time it's not clear if the bigger pullback is still just around the corner, or if it had already taken place.
Of course, there's more to the precious metals market than just the USD Index, and the PMs did move higher as we had indicated based on their own signals - short-term strength in the miners and gold's daily reversal.
What can we tell about the following days in the PMs based on what the USDX is doing? If the USD Index does correct, the PMs are likely to rally once again for a few days. If the USD Index continues to rally, the PMs are likely to decline, but not necessarily right away. After all, gold was able to hold up relatively well despite USD's comeback to the mid-December high and the PMs were able to rally in the recent days despite USD's short-term strength.
This means that even if the USDX's pullback is already over, we are still likely a day or a few days away from the PMs short-term outlook becoming very bearish. Depending on what the USDX does and how gold reacts to it, we'll most likely get either confirmations that the local top in the PMs is already in (but without a major decline initially) or that several days of higher prices are still ahead.
On one hand, based on the gold-USD link, it seems that we should wait for the USD Index to correct before exiting the long position in silver. After all, the PMs were able to rally without USD's help, which means that when they finally receive this help, they are likely to spike even higher.
On the other hand, if the positive USD-PMs link persists, perhaps they could both top at the same time. This could take place if the reason behind the current simultaneous rally in USD and PMs are the worries regarding the coronavirus spreading in China. Once the situation is under control, the safe-haven demand for both: USD and PMs is likely to decline.
This means that a rally in PMs based on USD's decline is quite possible, but not imminent.
This brings us to the second possible trigger for a short-term upswing.
It's the uncertainty regarding the next Fed's move. The next FOMC Monetary Policy Statement will be released tomorrow and markets are known to be quite chaotic around this kind of news.
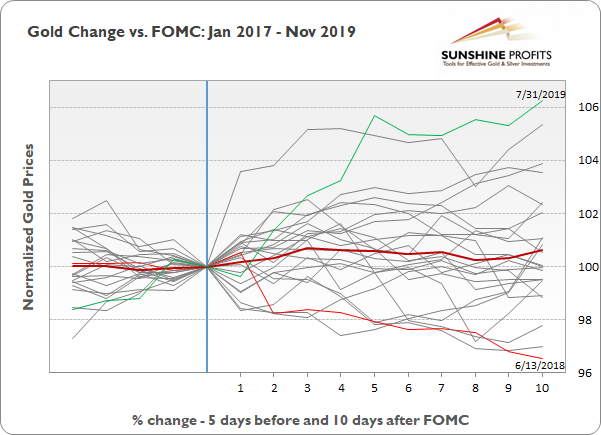
The below chart (taken from yesterday's Market News Report) shows how gold performed right before and right after the Fed's decisions.
The thick red line is the average gold performance around the rate decisions, and it doesn't show anything interesting. On average, the rate decisions don't matter that much. But it doesn't mean that they don't matter at all. After all, my dog and I have on average 3 legs. What really matters here is not the average, but how much the situation usually differs from the average and that's what the above chart shows.
It's based on the past 3 years and it shows how gold performed. There were quite visible price changes (both: positive and negative) between the closing prices of the day right before the rate decision, on the day of the rate decision, and on the trading day that immediately followed the rate decision.
And this doesn't even take into account the intraday volatility which tends to be particularly big right before and right after the rate announcement (and during the press conference).
Combining this with the fact that the next long-term triangle-based reversal for the HUI Index is just a few days away, it seems that we might get one final run-up before the trend for gold and silver turns.
Speaking of reversing trends, in yesterday's analysis (this week's flagship Gold & Silver Trading Alert, which we highly recommend reading if you haven't had the chance to do so yet) we wrote that both: platinum and palladium are likely topping, but that palladium would be likely to fall more than platinum as it seems very overvalued on a short-term basis. Palladium declined over 6% yesterday, while platinum declined 1.87%.
Before summarizing, we would like to reply to a question that we just received from one of our subscribers:
Your charts analysis points to an imminent correction in the p.m. market (unless the $ drops back) and further downside this year and possibly next. However, with the mega
govt. debt giving rise to concern and many countries buying more gold, what weight, if any, do you give to this factor by comparison to historical price patterns pointing to their recurrence?
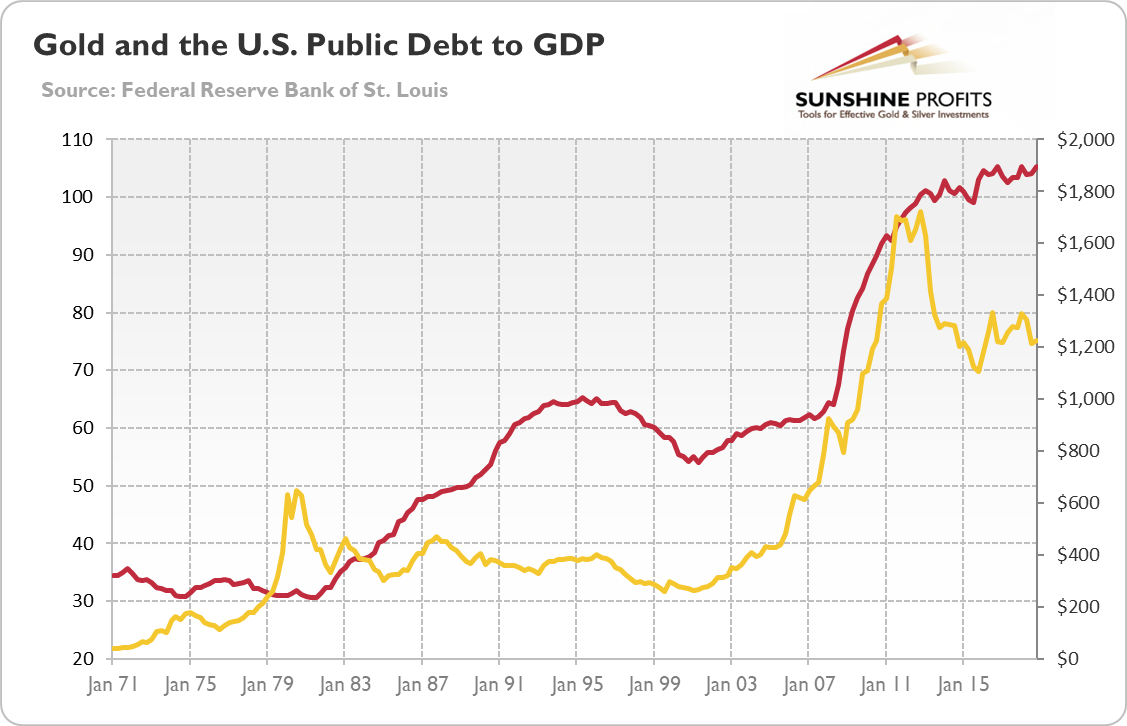
Thank you for the question. The massive increase in the debt is one of the factors due to which we expect gold to soar in the following years, but it's not a reason for us to expect any kind of performance of the yellow metal in the next 12-18 months or so. The link is of very long-term nature, and it's not even a long-term one.
The chart below features the U.S. Public debt ratio and the price of gold.
Gold declined hundreds of dollars between 2011 and 2015 while the debt-to-gdp ratio continued to climb higher. Moreover, gold declined between 1980 and 1999 despite a massive increase in the ratio.
Gold declining hundreds of dollars from without any change in the debt-to-gdp ratio would actually be quite normal given what happened in the previous decades. Consequently, while it's a factor based on which gold is likely to be much higher in the next 5 years or so, it's unlikely to prevent gold's slide this year.
As far as the official sector's purchases are concerned, we realize that this is something that is likely catching a lot of attention as it looks like if governments want to buy something, you can't go wrong with such investment, but... The reality is that the governments are one of the worst investors. They buy high and they sell low. The sale of the British gold between 1999 and 2002 actually created the bottom in gold prices and is known as the Brown bottom due to the name of the person responsible for the tragic sale.
So, if we wanted to attribute any significant weight to the official sector's purchases of gold, it would actually be a bearish factor for the following months. But, it's a relatively weak factor, especially with regard to making specific timing forecasts, so it seems best to rely on other, proven tools.
Having said that we would like to clarify two things. One is that we don't view any market moves (especially short-term moves) as imminent. The PMs are likely to move higher in the next several hours - days, and then to decline once again, but it doesn't have to happen. We are monitoring the market for signs that would invalidate our analysis and as soon as the situation changes, we will promptly report it to you.
The second thing is what we call a correction and what we don't. It's not really important what you call a given move (only its direction and profits that can be made on it), but for the sake of clarity...
We do think that the precious metals market is likely to top and decline soon, but we don't call the upcoming decline a correction. The reason is that we think that the medium-term trend in the precious metals market remains down. There are many more reasons that we outlined yesterday, but to name just one - gold didn't erase more than the 61.8% of the 2011 - 2015 decline while silver and mining stocks erased very little from that decline (taking the long-term point of view into account). Consequently, the current upswing is a correction in our view and the upcoming decline will be a return to the main medium-term trend.
Summary
Summing up, as gold stocks underperform and silver is just starting to outperform gold, the precious metals sector appears to be in the final stage of the short-term upswing. It seems that this week might include the top in the precious metals market and the end of the short-term rally. It seems likely that the next top in gold and silver will form close to tomorrow's interest rate decision, perhaps as a result of a pre-announcement uncertainty spike or perhaps as the initial reaction to the decision. Either way, the medium-term outlook remains very bearish and once the short-term correction is over, the declines are likely to resume.
Today's pre-market downswing may appear discouraging, but it's very much in tune with what happened between Jan 6 and Jan 7. And silver topped at a fresh high on Jan 8.
Once silver hits $18.49, your profits from the long position will be automatically taken off the table, but we will let you know whether we want to automatically open short positions at that time.
As always, we'll keep you - our subscribers - informed.
To summarize:
Trading capital (supplementary part of the portfolio; our opinion): Full speculative long position (100% of the full position) in silver is justified from the risk/reward perspective with the following stop-loss orders and binding exit profit-take price levels:
- Silver futures: profit-take exit price: $18.49; stop-loss: $17.46; initial target price for the USLV ETN: $99.97; stop-loss for the USLV ETN: $84.49
Long-term capital (core part of the portfolio; our opinion): No positions (in other words: cash)
Insurance capital (core part of the portfolio; our opinion): Full position
Whether you already subscribed or not, we encourage you to find out how to make the most of our alerts and read our replies to the most common alert-and-gold-trading-related-questions.
Please note that the in the trading section we describe the situation for the day that the alert is posted. In other words, it we are writing about a speculative position, it means that it is up-to-date on the day it was posted. We are also featuring the initial target prices, so that you can decide whether keeping a position on a given day is something that is in tune with your approach (some moves are too small for medium-term traders and some might appear too big for day-traders).
Plus, you might want to read why our stop-loss orders are usually relatively far from the current price.
Please note that a full position doesn't mean using all of the capital for a given trade. You will find details on our thoughts on gold portfolio structuring in the Key Insights section on our website.
As a reminder - "initial target price" means exactly that - an "initial" one, it's not a price level at which we suggest closing positions. If this becomes the case (like it did in the previous trade) we will refer to these levels as levels of exit orders (exactly as we've done previously). Stop-loss levels, however, are naturally not "initial", but something that, in our opinion, might be entered as an order.
Since it is impossible to synchronize target prices and stop-loss levels for all the ETFs and ETNs with the main markets that we provide these levels for (gold, silver and mining stocks - the GDX ETF), the stop-loss levels and target prices for other ETNs and ETF (among other: UGLD, DGLD, USLV, DSLV, NUGT, DUST, JNUG, JDST) are provided as supplementary, and not as "final". This means that if a stop-loss or a target level is reached for any of the "additional instruments" (DGLD for instance), but not for the "main instrument" (gold in this case), we will view positions in both gold and DGLD as still open and the stop-loss for DGLD would have to be moved lower. On the other hand, if gold moves to a stop-loss level but DGLD doesn't, then we will view both positions (in gold and DGLD) as closed. In other words, since it's not possible to be 100% certain that each related instrument moves to a given level when the underlying instrument does, we can't provide levels that would be binding. The levels that we do provide are our best estimate of the levels that will correspond to the levels in the underlying assets, but it will be the underlying assets that one will need to focus on regarding the signs pointing to closing a given position or keeping it open. We might adjust the levels in the "additional instruments" without adjusting the levels in the "main instruments", which will simply mean that we have improved our estimation of these levels, not that we changed our outlook on the markets. We are already working on a tool that would update these levels on a daily basis for the most popular ETFs, ETNs and individual mining stocks.
Our preferred ways to invest in and to trade gold along with the reasoning can be found in the how to buy gold section. Additionally, our preferred ETFs and ETNs can be found in our Gold & Silver ETF Ranking.
As a reminder, Gold & Silver Trading Alerts are posted before or on each trading day (we usually post them before the opening bell, but we don't promise doing that each day). If there's anything urgent, we will send you an additional small alert before posting the main one.
Thank you.
Sincerely,
Przemyslaw Radomski, CFA
Editor-in-chief, Gold & Silver Fund Manager


