Briefly: in our opinion, full (300% of the regular position size) speculative short positions in junior mining stocks are justified from the risk/reward point of view at the moment of publishing this Alert.
Today’s short-term analysis will once again be in video format. However, to make a long story short, the precious metals sector declined yesterday, and what we wrote previously remains up-to-date.
https://www.youtube.com/watch?v=aVv4mlMRW4Q&ab_channel=GoldPriceForecast
Waning Momentum Spells Trouble for Gold
With risk assets running out of ‘narrative’ gas on Jan. 17, the bulls need new fundamental catalysts to maintain the upward momentum. However, with investors’ confidence showing signs of slippage, sharp reversals should unfold sooner rather than later.
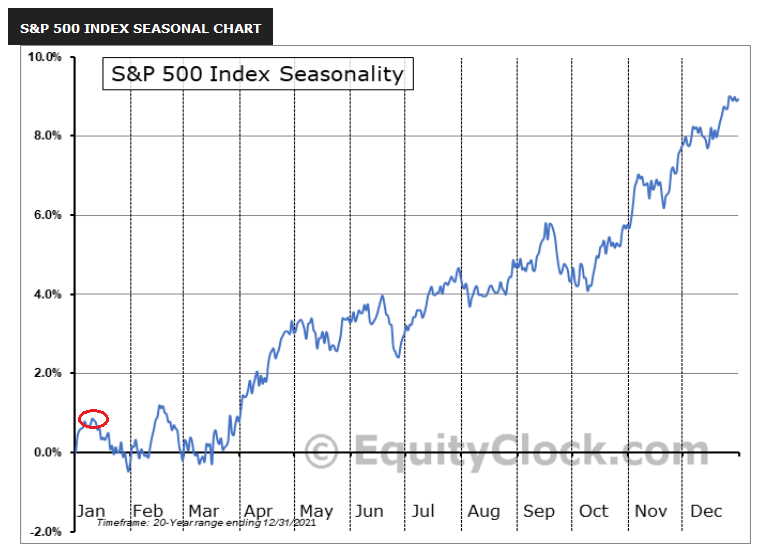
For example, bullish seasonality helped underwrite the S&P 500’s uprising in recent months. But, with the seasonality clock now bearish, the crowd will have a tough time ignoring the deteriorating fundamental backdrop.
Please see below:
To explain, the red circle on the left side of the chart above shows that S&P 500 seasonality often turns in mid-January, and the negativity persists until the end of the month. As a result, the pressure should mount in the days ahead.
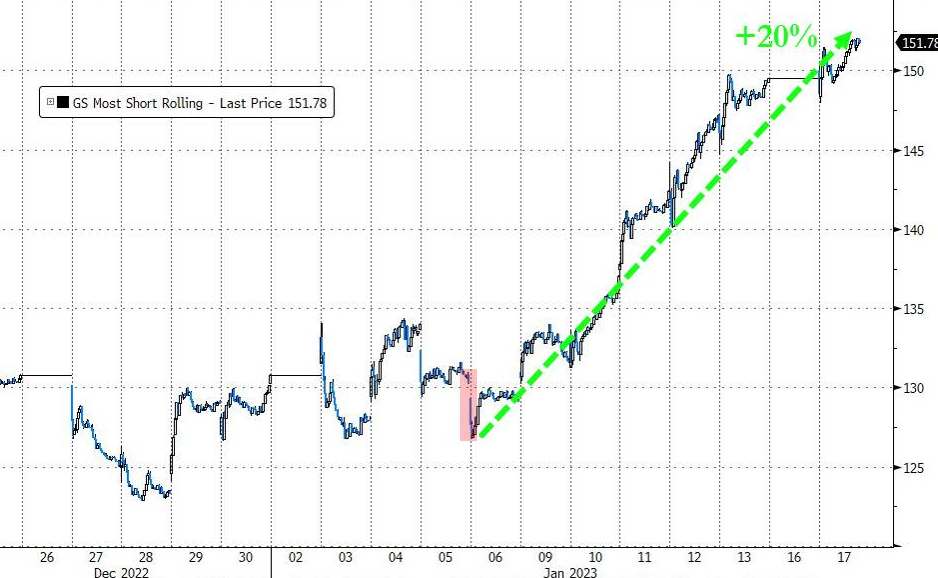
Even more revealing, the stock market’s recent optimism has been driven by short-covering, not economic enthusiasm. As evidence, Goldman Sachs’ basket of the most-shorted stocks has materially outperformed in January.
Please see below:
To explain, the index has jumped by 20% since the post-non-farm payrolls dip, and the squeeze highlights why the strength is unlikely to last. In other words, when a ‘dash for trash’ drives the S&P 500 higher, it sets the stage for another sell-off.
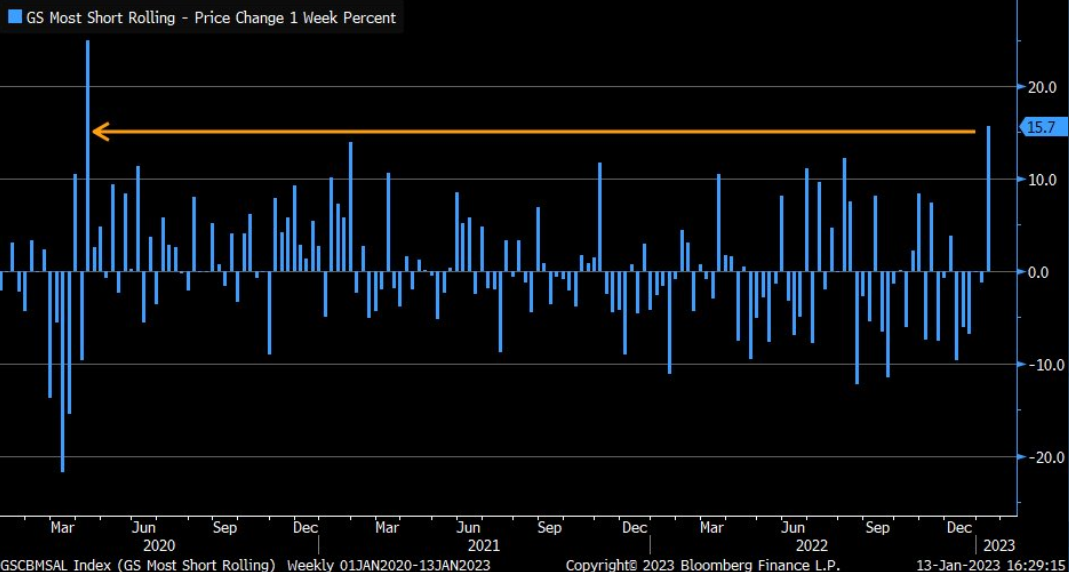
As further evidence, the basket had its best weekly performance since April 2020.
Please see below:
To explain, the blue bar on the right side of the chart above shows how the index soared by 15.7% last week; and with great dispersions often preceding great reversions, a sharp reversal of fortunes should weigh heavily on the S&P 500.
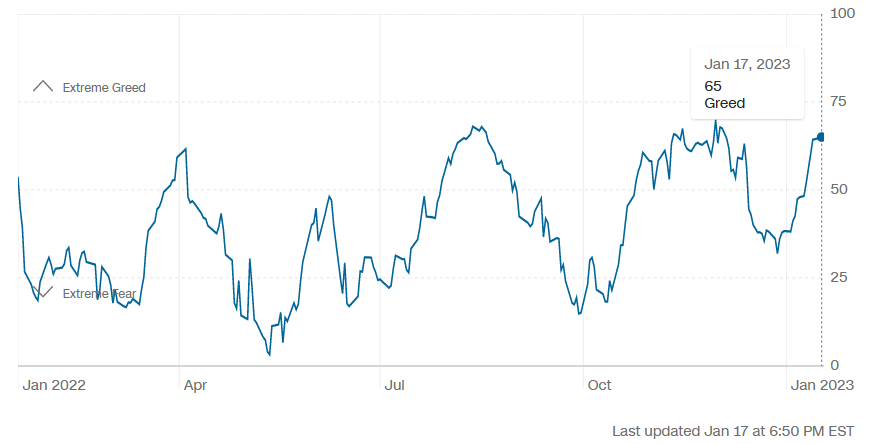
On top of that, CNN’s Fear & Greed Index is near levels that coincided with 2022 reversals.
Please see below:
To explain, the index hit 65 on Jan. 17, and the April, August and November highs were 62. 68 and 70. As such, optimism is abound, and investors are often the most bullish near the top.
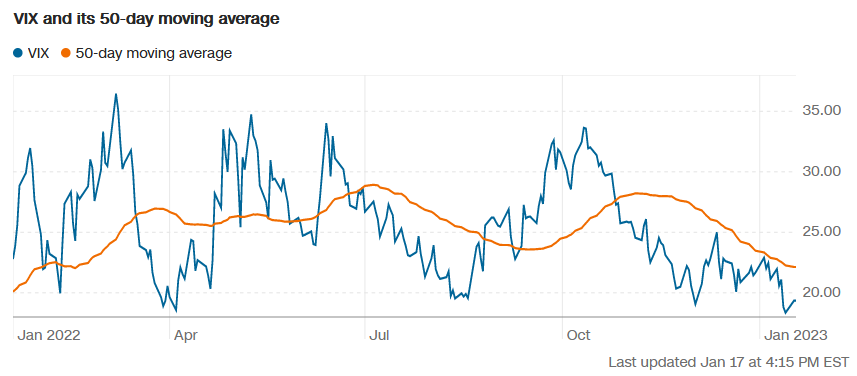
From the opposite angle, the Cboe Volatility Index (VIX) – which measures the S&P 500’s expected volatility over the next 30 days – is also at levels that signal an upcoming bout of negativity.
Please see below:
To explain, the blue line above tracks the VIX, while the orange line above tracks its 50-day moving average. If you analyze the right side of the chart, you can see that the VIX (< 20) is near the troughs that preceded the sell-offs in April, August and November. Thus, when combined with CNN’s Fear & Greed Index, the setup has profoundly bearish undertones.
Now, while these measures have short-term implications, the S&P 500’s medium-term backdrop is also highly bearish; and due to the interconnectedness of the financial markets, the cascading effect often impacts gold. So, if the S&P 500 still has considerable fundamental downside, the PMs are unlikely to celebrate the sell-off.
Please see below:
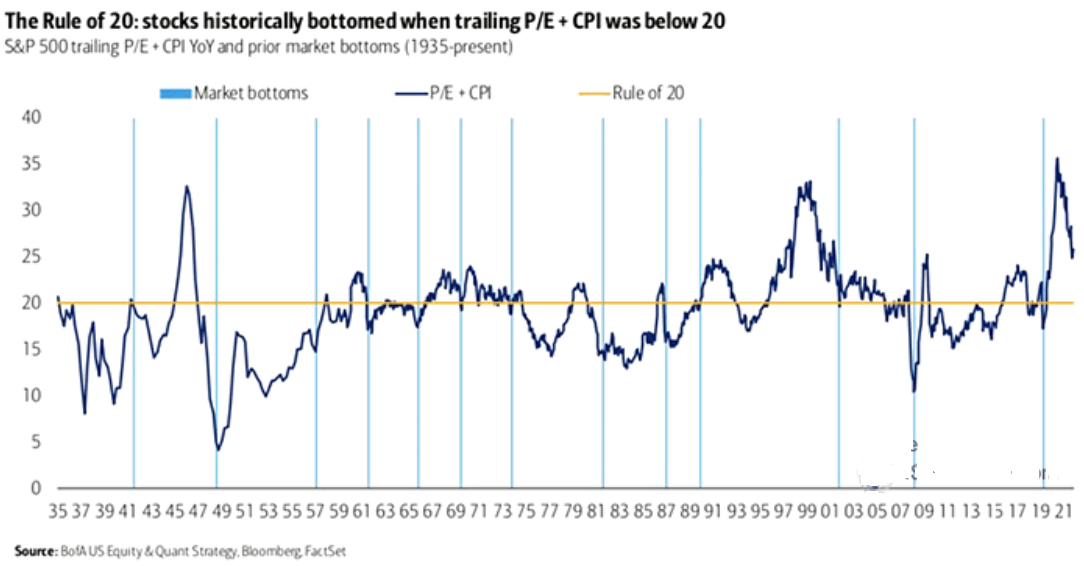
To explain, Bank of America found that the S&P 500 has never recorded a lasting bottom until the ‘Rule of 20’ is satisfied. For context, it means that when the S&P 500’s trailing price-to-earnings (P/E) ratio plus the year-over-year (YoY) percentage change in the headline Consumer Price Index (CPI) exceeds 20, the bear market still has room to run.
Furthermore, if you analyze the right side of the chart, you can see that the blue line remains above the bottom threshold (the brown horizontal line), which means that one of two outcomes must occur to satisfy the rule: either the YoY CPI declines rapidly, or the S&P 500’s trailing P/E falls; and with the latter much more likely than the former in our view, the short and medium-term outlooks for the index are bearish.
Also noteworthy, we’ve highlighted the importance of the Atlanta Fed’s Sticky CPIs on numerous occasions. In a nutshell: they are better gauges because they measure broad-based inflation across items that change price infrequently; and with the headline and core Sticky CPIs hitting new highs for 17 straight months, their strength contrasts the energy-driven declines in the headline CPI, which the crowd has celebrated.
Yet, the core Sticky CPI's ascent is bullish for the U.S. federal funds rate (FFR).
Please see below:
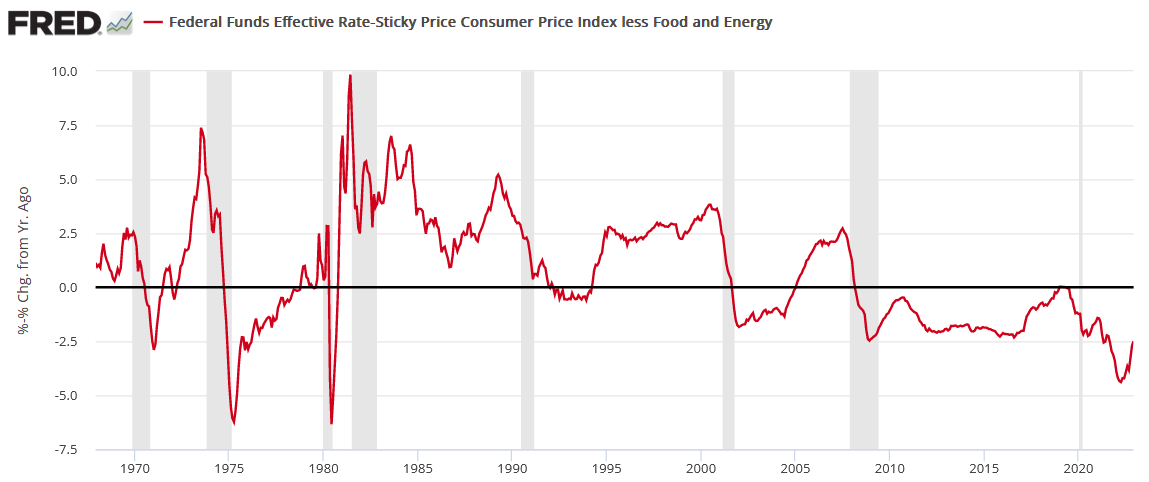
To explain, the red line above subtracts FFR from the YoY percentage change in the core Sticky CPI. The important development is that before the Fed ends its rate hike cycles, the spread between the FFR and the YoY core Sticky CPI always turns positive.
If you analyze the peaks and valleys, you can see that anytime the spread turned negative since 1967 (YoY core Sticky CPI > FFR), it returned to positive territory. Even in 2019, the metric hit 0.03%. Therefore, with the core Sticky CPI hitting 6.61% YoY in December (a new cycle high), and the current spread of -2.5% nowhere near equilibrium, the FFR should have plenty of room to run.
For context, the spread was negative post-GFC, but inflation was a non-issue then, and the FFR could remain near zero. Conversely, the current environment is much different.
Finally, while seasonality, sentiment, and the medium-term fundamentals remain highly ominous for several risk assets, another interesting development is unique to gold.
Please see below:
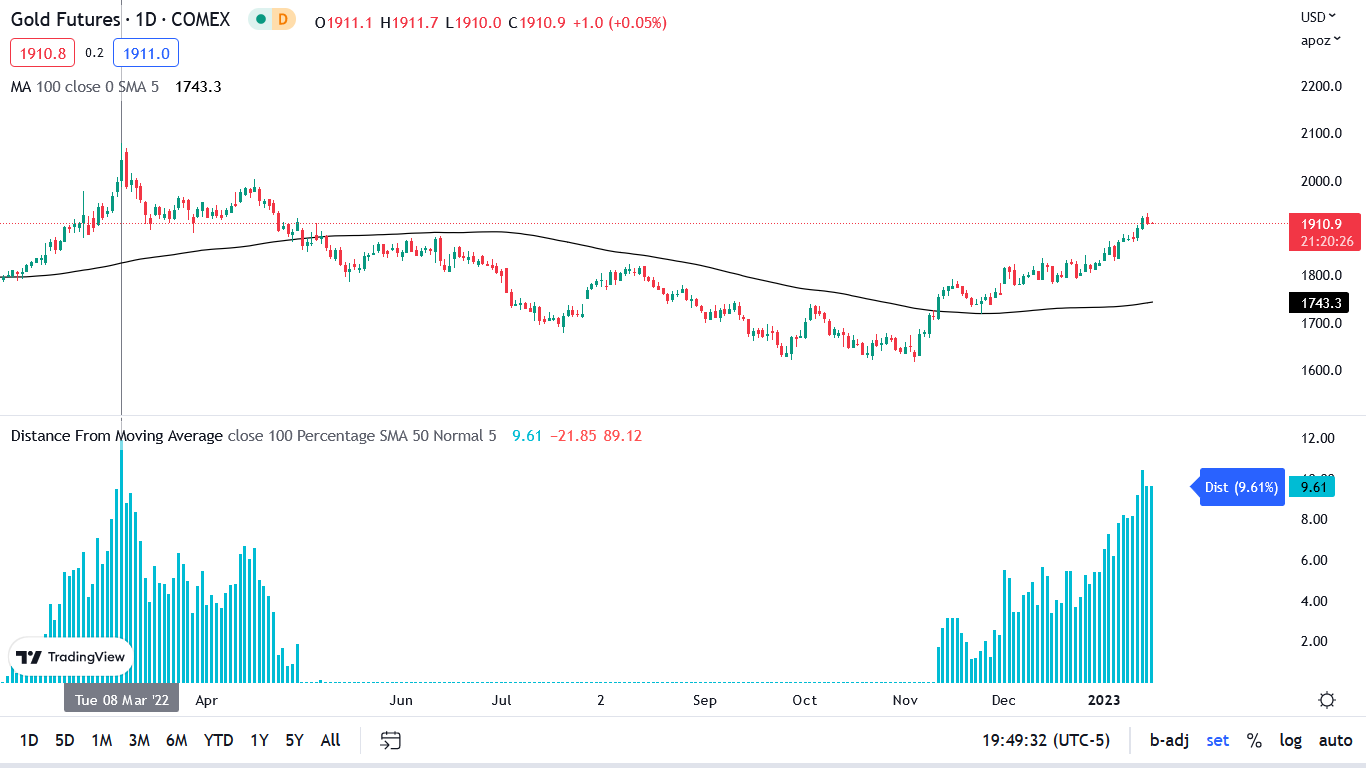
To explain, the candlesticks above track the gold futures price, the black line above represents its 100-day moving average, and the blue bars at the bottom represent the percentage distance between the daily price and the 100-day MA.
If you analyze the left side of the chart, you can see that the Russia-Ukraine crisis pushed the gold futures price 11.91% above its 100-day MA on Mar. 8, 2022. But, the development marked peak optimism, and gold suffered mightily in the months ahead.
Likewise, the recent optimism pushed the gold futures price 10.42% above its 100-day MA on Jan. 13. So, while we’ve noted that investors are often the most bearish at the bottom and the most bullish at the top, the recent euphoria rivals the optimism from March, and a reconnection with the 100-day MA implies a pullback below $1,750.
Overall, while the fundamental backdrop has always been bearish, the sentiment setup also supports lower precious metals prices. Consequently, we view the risks as heavily skewed to the downside, especially for silver and mining stocks.
How are you playing the seasonality shift? Will earnings optimism outweigh the S&P 500’s mid-January sorrow? And how concerned should the gold bulls be about the current setup’s ominous similarity to March?
Can Silver Hold $24?
With a deluge of economic data hitting the wire this week and earnings season underway, sentiment should be tested as the fundamentals remain problematic. Moreover, while we’ve warned repeatedly that a cash-rich U.S. consumer is bullish for the FFR, Bank of America CEO Brian Moynihan – who runs the second-largest U.S. bank – said on Jan. 17:
“The consumers are spending, their wages are growing and frankly, there's still a lot of stimulus (…). The money in their accounts continues to be solid.”
As a result:
“[The FOMC] may leave [rates] higher for longer just to make sure they squeeze out that services-side inflation.”
He also said during the Q4 earnings call on Jan. 13:
“Consumer deposit balances continue to show strong liquidity, with the lower cohorts of our consumers continue to hold several multiples of balances they have as the pandemic began. These balances are drifting down, but they still have plenty of cushion left.”
Furthermore, the bank’s delinquency data highlights why the average consumer remains in a strong position, and the resiliency is bullish for the FFR.
Please see below:
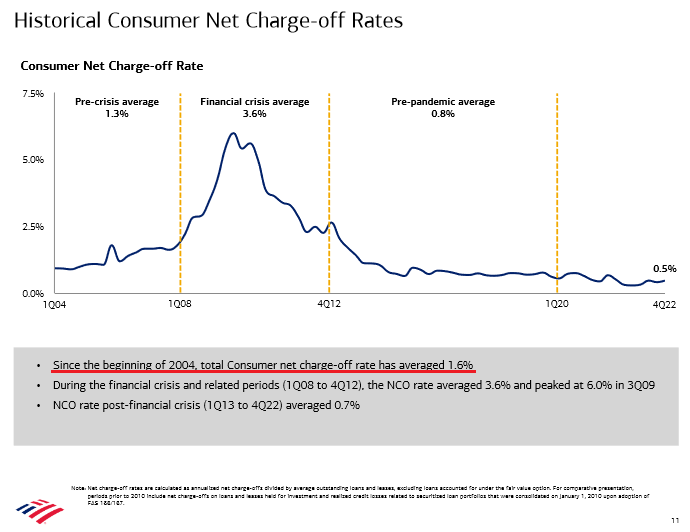
To explain, the consumer charge-off rate (percentage of debt unlikely to be collected) has averaged 1.6% since 2004 and was 3.6% during the GFC (peaked at 6% in Q3 2009). In contrast, the blue line on the right side of the chart shows that the current charge-off rate is 0.5%, which is even less than the 0.8% realized pre-pandemic.
As such, the Fed’s 2022 rate hikes have not led to widespread defaults, and it’s an indicator of why the demand destruction that often coincides with dovish pivots is not present now.
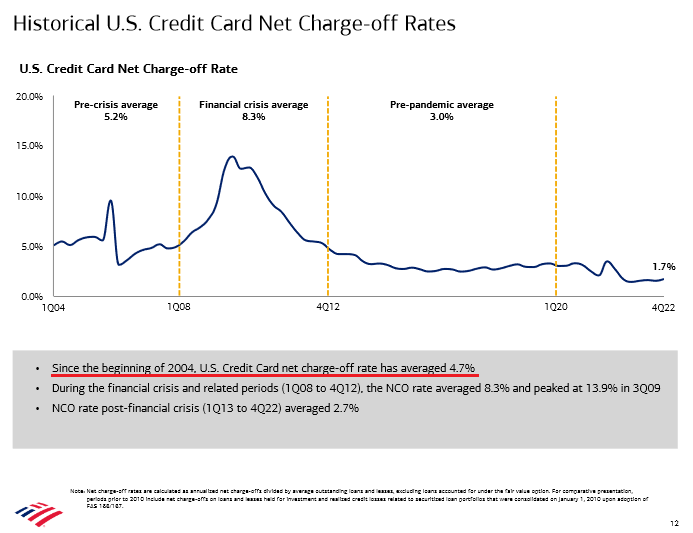
As further evidence, the average credit card interest rate hit a nearly 30-year high of 19.07% in November. Yet, credit card charge-offs are still materially below their 4.7% average since 2004.
Please see below:
To explain, the blue line on the right side of the chart above shows that the current credit card charge-off rate is 1.7%, which is nowhere near the GFC average of 8.3%, and is also below the pre-pandemic average of 3%.
As a result, when you combine these metrics with ~40-year high core inflation, a ~50-year low unemployment rate, and record-high household checkable deposits, the 2023 rate cuts priced in by investors contrast fundamental reality.
To that point, with their misguided optimism only pushing asset prices further from their fundamental values, the crowd erodes the Fed’s progress with each bullish celebration.
Please see below:
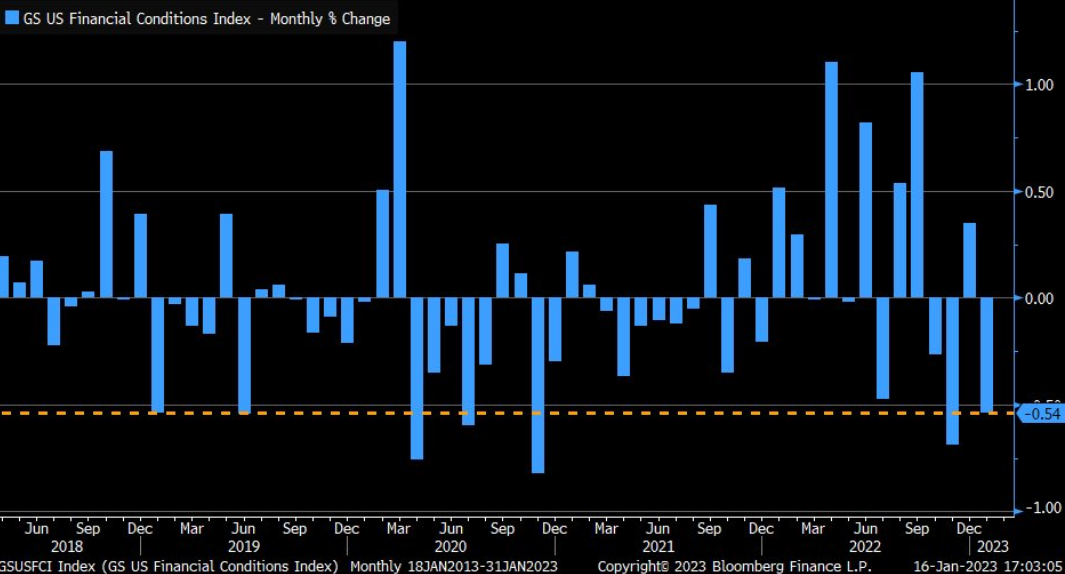
To explain, the blue bars above track the monthly change in the Goldman Sachs Financial Conditions Index (FCI). If you analyze the right side of the chart, you can see that the recent drops were the sharpest since November 2020.
Although, lower interest rates, a weaker U.S. dollar, higher stock prices, and narrower credit spreads only support more inflation; and with the Atlanta Fed’s Sticky CPIs already hitting new highs, the crowd is digging a deeper hole.
Furthermore, with the crude oil price rallying sharply in recent days, it closed above $80 on Jan. 17. So, the sharp month-over-month (MoM) drop in energy prices that hurt the headline CPI in December could reverse in January if the momentum continues.
Please see below:
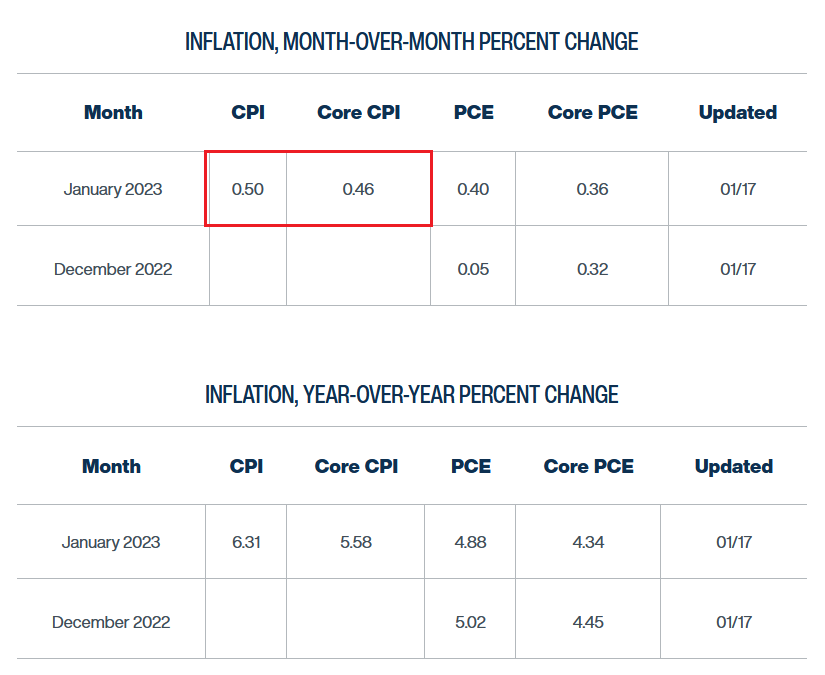
To explain, the Cleveland Fed expects the headline and core CPIs to increase by 0.50% and 0.48% MoM, respectively, in January; and if the predictions prove prescient, these annualize to 6.2% and 5.9% YoY. Therefore, the inflation battle is far from over in our view, and investors have not priced in the ramifications.
Overall, risk assets look shaky, as bearish S&P 500 seasonality has arrived. Moreover, with sentiment indicators near their 2022 peaks, the risk-reward is highly unattractive. As such, we see storm clouds from short and medium-term perspectives.
What’s your opinion of the economic outlook? Is the U.S. economy stronger than the consensus thinks, or is a 2023 pivot inevitable? How soon will inflation dissipate?
The Bottom Line
While sentiment and short-covering helped propel the S&P 500 higher, the fundamentals continue to head in the opposite direction. With a resilient U.S. economy poised to uplift the FFR, consumer strength is bearish, not bullish. Furthermore, the longer they thrive and the stronger the labor market, the more wage and output inflation should persist. Consequently, the pivot crowd underestimates the hawkish developments that should unfold in the months ahead.
In conclusion, the PMs declined on Jan. 17, and mining stocks were noticeable underperformers. Conversely, the USD Index and the U.S. 10-Year real yield rallied, and we expect them to surpass their 2022 highs before this bear market ends. As a result, the medium-term outlooks for gold, silver and mining stocks remain profoundly bearish.
Overview of the Upcoming Part of the Decline
- It seems to me that the corrective upswing is over (or about to be over) and that the next big move lower is already underway (or that it’s about to start).
- If we see a situation where miners slide in a meaningful and volatile way while silver doesn’t (it just declines moderately), I plan to – once again – switch from short positions in miners to short positions in silver. At this time, it’s too early to say at what price levels this could take place and if we get this kind of opportunity at all – perhaps with gold prices close to $1,500 - $1,550.
- I plan to switch from the short positions in junior mining stocks or silver (whichever I’ll have at that moment) to long positions in junior mining stocks when gold / mining stocks move to their 2020 lows (approximately). While I’m probably not going to write about it at this stage yet, this is when some investors might consider getting back in with their long-term investing capital (or perhaps 1/3 or 1/2 thereof).
- I plan to return to short positions in junior mining stocks after a rebound – and the rebound could take gold from about $1,450 to about $1,550, and it could take the GDXJ from about $20 to about $24. In other words, I’m currently planning to go long when GDXJ is close to $20 (which might take place when gold is close to $1,450), and I’m planning to exit this long position and re-enter the short position once we see a corrective rally to $24 in the GDXJ (which might take place when gold is close to $1,550).
- I plan to exit all remaining short positions once gold shows substantial strength relative to the USD Index while the latter is still rallying. This may be the case with gold prices close to $1,400 and GDXJ close to $15 . This moment (when gold performs very strongly against the rallying USD and miners are strong relative to gold after its substantial decline) is likely to be the best entry point for long-term investments, in my view. This can also happen with gold close to $1,400, but at the moment it’s too early to say with certainty.
- The above is based on the information available today, and it might change in the following days/weeks.
You will find my general overview of the outlook for gold on the chart below:
Please note that the above timing details are relatively broad and “for general overview only” – so that you know more or less what I think and how volatile I think the moves are likely to be – on an approximate basis. These time targets are not binding nor clear enough for me to think that they should be used for purchasing options, warrants, or similar instruments.
Letters to the Editor
We received a few messages over e-mail, but as we are moving to our new Golden Meadow platform, we will be transferring them below the articles as comments – and that’s where we’ll be replying to them.
On the platform, please ask your questions below the articles or in the spaces called “Ask the Community” or “Position Sizes” directly – it will help us deliver a reply sooner. In some cases, someone from the community might reply and help even before we do.
Please remember about the Pillars of our Community, especially about the Kindness of Speech Pillar.
Also, if there’s anything that you’re unhappy with, it’s best to send us a message at [email protected].
Please note that this section is going to go away within the next 1-8 weeks, as you can add comments/questions below the article on Golden Meadow – the platform that we’re using to provide our analyses. Your notification e-mails include an invitation link that allows you to access the “Gold Trading Alerts” space.
Also, if you haven’t had the chance to see the video, in which I’m talking about the new platform and why we essentially moved from Sunshine Profits to Golden Meadow, I strongly encourage you to do so:
Summary
Summing up, it seems that the major bottom in the USD Index is in, while the correction in stocks, gold, silver, and mining stocks is over or very close to being over.
The nature of the recent corrections was mostly technical and rumor-based. The rumor was that the Fed would be making a dovish U-turn soon, and it recently became clear that this was not going to be the case. Consequently, the corrective upswing is likely to be reversed, and medium-term downtrends are likely to resume.
In my opinion, the current trading position is going to become profitable in the following weeks, and quite possibly in the following days. And while I can’t promise any kind of performance, I fully expect it to become very profitable before it’s over and to prolong our 2022 winning streak.
After the final sell-off (that takes gold to about $1,350-$1,500), I expect the precious metals to rally significantly. The final part of the decline might take as little as 1-5 weeks, so it's important to stay alert to any changes.
As always, we'll keep you – our subscribers – informed.
To summarize:
Trading capital (supplementary part of the portfolio; our opinion): Full speculative short positions (300% of the full position) in junior mining stocks are justified from the risk to reward point of view with the following binding exit profit-take price levels:
Mining stocks (price levels for the GDXJ ETF): binding profit-take exit price: $20.32; stop-loss: none (the volatility is too big to justify a stop-loss order in case of this particular trade)
Alternatively, if one seeks leverage, we’re providing the binding profit-take levels for the JDST (2x leveraged). The binding profit-take level for the JDST: $22.87; stop-loss for the JDST: none (the volatility is too big to justify a SL order in case of this particular trade).
For-your-information targets (our opinion; we continue to think that mining stocks are the preferred way of taking advantage of the upcoming price move, but if for whatever reason one wants / has to use silver or gold for this trade, we are providing the details anyway.):
Silver futures downside profit-take exit price: $14.32
SLV profit-take exit price: $13.42
ZSL profit-take exit price: $48.87
Gold futures downside profit-take exit price: $1,504
HGD.TO – alternative (Canadian) 2x inverse leveraged gold stocks ETF – the upside profit-take exit price: $16.47
HZD.TO – alternative (Canadian) 2x inverse leveraged silver ETF – the upside profit-take exit price: $36.87
Long-term capital (core part of the portfolio; our opinion): No positions (in other words: cash)
Insurance capital (core part of the portfolio; our opinion): Full position
Whether you’ve already subscribed or not, we encourage you to find out how to make the most of our alerts and read our replies to the most common alert-and-gold-trading-related-questions.
Please note that we describe the situation for the day that the alert is posted in the trading section. In other words, if we are writing about a speculative position, it means that it is up-to-date on the day it was posted. We are also featuring the initial target prices to decide whether keeping a position on a given day is in tune with your approach (some moves are too small for medium-term traders, and some might appear too big for day-traders).
Additionally, you might want to read why our stop-loss orders are usually relatively far from the current price.
Please note that a full position doesn't mean using all of the capital for a given trade. You will find details on our thoughts on gold portfolio structuring in the Key Insights section on our website.
As a reminder - "initial target price" means exactly that - an "initial" one. It's not a price level at which we suggest closing positions. If this becomes the case (as it did in the previous trade), we will refer to these levels as levels of exit orders (exactly as we've done previously). Stop-loss levels, however, are naturally not "initial", but something that, in our opinion, might be entered as an order.
Since it is impossible to synchronize target prices and stop-loss levels for all the ETFs and ETNs with the main markets that we provide these levels for (gold, silver and mining stocks - the GDX ETF), the stop-loss levels and target prices for other ETNs and ETF (among other: UGL, GLL, AGQ, ZSL, NUGT, DUST, JNUG, JDST) are provided as supplementary, and not as "final". This means that if a stop-loss or a target level is reached for any of the "additional instruments" (GLL for instance), but not for the "main instrument" (gold in this case), we will view positions in both gold and GLL as still open and the stop-loss for GLL would have to be moved lower. On the other hand, if gold moves to a stop-loss level but GLL doesn't, then we will view both positions (in gold and GLL) as closed. In other words, since it's not possible to be 100% certain that each related instrument moves to a given level when the underlying instrument does, we can't provide levels that would be binding. The levels that we do provide are our best estimate of the levels that will correspond to the levels in the underlying assets, but it will be the underlying assets that one will need to focus on regarding the signs pointing to closing a given position or keeping it open. We might adjust the levels in the "additional instruments" without adjusting the levels in the "main instruments", which will simply mean that we have improved our estimation of these levels, not that we changed our outlook on the markets. We are already working on a tool that would update these levels daily for the most popular ETFs, ETNs and individual mining stocks.
Our preferred ways to invest in and to trade gold along with the reasoning can be found in the how to buy gold section. Furthermore, our preferred ETFs and ETNs can be found in our Gold & Silver ETF Ranking.
As a reminder, Gold & Silver Trading Alerts are posted before or on each trading day (we usually post them before the opening bell, but we don't promise doing that each day). If there's anything urgent, we will send you an additional small alert before posting the main one.
Thank you.
Przemyslaw K. Radomski, CFA
Founder, Editor-in-chief


