Briefly: in our opinion, full (300% of the regular position size) speculative short positions in mining stocks are justified from the risk/reward point of view at the moment of publishing this Alert.
This week has been calm so far for the precious metals investors. Let’s keep in mind that this is likely the calm before the storm; at least that’s what the HUI Index’s performance relative to gold in the previous week indicated. As a reminder, the HUI Index (the flagship proxy for gold stocks) was down while gold was up by almost $30, which is an extreme underperformance, as well as a clear sell sign.
And what has happened to date has done nothing to invalidate this critical bearish sign.
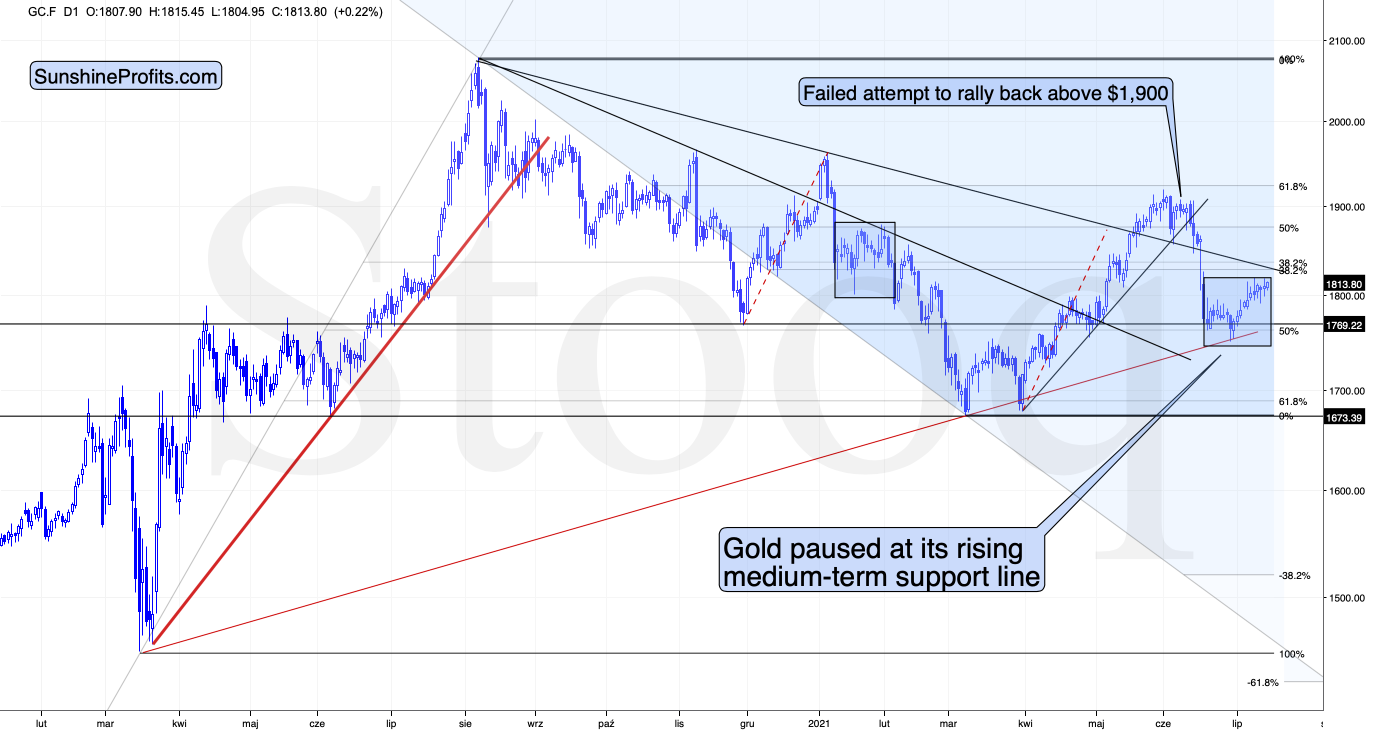
Gold is moving back and forth, climbing slightly higher in the process, but no intraday rally seems to be a game-changer. Gold is consolidating after a very sharp drop, just as it did in January and February 2021. And just as more big declines followed then, the same is likely now; especially when we factor in miners’ performance.
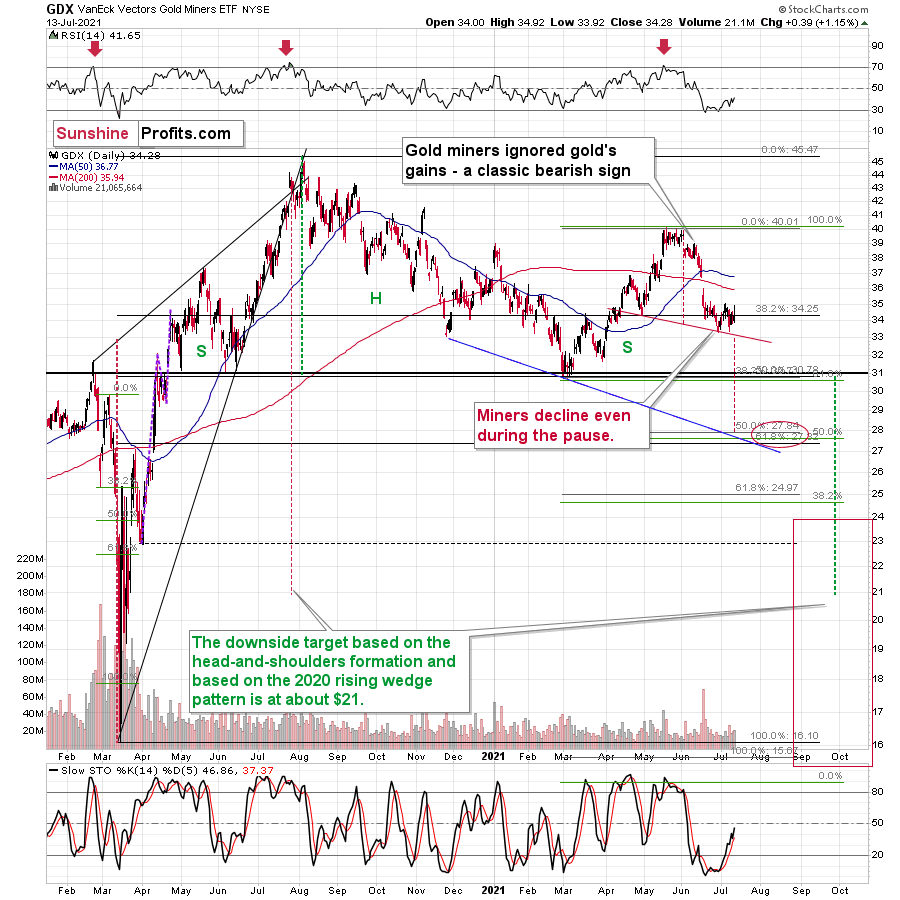
The GDX ETF did close a bit higher yesterday, but it reversed before the end of the session and erased most of the daily gains. This means that we saw a bearish shooting star candlestick pattern. The volume was not high, so the implications are not clearly bearish (based on the candlestick alone, that is), but they are definitely more bearish than bullish.
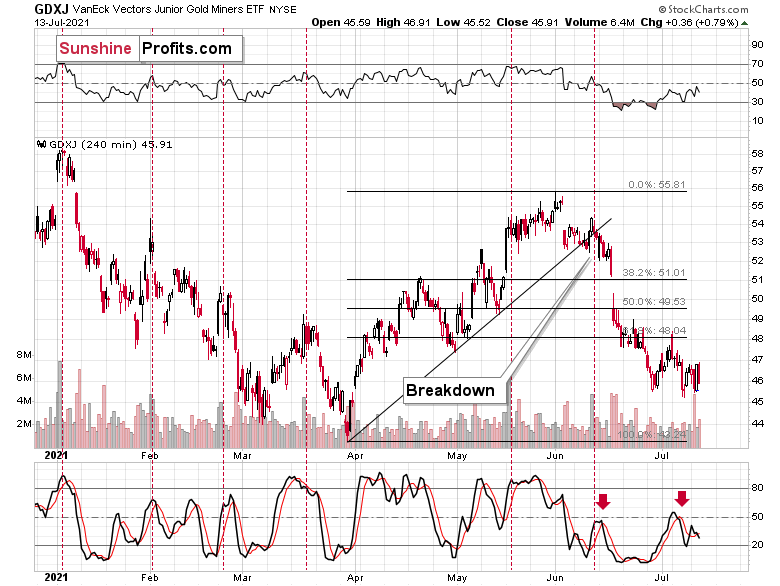
As many times before, the GDXJ – a proxy for junior, gold and silver miners – underperformed the GDX, declining a bit more.
So far this week (based on the closing prices), the GLD is up by 0.01%, the GDX is down by 0.26% and the GDXJ is down by 1.52%.
So, indeed, the junior miners seem to be the best proxy for shorting the precious metals market at this time.
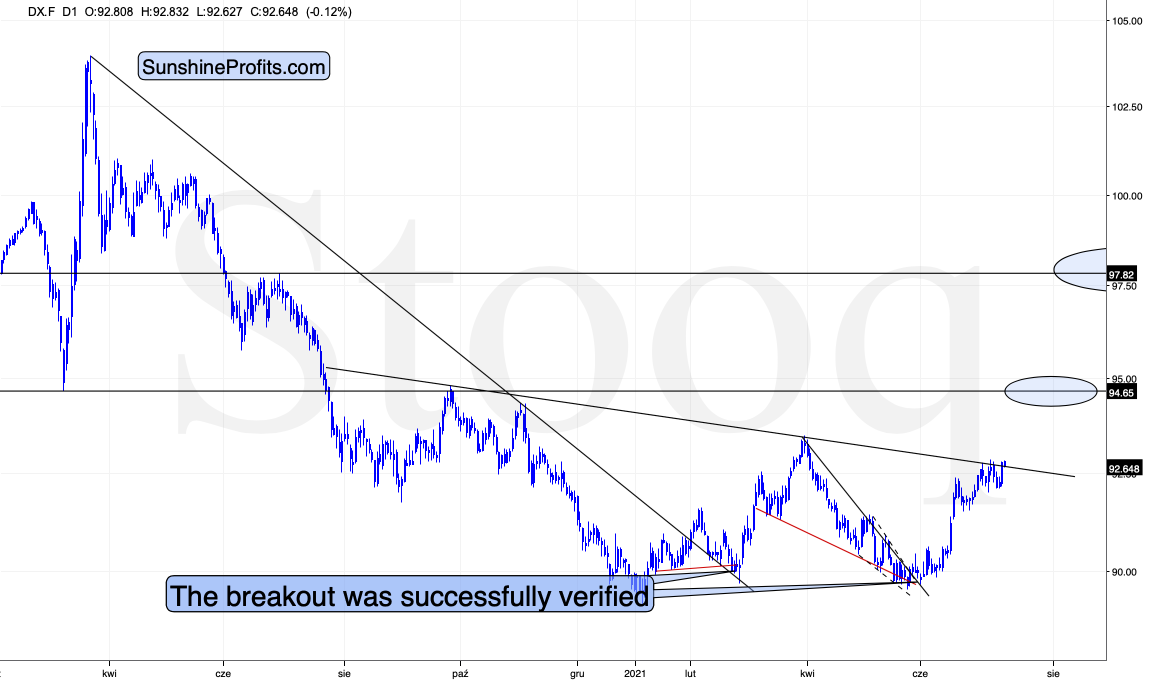
Let’s not forget that while things may seem calm now, they might change very soon and very fast. The situation in the USD Index shows that the storm is already brewing.
The U.S. currency is on the verge of breaking above the neck level of a medium-term inverse head-and-shoulders pattern. Once it breaks above it, it will likely rally to about 98 without looking back. When that happens, it’s very probable that it will trigger big declines in the precious metals sector –and this breakout in the USDX seems to be just around the corner.
Having said that, let’s take a look at the markets from a more fundamental angle.
Running Out of Excuses
With investors’ attention span rivaling that of a young child, the inflationary carousel has gone from hot to cold and to hot once again. For example, after short-covering, the Delta variant and the FED’s hawkish shift dropped the guillotine on the U.S. 10-Year Treasury yield, the long-term benchmark languished in defeat. However, with inflation’s reincarnation once again shifting the narrative, I warned on Jul. 9 that investors are still underestimating the inflationary fervor.
I wrote:
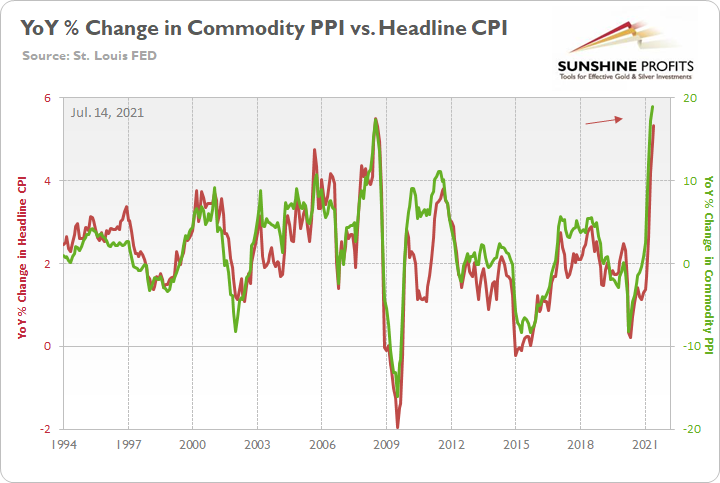
With the Consumer Price Index (CPI) scheduled for release on Jul. 13, another dose of reality could be forthcoming. Case in point: with the Commodity Producer Price Index (PPI) surging by 18.98% year-over-year (YoY) in May – the highest YoY percentage increase since 1974 – the print implies a roughly 5% to 5.5% YoY increase in the headline CPI. To explain, when the commodity PPI increased by 17.4% YoY in July 2008, the headline CPI rose by 5.3% in August. Thus, with the commodity PPI surging by 18.98% in May, all signs point to another ‘surprising’ headline CPI print for June.
To that point, with the headline CPI surging by 5.32% YoY on Jul. 13 (vs. 4.90% expected), the “transitory” narrative suffered another body blow. For context, all inflation is transitory. However, there is a profound difference between three months of transitory inflation and 12 months of transitory inflation.
Please see below:
To explain, the green line above tracks the YoY percentage change in the commodity PPI, while the red line above tracks the YoY percentage change in the headline CPI. If you analyze the relationship, you can see that the pair have a close connection.
Likewise, while investors comb through the print and search for aberrations that support their outlook, they’re missing the most important link. For example, with the Used Cars and Trucks CPI surging by 45.2% YoY in June, disbelievers suggest that once the outlier recedes, it will quell the inflationary momentum. For context, I’ve been warning since April that the Manheim Used Vehicle Index signaled a profound jump in the Used Cars and Trucks CPI.
Despite that, while investors lament the obvious (of course the Used Cars and Trucks CPI will decelerate in the coming months), the commodity PPI is still the most important indicator of where the inflation story is headed next.
Please see below:
To explain, the scatterplot above depicts the relationship between the headline CPI and the commodity PPI (since 1994). For context, the headline CPI is plotted on the vertical axis, while the commodity PPI is plotted on the horizontal axis. If you analyze their movement, you can see that the pair have a strong linear relationship (correlation). Moreover, if you focus your attention on the right side of the chart, you can see that the commodity PPI has only risen by 15% YoY or more (for a month) five times since 1994. On top of that, if you follow the red arrow, you can see that the PPI/CPI relationship remains on trend. The bottom line? If the commodity PPI (which is scheduled for release today) remains hot, then expect the headline CPI to follow suit.
The Economy Growing… Too Much?
Furthermore, while the Used Cars and Trucks CPI is poised to slow over the medium term, I warned on Jun. 3 that rent inflation could easily take its place. For context, the Shelter CPI accounts for more than 30% of the movement of the headline CPI. And with The Federal National Mortgage Association (Fannie Mae) projecting that the Shelter CPI will increase from “2.0%annualized to about 4.5%” and “last through at least 2022,” the “‘transitory’ increases to the rate of overall inflation may be more prolonged than many are expecting.”
Please see below:
Likewise, with inflation surging and the U.S. Federal Reserve (FED) pouring gasoline on the fire, St. Louis FED President James Bullard told the Wall Street Journal (WSJ) on Jul. 12 (released on Jul. 13) that “I am a little bit concerned that we’re feeding into an incipient housing bubble ... [and] I think we don’t need to be doing that with the economy growing at 7%.”
Please see below:
In addition, Conagra Brands CEO Sean Connolly also warned on Jul. 13 that “this is an atypical level of inflation [and] it’s the highest inflation level our company has seen in as many years as we can remember.” For context, Conagra Brands is an American food manufacturer and is home to well-known brands such as Marie Callender’s, Healthy Choice and Slim Jim.
Please see below:
If that wasn’t enough, JPMorgan CEO Jamie Dimon was asked during the company’s Q2 earnings call on Jul. 13 about how the current recovery compares to the recovery following the global financial crisis (GFC). He responded:
“I think they're completely different fundamentally…. The consumer, their house value is up, their stock rises up, their incomes are up, their savings are up, their confidence are up. The pandemic is kind of in the rearview mirror. Hopefully, nothing gets worse with it. And they're ready to go.”
He added:
“Jobs are plentiful, wages are going up. These are all good things. And so, obviously, if the inflation can be worse than people think, I think it will be a little bit worse with these kinds of things. I don't think it's all temporary, but that doesn't matter if we have very strong growth.”
Even more revealing, while Dimon said that he’s “not predicting” that the U.S. 10-Year Treasury yield “goes to 3%,” he mentioned that “you may have growth in the second half this year [that’s] stronger than it's ever been in the United States of America.” Furthermore, CFO Jeremy Barnum said that the largest bank in the U.S. is putting its money where its mouth is and that’s why the cash on its balance sheet has not been invested in U.S. Treasuries.
Please see below:
 Source: JPMorgan/Seeking Alpha
Finally, with the Chicago FED releasing its Survey of Business Conditions (CFSBC) on Jul. 13, its labor cost index is now at an all-time high and its non-labor cost index remains materially elevated. Thus, the FED is running out of excuses for not scaling back its bond-buying program.
In conclusion, the PMs continue to hope for a bullish catalyst, but the news hitting the market is clouding their outlook. While conventional wisdom suggests that surging inflation is bullish for the gold, silver, and mining stocks, the cocktail of higher U.S. Treasury yields and a hawkish FED more than offsets the optimistic long-term argument. As a result, while the PMs may generate short-term bursts of strength, and their very long-term outlook remains favorable, their medium-term outlook is extremely ominous. With the USD Index gunning for 93, and surging inflation likely to force the FED’s hand, a September taper is unlikely to elicit a positive response from the metals.
Overview of the Upcoming Part of the Decline
- The barely visible corrective upswing in gold might already be over, and another huge decline is likely just around the corner.
- After miners slide in a meaningful and volatile way, but silver doesn’t (and it just declines moderately), I plan to switch from short positions in miners to short positions in silver. At this time, it’s too early to say at what price levels this would take place – perhaps with gold close to $1,600. I plan to exit those short positions when gold shows substantial strength relative to the USD Index, while the latter is still rallying. This might take place with gold close to $1,350 - $1,500 and the entire decline (from above $1,900 to about $1,475) would be likely to take place within 6-20 weeks, and I would expect silver to fall the hardest in the final part of the move. This moment (when gold performs very strongly against the rallying USD and miners are strong relative to gold – after gold has already declined substantially) is likely to be the best entry point for long-term investments, in my view. This might also happen with gold close to $1,475, but it’s too early to say with certainty at this time.
- As a confirmation for the above, I will use the (upcoming or perhaps we have already seen it?) top in the general stock market as the starting point for the three-month countdown. The reason is that after the 1929 top, gold miners declined for about three months after the general stock market started to slide. We also saw some confirmations of this theory based on the analogy to 2008. All in all, the precious metals sector would be likely to bottom about three months after the general stock market tops.
- The above is based on the information available today, and it might change in the following days/weeks.
Please note that the above timing details are relatively broad and “for general overview only” – so that you know more or less what I think and how volatile I think the moves are likely to be – on an approximate basis. These time targets are not binding or clear enough for me to think that they should be used for purchasing options, warrants or similar instruments.
Summary
To summarize, even though gold could still move somewhat higher in the near term, it seems that having a short position in the junior mining stocks is much more justified from the risk-to-reward point of view than having a long one in any part of the precious metals market. Gold miners’ underperformance along with a self-similar pattern in the USD Index (pointing to the breather being over) and the length of the “bottoming” process in gold that no longer resembles a bottom (but rather a pause within a slide) all make the bearish outlook justified from the risk-to-reward point of view.
Due to the increased clarity regarding the likely next interim bottom in gold (previous 2021 lows) and mining stocks (below their previous 2021 lows), the profit-take levels on our current short position are not pointing to the final bottom, but to the likely interim one. This does not imply that the entire decline is going to be smaller than first believed. It’s simply a consequence of the short-term target becoming more crystallized.
After the sell-off (that takes gold to about $1,350 - $1,500), I expect the precious metals to rally significantly. The final part of the decline might take as little as 1-5 weeks, so it's important to stay alert to any changes.
Most importantly, please stay healthy and safe. We made a lot of money last March and this March, and it seems that we’re about to make much more on the upcoming decline, but you have to be healthy to enjoy the results.
As always, we'll keep you - our subscribers - informed.
By the way, we’re currently providing you with a possibility to extend your subscription by a year, two years or even three years with a special 20% discount. This discount can be applied right away, without the need to wait for your next renewal – if you choose to secure your premium access and complete the payment upfront. The boring time in the PMs is definitely over and the time to pay close attention to the market is here. Naturally, it’s your capital, and the choice is up to you, but it seems that it might be a good idea to secure more premium access now, while saving 20% at the same time. Our support team will be happy to assist you in the above-described upgrade at preferential terms – if you’d like to proceed, please contact us.
To summarize:
Trading capital (supplementary part of the portfolio; our opinion): Full speculative short positions (300% of the full position) in mining stocks are justified from the risk to reward point of view with the following binding exit profit-take price levels:
Mining stocks (price levels for the GDXJ ETF): binding profit-take exit price: $37.12; stop-loss: none (the volatility is too big to justify a stop-loss order in case of this particular trade)
Alternatively, if one seeks leverage, we’re providing the binding profit-take levels for the JDST (2x leveraged) and GDXD (3x leveraged – which is not suggested for most traders/investors due to the significant leverage). The binding profit-take level for the JDST: $15.96; stop-loss for the JDST: none (the volatility is too big to justify a SL order in case of this particular trade); binding profit-take level for the GDXD: $37.02; stop-loss for the GDXD: none (the volatility is too big to justify a SL order in case of this particular trade).
For-your-information targets (our opinion; we continue to think that mining stocks are the preferred way of taking advantage of the upcoming price move, but if for whatever reason one wants / has to use silver or gold for this trade, we are providing the details anyway.):
Silver futures upside profit-take exit price: unclear at this time - initially, it might be a good idea to exit, when gold moves to $1,683
Gold futures upside profit-take exit price: $1,683
HGD.TO – alternative (Canadian) inverse 2x leveraged gold stocks ETF – the upside profit-take exit price: $12.88
Long-term capital (core part of the portfolio; our opinion): No positions (in other words: cash
Insurance capital (core part of the portfolio; our opinion): Full position
Whether you already subscribed or not, we encourage you to find out how to make the most of our alerts and read our replies to the most common alert-and-gold-trading-related-questions.
Please note that we describe the situation for the day that the alert is posted in the trading section. In other words, if we are writing about a speculative position, it means that it is up-to-date on the day it was posted. We are also featuring the initial target prices to decide whether keeping a position on a given day is in tune with your approach (some moves are too small for medium-term traders, and some might appear too big for day-traders).
Additionally, you might want to read why our stop-loss orders are usually relatively far from the current price.
Please note that a full position doesn't mean using all of the capital for a given trade. You will find details on our thoughts on gold portfolio structuring in the Key Insights section on our website.
As a reminder - "initial target price" means exactly that - an "initial" one. It's not a price level at which we suggest closing positions. If this becomes the case (like it did in the previous trade), we will refer to these levels as levels of exit orders (exactly as we've done previously). Stop-loss levels, however, are naturally not "initial", but something that, in our opinion, might be entered as an order.
Since it is impossible to synchronize target prices and stop-loss levels for all the ETFs and ETNs with the main markets that we provide these levels for (gold, silver and mining stocks - the GDX ETF), the stop-loss levels and target prices for other ETNs and ETF (among other: UGL, GLL, AGQ, ZSL, NUGT, DUST, JNUG, JDST) are provided as supplementary, and not as "final". This means that if a stop-loss or a target level is reached for any of the "additional instruments" (GLL for instance), but not for the "main instrument" (gold in this case), we will view positions in both gold and GLL as still open and the stop-loss for GLL would have to be moved lower. On the other hand, if gold moves to a stop-loss level but GLL doesn't, then we will view both positions (in gold and GLL) as closed. In other words, since it's not possible to be 100% certain that each related instrument moves to a given level when the underlying instrument does, we can't provide levels that would be binding. The levels that we do provide are our best estimate of the levels that will correspond to the levels in the underlying assets, but it will be the underlying assets that one will need to focus on regarding the signs pointing to closing a given position or keeping it open. We might adjust the levels in the "additional instruments" without adjusting the levels in the "main instruments", which will simply mean that we have improved our estimation of these levels, not that we changed our outlook on the markets. We are already working on a tool that would update these levels daily for the most popular ETFs, ETNs and individual mining stocks.
Our preferred ways to invest in and to trade gold along with the reasoning can be found in the how to buy gold section. Furthermore, our preferred ETFs and ETNs can be found in our Gold & Silver ETF Ranking.
As a reminder, Gold & Silver Trading Alerts are posted before or on each trading day (we usually post them before the opening bell, but we don't promise doing that each day). If there's anything urgent, we will send you an additional small alert before posting the main one.
Thank you.
Przemyslaw Radomski, CFA
Founder, Editor-in-chief


