

Briefly: in our opinion, full (300% of the regular position size) speculative short positions in junior mining stocks are justified from the risk/reward point of view at the moment of publishing this Alert. We’re adjusting the targets for the leveraged ETFs (based on the recent correction and the way these leveraged ETFs work, we are moving them lower). Additionally, we’re moving the target for silver higher, based on its recent rally. Please note that the targets in the “trading” part of the capital ARE NOT the same as the final targets for this medium-term decline, as we expect to see a rebound and then another move lower to the final lows.
Something major happened to the USD/JPY (yen), and it triggered a sizable overnight rally in gold and silver. What’s really going on?
Junior miners declined yesterday, and they moved to a new monthly low. However, I bet that you are now most interested in what happened in today’s pre-market trading, why it happened, and what it implies.
Gold moved higher, as did silver (chart courtesy of https://goldpriceforecast.com).
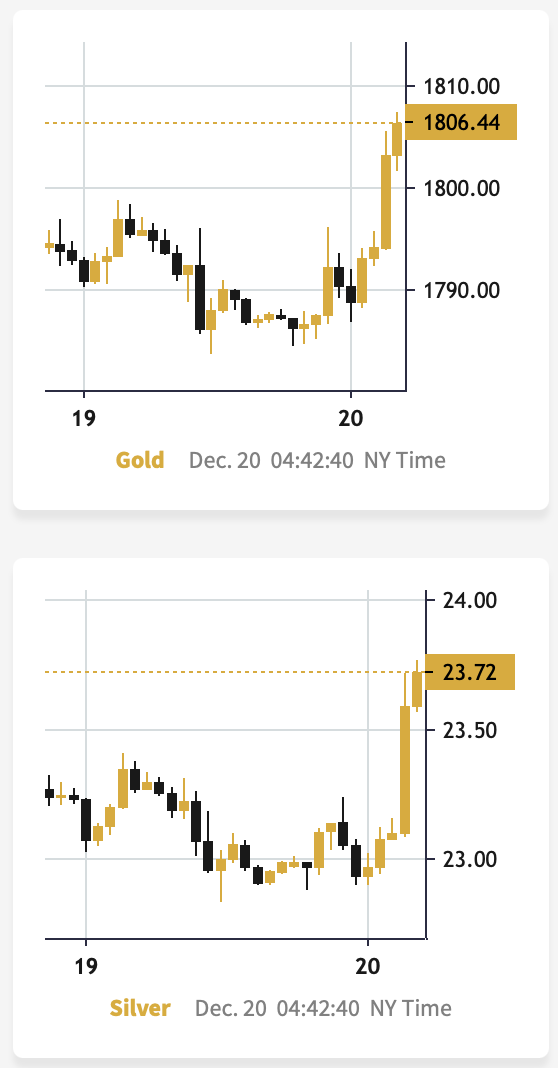
At the same time, the USD Index declined.
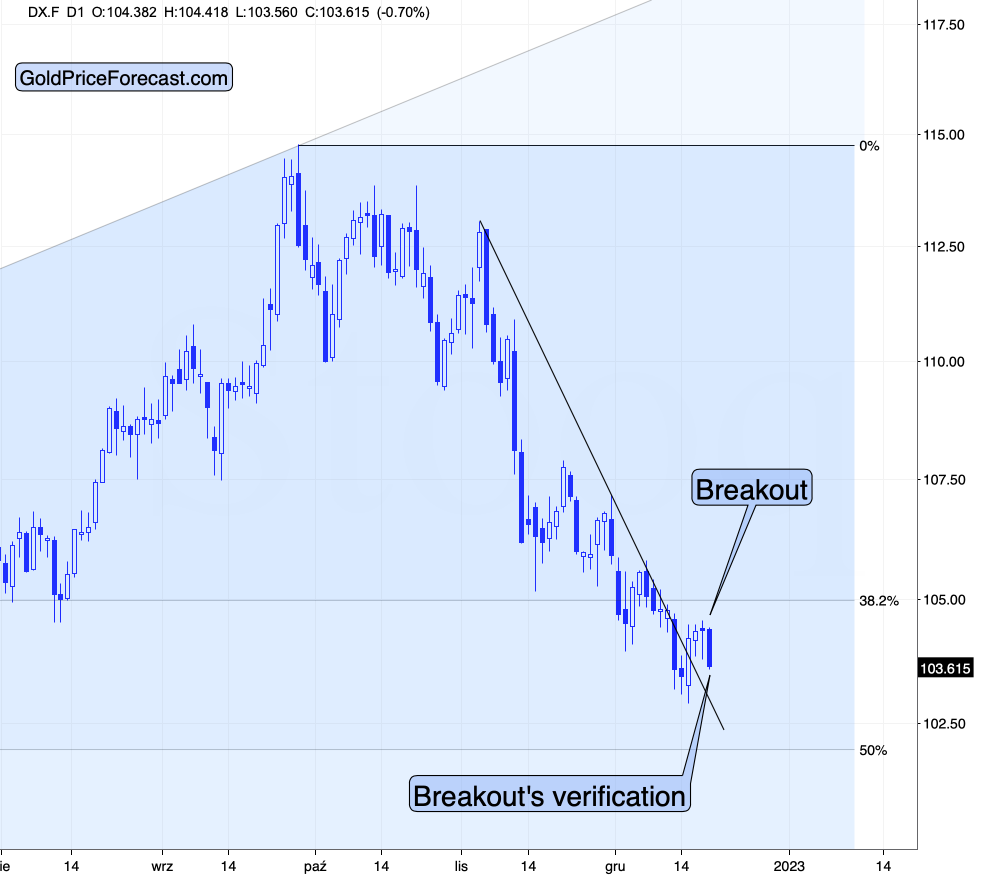
Looking at the above chart, we can see that these quick price movements are fairly normal, as most breakouts/breakdowns are followed by a correction - a confirmation of the breakout/breakdown. Consequently, the fact that we’re seeing it in the USD Index is currently quite normal. After all, it just broke above its declining resistance line a couple of days ago.
And since the precious metals sector is very strongly negatively correlated with the USD Index, the above means that today’s quick move higher in gold and silver is likely to end soon as well, and the “real” (= medium-term) move is likely to resume. In the case of the precious metals sector, this trend is down.
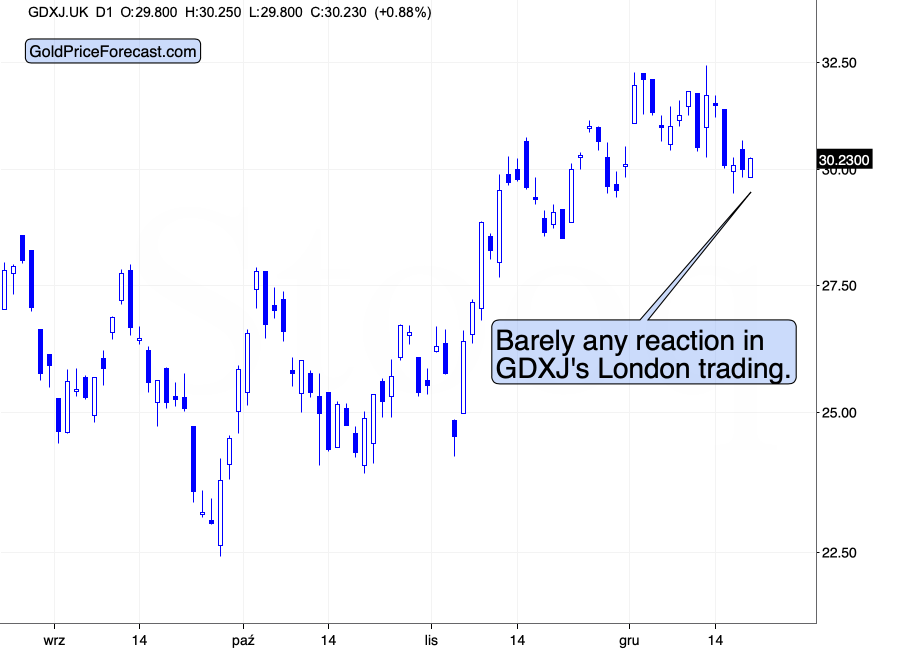
You know, one of the things that can tell us what’s real and what’s fake on the precious metals market is the performance of mining stocks. At the moment of writing these words, the markets are still closed in the U.S., so let’s take a look at what the GDXJ (a proxy for junior mining stocks) is doing in today’s London trading so far.
And there’s the thing.
It’s not doing anything (crude oil is more or less silent, too).
Ok, to be precise, the GDXJ did move a bit higher, but it’s a move higher by less than 1%, and it’s barely visible given the sizes of the recent price swings.
This further strengthens the above-mentioned scenario, in which the precious metals sector is simply verifying its breakdown yesterday.
But Why?
As always, it’s impossible to tell with 100% confidence what made a given market move, but today it seems clearer than on most days.
The Bank of Japan hinted at a hawkish twist in their approach, and the markets reacted, assuming that it was a major shift.
The currency moves that we have seen so far today appear to confirm that this is what the markets are focusing on right now (chart courtesy of https://silverpriceforecast.com).
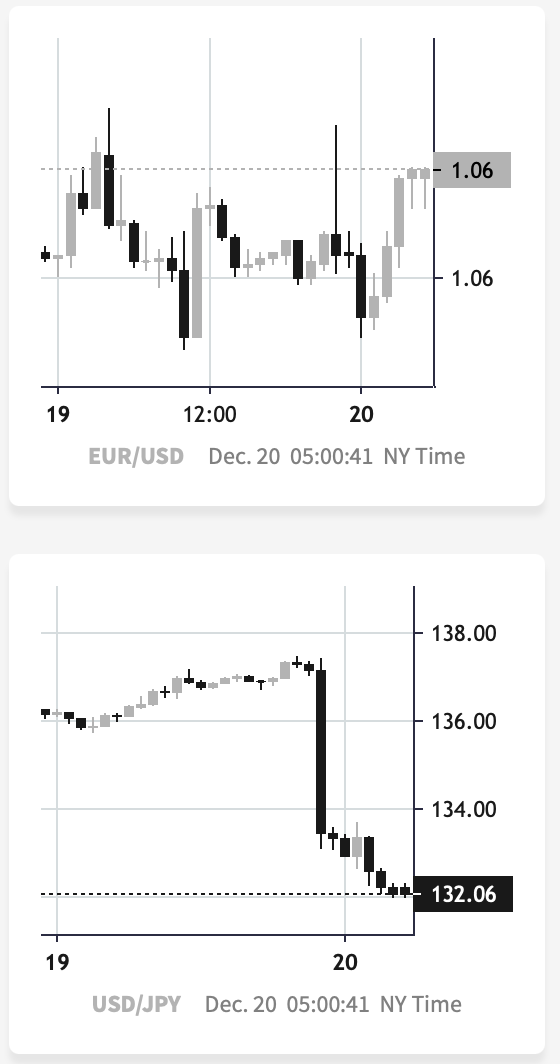
The EUR/USD currency pair is moving sideways, while the USD/JPY pair truly plunged. What does it tell us? It tells us that whatever is happening on the currency market is not about the dollar per se – it’s about the yen.
This is more important than it seems at first glance. If the U.S. dollar’s weakness was the driving force behind the USD Index’s move lower, one could say that it’s really a bearish factor for gold. The USD, being viewed as a safe haven (whether we want to believe it or not, a large part of the world views the U.S. dollar as a safe/solid currency), would be losing appeal, and gold – being another safe haven – would be gaining it as an alternative.
However, it is not about the U.S. dollar’s weakness – it’s about the yen’s strength.
So, what is the real implication for gold?
It’s easier to understand the implication based on a counter-example. Remember when all the monetary authorities around the world were getting more and more dovish and they kept printing more and more money? That was bullish for gold, right?
Ok, so, now what we see is the opposite. The monetary authorities around the world are getting more and more hawkish, and the Bank of Japan appears to be finally joining the hawkish party, and that’s bearish for gold.
This remains true despite any short-term price movements caused by individual currency exchange rate changes. So, even if the yen continues to strengthen relative to the dollar for some time, gold might not be willing to react to it for much longer.
Why? Because in the short-term markets are particularly emotional. “OMG, USDX fell, let’s buy gold!” can dominate traders’ way of feeling/thinking (on a side note, “feenking” could be a new verb to describe the situation when one thinks that they are thinking about something, but actually they are just rationalizing their feelings).
Then, as the traders have some time to think about what’s really happening, they could sell gold as it becomes less and less appealing, given that fiat money can (at least for now…) provide more interest payments.
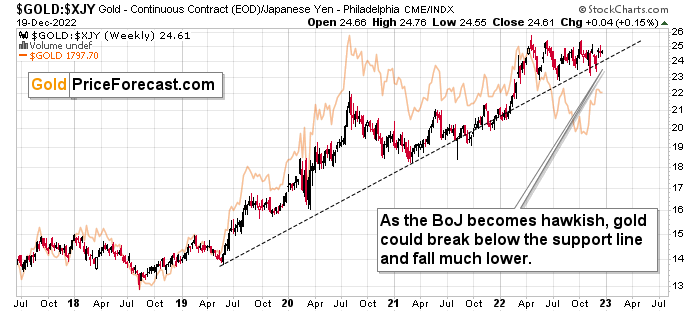
As you can see on the above chart, gold priced in the Japanese yen has been in a rather steady long-term uptrend for years. It’s close to the support line, though.
Based on the hawkish indications from the Bank of Japan, it seems that we might finally see a breakdown below this line, and when we do, the decline that could follow could be huge.
Please note that the price levels were rather steady throughout the year, even though gold fell substantially from a USD point of view. Consequently, it seems that the demand from the yen holders was quite strong, and if it now subsides… Things could get very unpleasant for gold permabulls. Also, for those who think that I’m always writing about lower gold prices, I would like to emphasize that so far this year, I have written about precisely 4 trades in junior mining stocks – two long and two short, and all of them were profitable. One position is still open (in my view, and it has the biggest potential).
Before summarizing, I have great news for you. If you’d like to get a LIVE follow-up on the above analysis (with the possibility to ask me questions) and see me talking about the top 3 gold trading techniques that I found to be working over and over again, then you’ll have a chance to get the above free of charge LIVE on Wednesday, Dec. 21 at 10 AM EST (4 PM CET) on our Youtube, Facebook, Twitter, and LinkedIn channels. If the above is not displayed as a link, just Google “Golden Meadow Radomski” and you’ll definitely find it. I hope to see you very soon :) And the easiest way to sign up is right here.
To summarize, despite today’s pre-market upswing in gold and silver, the outlook for the following weeks doesn’t look bullish at all. Conversely, as monetary authorities around the world get more hawkish, gold, silver, and mining stocks are likely to move lower.
While the presentation about the top 3 trading techniques and some Q&A will take place on social media, there will also be a second part, when I’m going to do the live market analysis. This second part will take place on Golden Meadow. This will be a free (promotional) event to get more people aboard, so there will be some selling during this event. However, the market analysis will also be done. So, it’s up to you, if you’d like to participate.
Also, tomorrow’s analysis will definitely be posted before the live event. Consequently, you will already be informed about my take on the market on that day, and the odds are that everything that you read/see earlier will remain up-to-date while the live event is taking place.
So, this time, I’m not sending “invitations” to the event to all my subscribers, as it seems that it would just be doubling the information that you will already get beforehand, and without the sales texts.
However, if you’d like to participate in any or all of the above, you are – of course – very welcome to do so. I already included links to our social media channels above, and as far as the live market coverage is concerned, it’s going to take place here.
I’m scheduling the second part (live market analysis on Golden Meadow) of the event at 11 AM EST (5 PM CET), and as long as there are no technical problems along the way, I expect this second part of the event to start on time and to take 30-40 minutes. Here’s the link to both events, where you can make your selection.
= = = = =
To summarize, despite today’s pre-market upswing in gold and silver, the outlook for the following weeks doesn’t look bullish at all. Conversely, as monetary authorities around the world are getting more hawkish, gold, silver, and mining stocks are likely to move lower.
Having said that, let’s take a look at the market from a more fundamental point of view.
Gold Falls and the Dollar Stalls: What Gives?
With the gold price remaining firm in the face of a hawkish Fed and rising real interest rates, the yellow metal continues to benefit from the USD Index's recent pullback. Moreover, with the Federal Reserve's swap lines allowing international central banks to access U.S. dollars without having to hit the bid in the open market, concern has arisen that the gambit could depress the greenback's value.
However, while these emergency channels are put in place to avoid a liquidity crisis, please remember that they have an immaterial impact on the USD Index's value.
For example, the Fed established new emergency swap lines on Mar. 19, 2020, during the height of the COVID-19 crisis. The press release read:
“The Federal Reserve on Thursday announced the establishment of temporary U.S. dollar liquidity arrangements (swap lines) with the Reserve Bank of Australia, the Banco Central do Brasil, the Danmarks Nationalbank (Denmark), the Bank of Korea, the Banco de Mexico, the Norges Bank (Norway), the Reserve Bank of New Zealand, the Monetary Authority of Singapore, and the Sveriges Riksbank (Sweden).
“These facilities, like those already established between the Federal Reserve and other central banks, are designed to help lessen strains in global U.S. dollar funding markets.”
Please see below:
 Source: U.S. Fed
But, the market impact of the liquidity arrangements was much more semblance than substance.
Please see below:
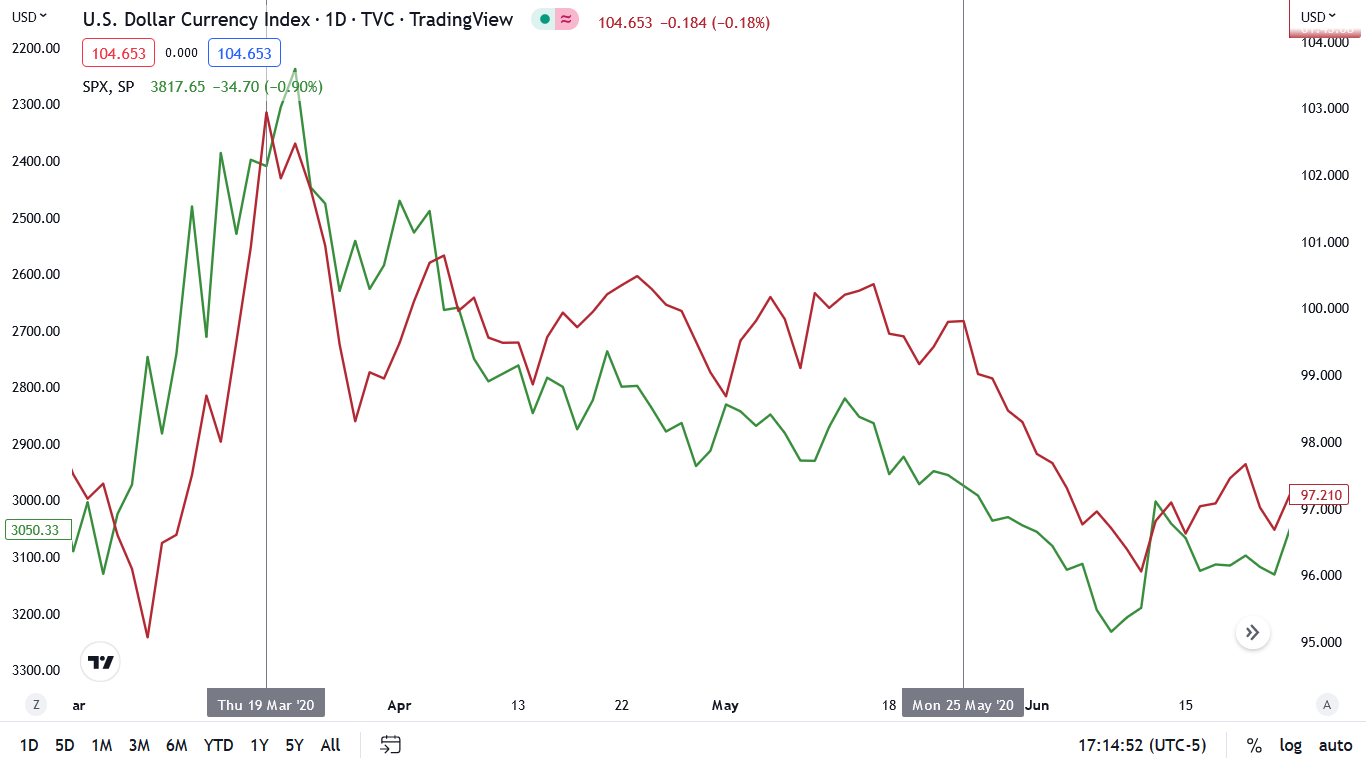
To explain, the red line above tracks the USD Index, while the green line above tracks the inverted (down means up) S&P 500 as the pandemic unfolded in March 2020. Coincidentally, the USD Index peaked on Mar. 19 (closing high), so one could surmise that the swap lines had a profound impact.
Conversely, the important development was that the S&P 500 bottomed on Mar. 23, and the optimism helped uplift risk assets at the expense of the USD Index.
If you analyze the relationship on the left side of the chart, you can see that as the S&P 500 plunged, the USD Index soared. Then, as the S&P 500 began its QE-induced rally (green line falling), the dollar basket declined and eventually sunk below 90 in the months that followed.
Also noteworthy, if you focus your attention on the vertical gray line near the right side of the chart, you can see that the USD Index remained relatively range-bound until May 25. As a result, the Fed’s swap lines didn’t have much impact on the dollar’s performance.
For more insight, it’s important to understand how the financial markets work. For example, if the ECB wants to exchange dollars for euros, a swap line could prevent upward pressure on the dollar. But, the futures market doesn’t follow this script.
While the USD Index is a basket of six currency pairs that each have their own fundamental and technical drivers, when traders buy and sell USD Index futures, the contract is essentially its own instrument.
Therefore, if a market catalyst (hawkish Fed, recession, S&P 500 sell-off, etc.) sparks a bid for USD Index futures, the momentum uplifts the underlying currency pairs. This occurs because arbitragers can earn a risk-free return when the USD Index futures contract trades at a premium/discount to the weighted basket of underlying FX pairs.
In a nutshell: if the front-month USD Index futures contract trades at 110, while a weighted basket of the six currency pairs trades at an index value of 108, arbitragers can buy the six pairs and sell the USD Index futures contract and earn a riskless profit; and when these opportunities occur, arbitragers will repeat the trade until the two baskets converge.
An easier way to think about it is to consider the S&P 500: the index is comprised of 500 companies that also have their own fundamental and technical drivers. In contrast, if the S&P 500 futures contract is down by say 1% at the open, the spot market (daily cash trade) will decline and converge with the futures price because arbitragers will sell an underlying basket of stocks (like the SPY ETF) and buy the futures contract until the risk-free profit is eliminated.
Remember, the arbitrage relationship between the spot and futures markets keeps asset prices in balance. Otherwise, traders could make enormous sums of money with no risk.
The key point is that the futures market will have more impact on the USD Index’s performance than the Fed’s swap lines. If market participants develop a fundamental, technical or momentum case to own the dollar basket, their behavior will overpower other factors.
In addition, please note that a stronger U.S. dollar aids the Fed’s inflation fight. When the greenback rises, it reduces the FX-adjusted cost of foreign imports, which helps decrease domestic output inflation. In contrast, when the greenback falls, it increases the FX-adjusted cost of foreign imports and incentivizes U.S. companies to raise their output prices to protect their profit margins. As such, it’s in the Fed’s best interest to increase the USD Index’s value.
Overall, the gold price continues to outperform the S&P 500, and the USD Index’s recent consolidation has boosted investors’ optimism. However, a major shift in sentiment should occur sooner rather than later. To explain, we wrote on Dec. 19:
The U.S. 10-Year real yield has risen materially in December. Previously, the metric declined from its 2022 peak of 1.74% on Nov. 3 to a low of 1.08% on Dec. 2. Coincidently, the PMs rallied during this period as the USD Index came under pressure. In contrast, the metric ended the Dec. 16 session at 1.35%, which marks a 27 basis point increase in two weeks.
Furthermore, that momentum continued on Dec. 19, as the U.S. 10-Year real yield closed at 1.42%. So, while the S&P 500 has noticed, the PMs are ignoring the ominous development at their own peril.
A Fearless Silver Taunts the Bears
While the S&P 500’s downtrend has intensified, the index’s weakness contrasts investor sentiment. For example, the Cboe Volatility Index (VIX) – which measures the S&P 500’s expected volatility over the next 30 days – declined on Dec. 16, even as a sea of red flooded risk assets.
Likewise, while the S&P 500 declined by another 0.90% on Dec. 19, the VIX retreated by 0.88%, as fear has largely gone extinct across the financial markets. For context, we wrote on Dec. 19:
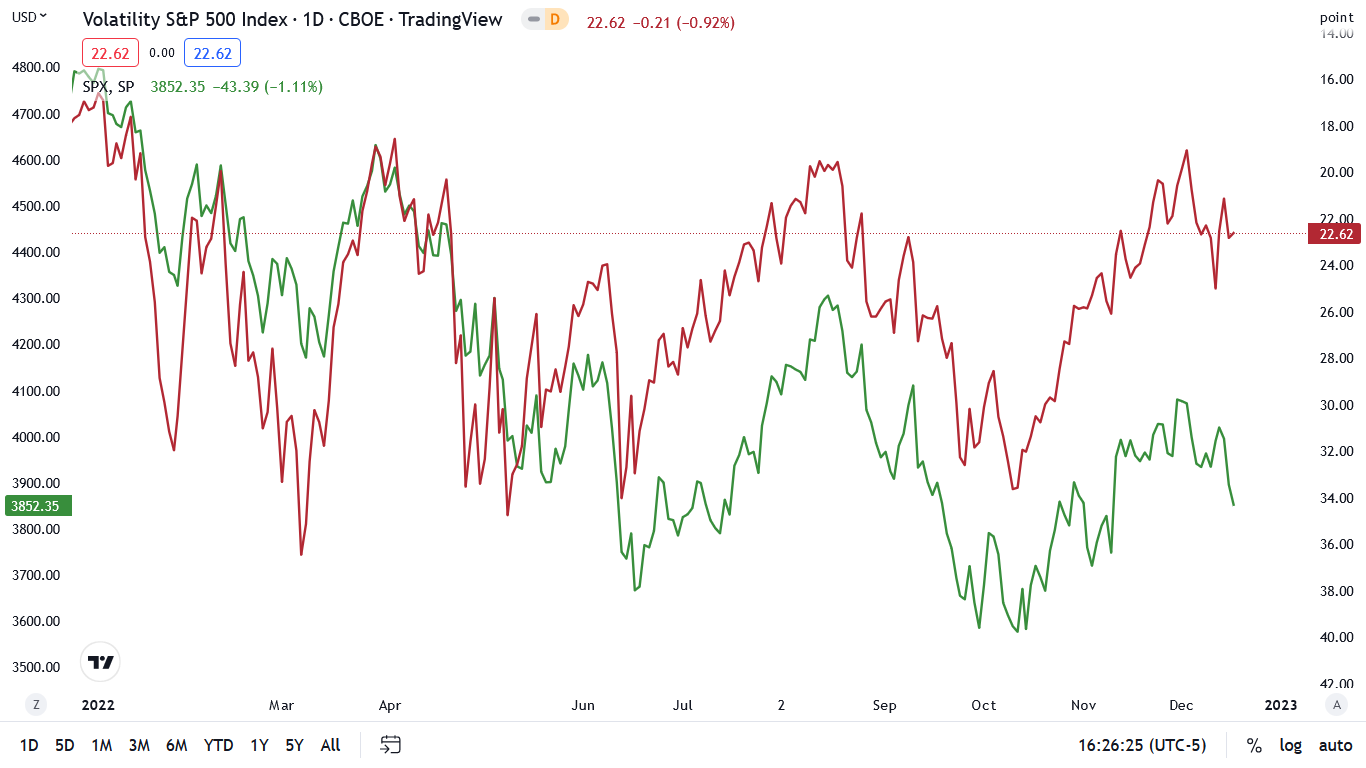
The green line above tracks the S&P 500, while the red line above tracks the inverted (down means up) VIX. If you analyze the relationship, you can see that spikes in volatility often occur when the S&P 500 falls.
When the S&P 500 was near 3,850 in June and September/October, the VIX was north of 30. In contrast, the metric declined on Dec. 16, and stands near 23. As a result, investors don’t fear a higher FFR, an earnings malaise or a potential recession, and the complacency highlights their misguided faith in the Fed.
But, while the crowd takes the index’s slide in stride, the damage beneath the surface is highly ominous. For example, the ARK Innovation ETF (ARKK) sunk to a new 52-week low on Dec. 19; and with liquidity-fueled assets suffering mightily since the FOMC released its economic projections, silver’s relative strength looks a lot like February/March 2022.
Please see below:
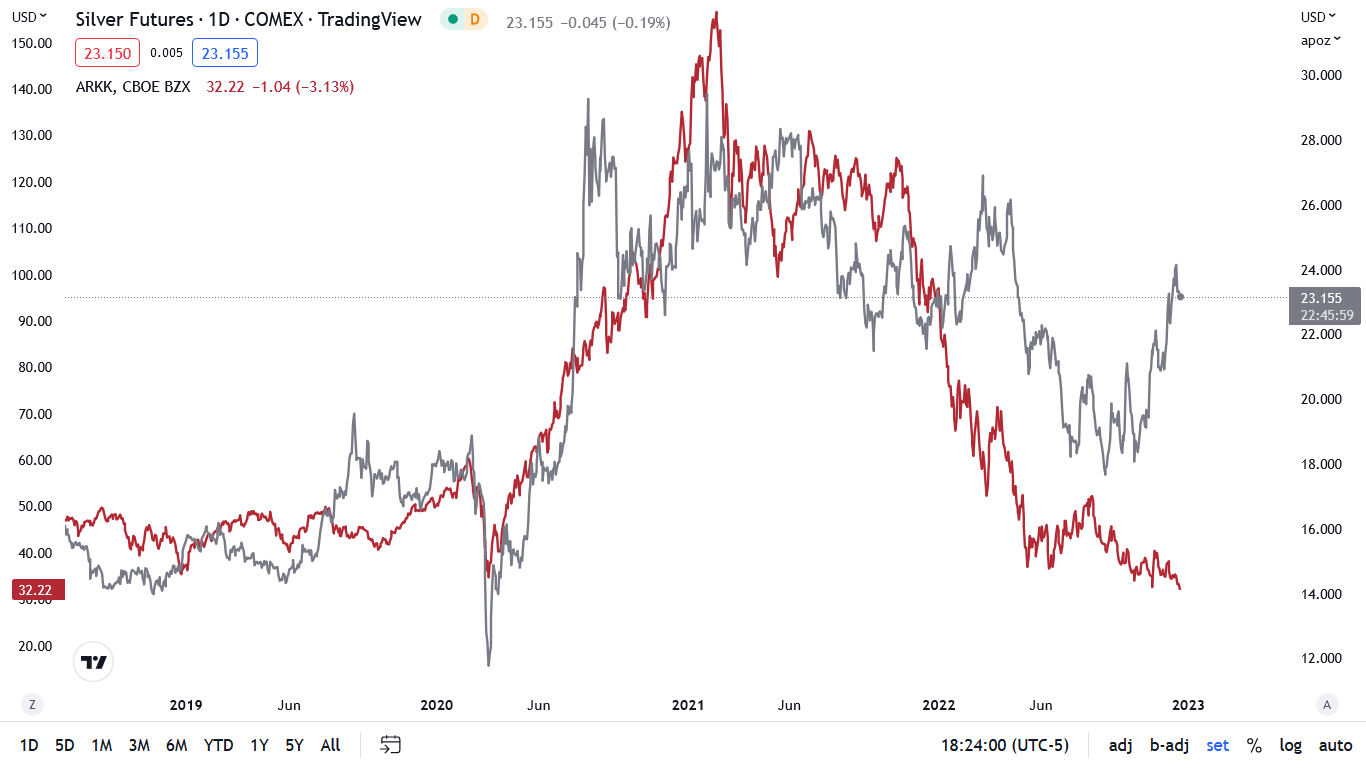
To explain, the gray line above tracks the silver futures price, while the red line above tracks the ARKK ETF. If you analyze the relationship, you can see that the pair have followed a similar long-term path.
Moreover, both benefit from a similar fundamental environment. With silver, lower interest rates reduce the appeal of bonds and increase the appeal of non-yielding assets that benefit from higher inflation. With the ARKK ETF, profitless companies benefit from lower interest rates because it’s cheaper to finance their operations. Essentially, they can plug their negative free cash flow holes by issuing new debt and/or equity.
Conversely, when interest rates rise and liquidity evaporates, profitless companies lose even more money as their interest costs rise. As such, the ARKK ETF is a QE beneficiary, and silver has similar characteristics.
Now, if you focus your attention on the right side of the chart, you can see that the silver price has risen dramatically even as the ARKK ETF hits new lows. Yet, a similar development occurred in February/March 2022 when the Russia-Ukraine war uplifted the silver price and sunk the ARKK ETF. Although, it wasn’t long before the white metal plunged to new lows.
So, while silver may seem invincible, the plight of other liquidity beneficiaries should result in a profound drawdown over the medium term.
To that point, while the crowd has been programmed to await dovish pivots, their faith in the Fed should come under immense pressure in 2023. For context, we added on Dec. 19:
Not only are U.S. households holding their positions with little anxiety, but the imbalances built up before this recessionary bear market were at an all-time high. Yet, since the crowd assumes another post-GFC pivot will send stocks soaring, they’ve been trained to wait for the Fed to save the day. However, unanchored inflation is a different animal, and the Fed can’t solve this problem by printing money.
As a result, with the Fed stuck between a rock (inflation) and a hard place (potential recession), the fundamental backdrop makes the central bank's challenge extremely troublesome.
Please see below:
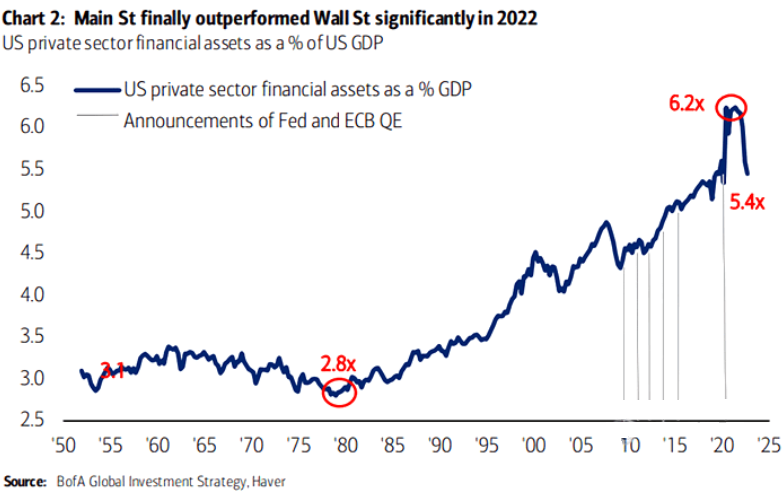
To explain, the blue line above tracks U.S. private sector financial assets as a percentage of U.S. GDP. During the peak of the pandemic-induced bubble, the metric hit an all-time high of 6.2x before declining to 5.4x as the 2022 bear market unfolded.
Yet, if you analyze the vertical gray lines on the right side of the chart, you can see that the Fed and the ECB always stepped in post-GFC to provide a liquidity buffer; and unsurprisingly, risk assets rallied and pushed the blue line higher.
Also, the metric is still above the highs set during the GFC and the dot-com bubble, which highlights how the value of financial assets has risen beyond what’s supported by their underlying economics. As such, with great dispersions often leading to great reversions, a normalization of the metric could have a profound impact on silver.
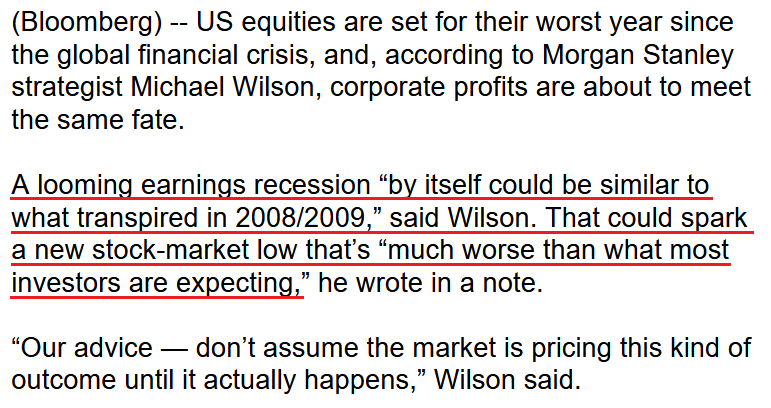
In addition, Morgan Stanley’s Chief U.S. Equity Strategist Mike Wilson told clients on Dec. 19 that his bear case of $180 per share in S&P 500 earnings seems increasingly likely (the consensus expects $231). Therefore, he sees an earnings recession that rivals the GFC, and a realization could send risk assets into a nosedive.
Please see below:
 Source: Bloomberg
Overall, the white metal has kept its cool despite falling stock prices and rising real interest rates. However, the silver price is highly volatile, and when sentiment shifts, epic drawdowns typically occur. Thus, while it may seem like a safe place to hide right now, we’ve seen this movie before, and the climax is often profoundly bearish.
The Bottom Line
While investors’ attempt at a Santa Clause rally has turned into a Christmas mauling, seasonality remains bullish for the rest of 2022. But, with the New Year riddled with the same fundamental problems, the pessimism should intensify as the Fed’s inflation-growth conundrum becomes more destructive. Consequently, while the USD Index has been on its back foot in recent months, we still expect new highs in 2023.
In conclusion, the PMs declined on Dec. 19, as the holiday cheer disappeared. Although, while some financial assets have suffered mightily, gold, silver and mining stocks have been relative outperformers. In contrast, that sentiment should shift in the months ahead, and the algorithms keeping the PMs uplifted should unwind their positions as the fundamentals continue to deteriorate.
Overview of the Upcoming Part of the Decline
- It seems to me that the corrective upswing is over (or about to be over) and that the next big move lower is already underway (or that it’s about to start).
- If we see a situation where miners slide in a meaningful and volatile way while silver doesn’t (it just declines moderately), I plan to – once again – switch from short positions in miners to short positions in silver. At this time, it’s too early to say at what price levels this could take place and if we get this kind of opportunity at all – perhaps with gold prices close to $1,500 - $1,550.
- I plan to switch from the short positions in junior mining stocks or silver (whichever I’ll have at that moment) to long positions in junior mining stocks when gold / mining stocks move to their 2020 lows (approximately). While I’m probably not going to write about it at this stage yet, this is when some investors might consider getting back in with their long-term investing capital (or perhaps 1/3 or 1/2 thereof).
- I plan to return to short positions in junior mining stocks after a rebound – and the rebound could take gold from about $1,450 to about $1,550, and it could take the GDXJ from about $20 to about $24. In other words, I’m currently planning to go long when GDXJ is close to $20 (which might take place when gold is close to $1,450), and I’m planning to exit this long position and re-enter the short position once we see a corrective rally to $24 in the GDXJ (which might take place when gold is close to $1,550).
- I plan to exit all remaining short positions once gold shows substantial strength relative to the USD Index while the latter is still rallying. This may be the case with gold prices close to $1,400 and GDXJ close to $15 . This moment (when gold performs very strongly against the rallying USD and miners are strong relative to gold after its substantial decline) is likely to be the best entry point for long-term investments, in my view. This can also happen with gold close to $1,400, but at the moment it’s too early to say with certainty.
- The above is based on the information available today, and it might change in the following days/weeks.
You will find my general overview of the outlook for gold on the chart below:
Please note that the above timing details are relatively broad and “for general overview only” – so that you know more or less what I think and how volatile I think the moves are likely to be – on an approximate basis. These time targets are not binding nor clear enough for me to think that they should be used for purchasing options, warrants, or similar instruments.
Letters to the Editor
We received a few messages over e-mail, but as we are moving to our new platform, we will be transferring them below the articles as comments – and that’s where we’ll be replying to them.
Asking your questions below the articles or in the spaces called “Ask the Community” or “Position Sizes” directly will help us deliver a reply sooner. In some cases, someone from the community might reply and help even before we do.
Please remember about the Pillars of our Community, especially about the Kindness of Speech Pillar.
Also, if there’s anything that you want to complain about, it’s best to send us a message at [email protected].
Please note that this section is going to go away within the next 1-8 weeks, as you can add comments/questions below the article on Golden Meadow – the platform that we’re using to provide our analyses. Your notification e-mails include an invitation link that allows you to access the “Gold Trading Alerts” space.
Also, if you haven’t had the chance to see the video, in which I’m talking about the new platform and why we essentially moved from Sunshine Profits to Golden Meadow, I strongly encourage you to do so:
Summary
Summing up, it seems that the major bottom in the USD Index is in, while the correction in stocks, gold, silver, and mining stocks is over.
The nature of the recent corrections was mostly technical and rumor-based. The rumor was that the Fed would be making a dovish U-turn soon, and it recently became clear that this was not going to be the case. Consequently, the corrective upswing is likely to be reversed, and medium-term downtrends are likely to resume.
In my opinion, the current trading position is going to become profitable in the following weeks, and quite possibly in the following days. And while I can’t promise any kind of performance, I fully expect it to become very profitable before it’s over and to prolong our 2022 winning streak.
After the final sell-off (that takes gold to about $1,350-$1,500), I expect the precious metals to rally significantly. The final part of the decline might take as little as 1-5 weeks, so it's important to stay alert to any changes.
As always, we'll keep you – our subscribers – informed.
To summarize:
Trading capital (supplementary part of the portfolio; our opinion): Full speculative short positions (300% of the full position) in junior mining stocks are justified from the risk to reward point of view with the following binding exit profit-take price levels:
Mining stocks (price levels for the GDXJ ETF): binding profit-take exit price: $20.32; stop-loss: none (the volatility is too big to justify a stop-loss order in case of this particular trade)
Alternatively, if one seeks leverage, we’re providing the binding profit-take levels for the JDST (2x leveraged). The binding profit-take level for the JDST: $22.87; stop-loss for the JDST: none (the volatility is too big to justify a SL order in case of this particular trade).
For-your-information targets (our opinion; we continue to think that mining stocks are the preferred way of taking advantage of the upcoming price move, but if for whatever reason one wants / has to use silver or gold for this trade, we are providing the details anyway.):
Silver futures downside profit-take exit price: $14.32
SLV profit-take exit price: $13.42
ZSL profit-take exit price: $48.87
Gold futures downside profit-take exit price: $1,504
HGD.TO – alternative (Canadian) 2x inverse leveraged gold stocks ETF – the upside profit-take exit price: $16.47
HZD.TO – alternative (Canadian) 2x inverse leveraged silver ETF – the upside profit-take exit price: $36.87
Long-term capital (core part of the portfolio; our opinion): No positions (in other words: cash)
Insurance capital (core part of the portfolio; our opinion): Full position
Whether you’ve already subscribed or not, we encourage you to find out how to make the most of our alerts and read our replies to the most common alert-and-gold-trading-related-questions.
Please note that we describe the situation for the day that the alert is posted in the trading section. In other words, if we are writing about a speculative position, it means that it is up-to-date on the day it was posted. We are also featuring the initial target prices to decide whether keeping a position on a given day is in tune with your approach (some moves are too small for medium-term traders, and some might appear too big for day-traders).
Additionally, you might want to read why our stop-loss orders are usually relatively far from the current price.
Please note that a full position doesn't mean using all of the capital for a given trade. You will find details on our thoughts on gold portfolio structuring in the Key Insights section on our website.
As a reminder - "initial target price" means exactly that - an "initial" one. It's not a price level at which we suggest closing positions. If this becomes the case (as it did in the previous trade), we will refer to these levels as levels of exit orders (exactly as we've done previously). Stop-loss levels, however, are naturally not "initial", but something that, in our opinion, might be entered as an order.
Since it is impossible to synchronize target prices and stop-loss levels for all the ETFs and ETNs with the main markets that we provide these levels for (gold, silver and mining stocks - the GDX ETF), the stop-loss levels and target prices for other ETNs and ETF (among other: UGL, GLL, AGQ, ZSL, NUGT, DUST, JNUG, JDST) are provided as supplementary, and not as "final". This means that if a stop-loss or a target level is reached for any of the "additional instruments" (GLL for instance), but not for the "main instrument" (gold in this case), we will view positions in both gold and GLL as still open and the stop-loss for GLL would have to be moved lower. On the other hand, if gold moves to a stop-loss level but GLL doesn't, then we will view both positions (in gold and GLL) as closed. In other words, since it's not possible to be 100% certain that each related instrument moves to a given level when the underlying instrument does, we can't provide levels that would be binding. The levels that we do provide are our best estimate of the levels that will correspond to the levels in the underlying assets, but it will be the underlying assets that one will need to focus on regarding the signs pointing to closing a given position or keeping it open. We might adjust the levels in the "additional instruments" without adjusting the levels in the "main instruments", which will simply mean that we have improved our estimation of these levels, not that we changed our outlook on the markets. We are already working on a tool that would update these levels daily for the most popular ETFs, ETNs and individual mining stocks.
Our preferred ways to invest in and to trade gold along with the reasoning can be found in the how to buy gold section. Furthermore, our preferred ETFs and ETNs can be found in our Gold & Silver ETF Ranking.
As a reminder, Gold & Silver Trading Alerts are posted before or on each trading day (we usually post them before the opening bell, but we don't promise doing that each day). If there's anything urgent, we will send you an additional small alert before posting the main one.
Thank you.
Przemyslaw K. Radomski, CFAFounder, Editor-in-chief

