In short: No changes and no positions.
The markets are closed today, but we will send you tomorrow’s alert today, as we have already conducted the analysis based on Friday’s closing prices.
Gold moved higher on Friday and moved to this month’s previous high. Miners rallied more significantly. How much has actually changed? Please take a look below (charts courtesy of http://stockcharts.com.)
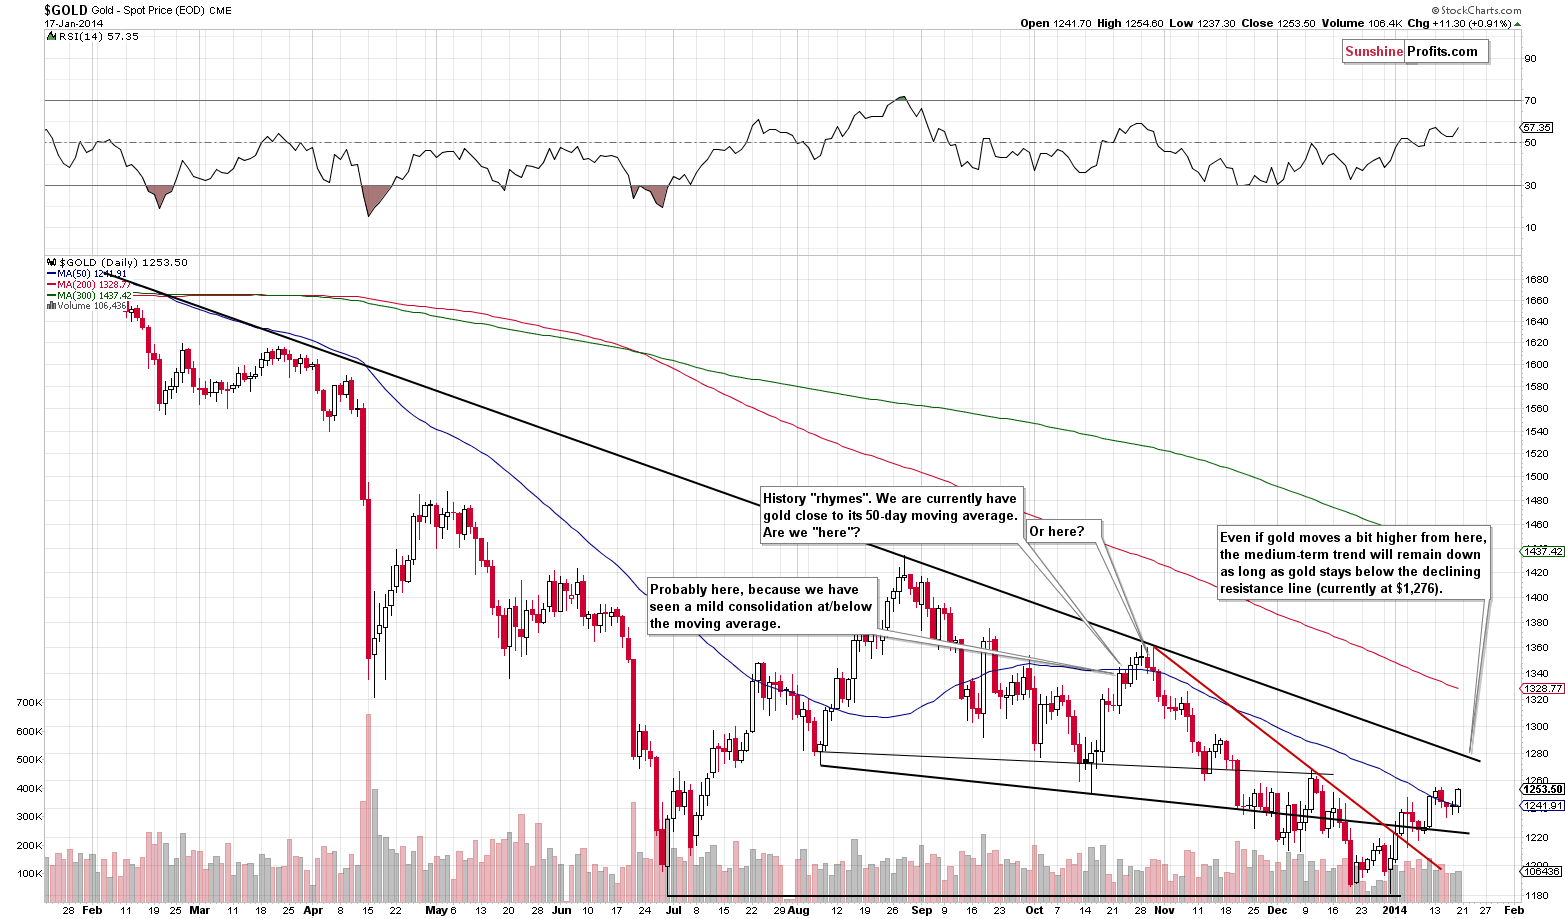
We have previously written that the current situation was similar to 2 cases from the past – one right at the local top and the second a few days before it. In the previous alert we wrote the following:
Gold is still close to the 50-day moving average, but at this time it seems that the current situation is more similar to what we saw before the top in October 2013, not right at it. The reason is that back in October, a few days after the top the decline was well underway and at this time we‘ve only seen a mild move lower. Consequently, it’s more of a pause – something that we saw before the final move higher.
Taking intra-day action into account alone, the implications are bullish. Intra-day reversals are usually followed by the continuation of the move that we‘ve seen in the final part of the market session. In this case, that move was up.
We have actually seen a move higher and now it’s clear that the current situation was and still is similar to the pre-top consolidation close to the 50-day moving average. Based on the above, we might see another small move up (smaller than $30).
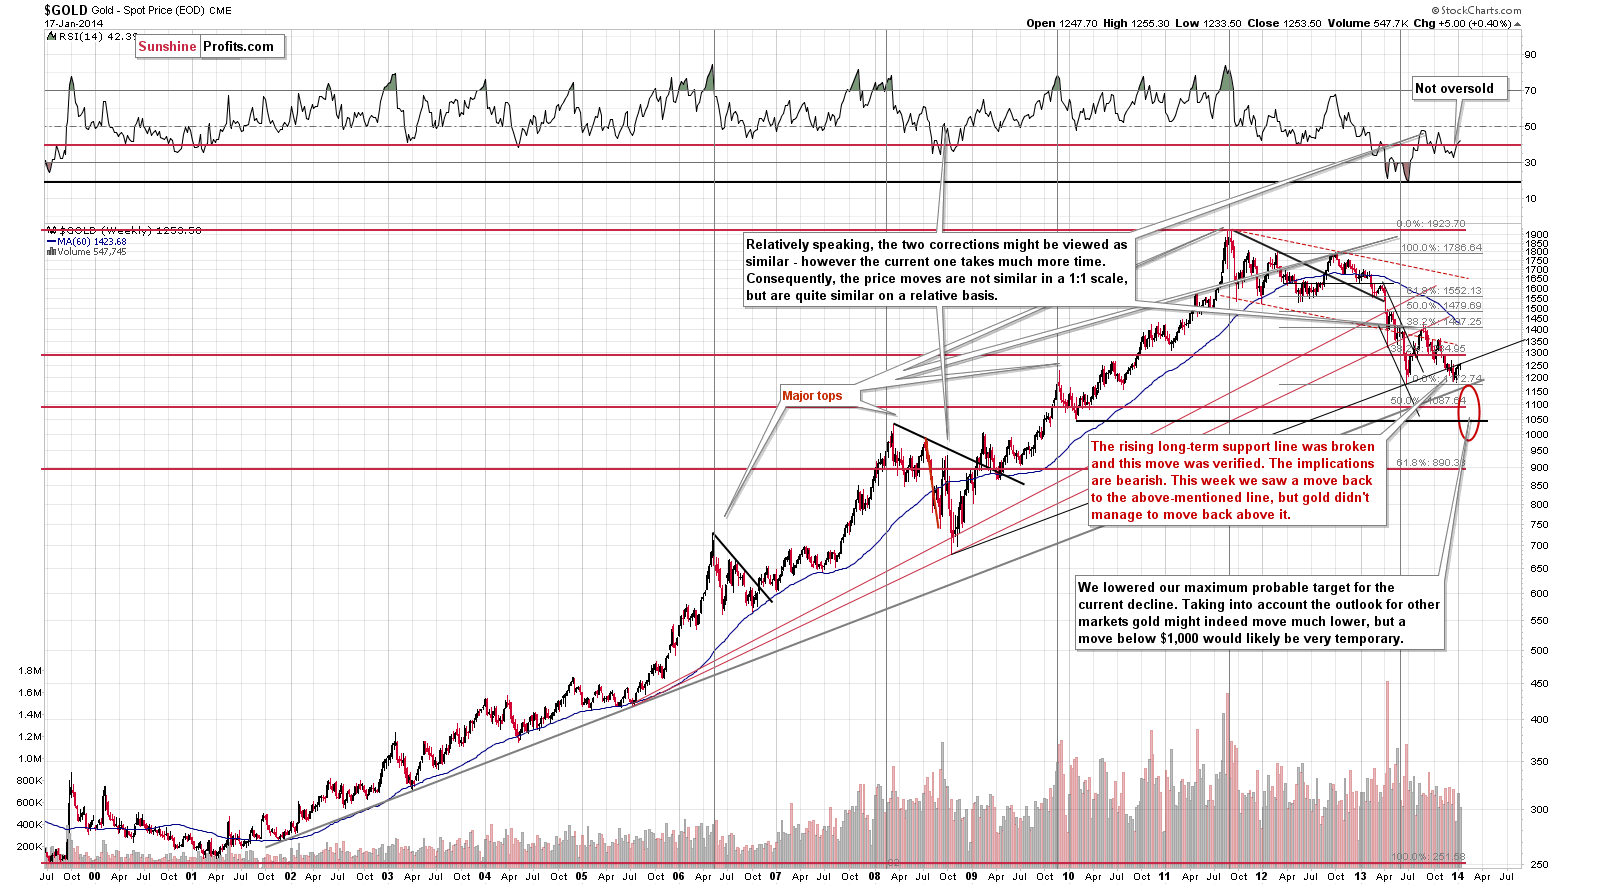
From the long-term point of view, the situation didn’t change last week. Gold moved higher by 0.4%, but the rising, long-term resistance line was not broken. Since this line is rising, the fact that gold moved a bit higher last week didn’t have to imply that there was a breakout even though gold was at this line a week ago. At this time, gold remains below this line, which means that the situation didn’t change and the medium-term trend remains bearish.
So, from the short-term point of view, we might see another move higher, which is not likely to take gold far – because that would mean an invalidation of a long-term resistance line. We could see a temporary move above it and an invalidation in the following days. That’s what seems quite likely based on the above 2 charts. Let’s see what other charts suggest.
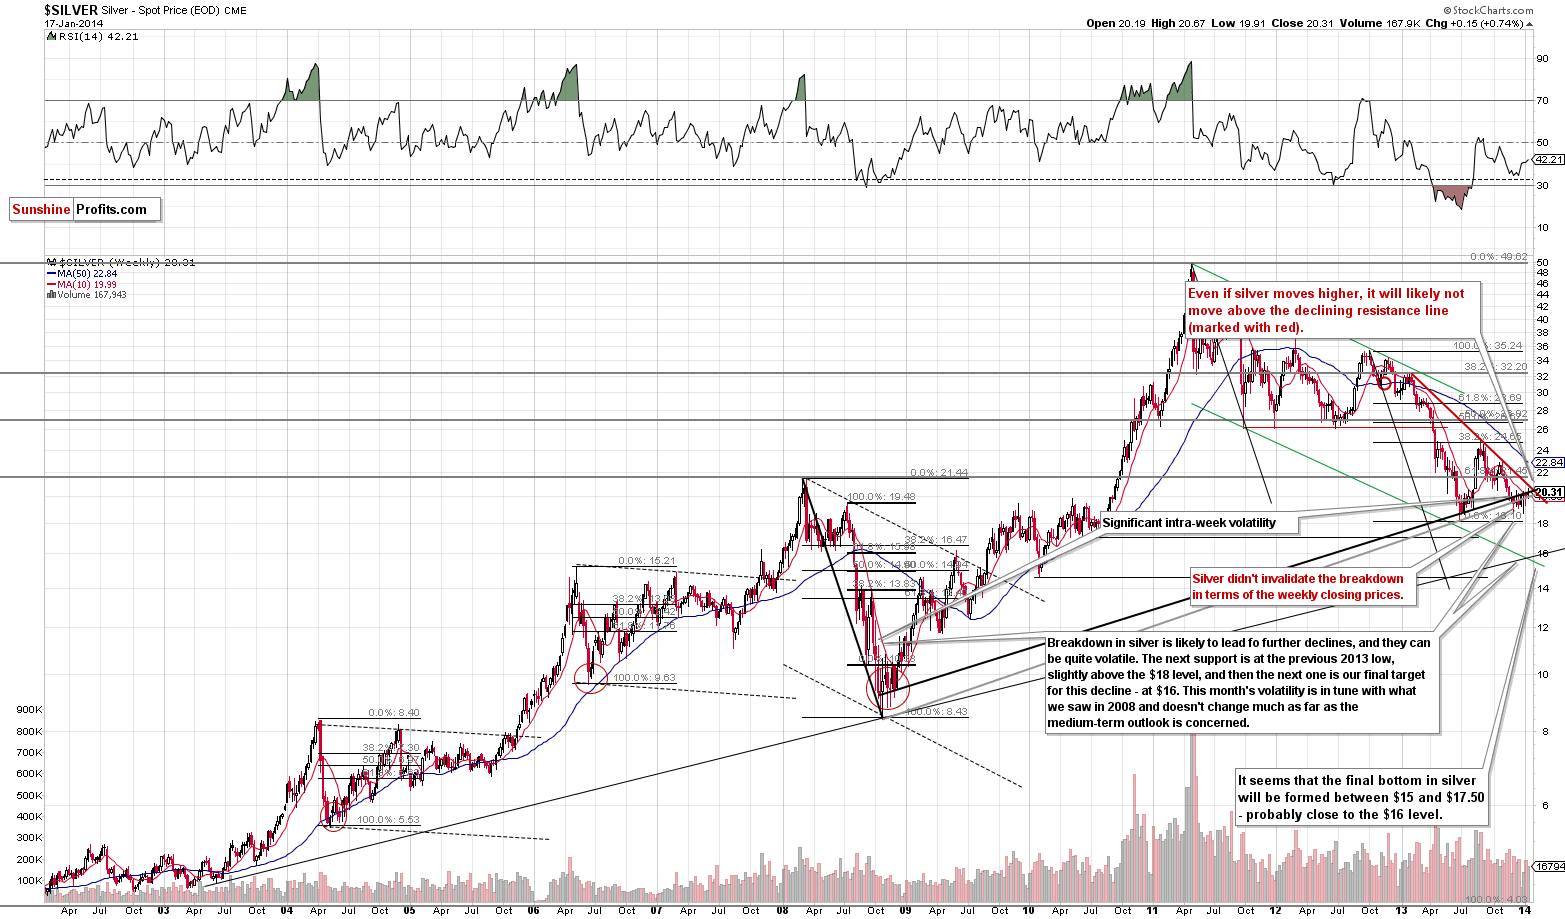
The white metal moved slightly higher last week (less than 1%) and the outlook didn’t change. Silver is right at the rising long-term resistance line based on the weekly closing prices (thick, black line) and it remains below the declining medium-term resistance line (red line). This means two things: that the medium-term trend remains down, and that even if we see a $0.50 rally, it will still remain down, as the declining resistance line will be broken.
The bearish implications remain in place.
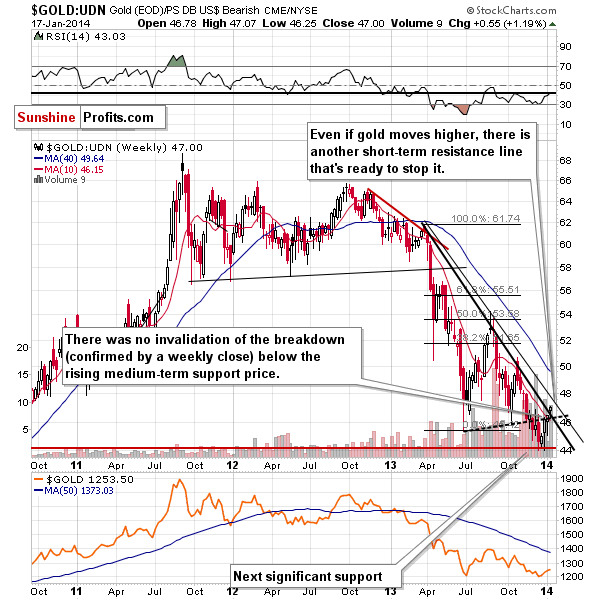
From the non-USD perspective, we saw a breakout in gold, but, as mentioned previously, it doesn’t change much. The reason is that the upper resistance line is still likely to keep the rally in check. All the last week’s breakout means at this time, is that gold is likely to move a little higher in the coming days. It does not have bullish implications beyond that.
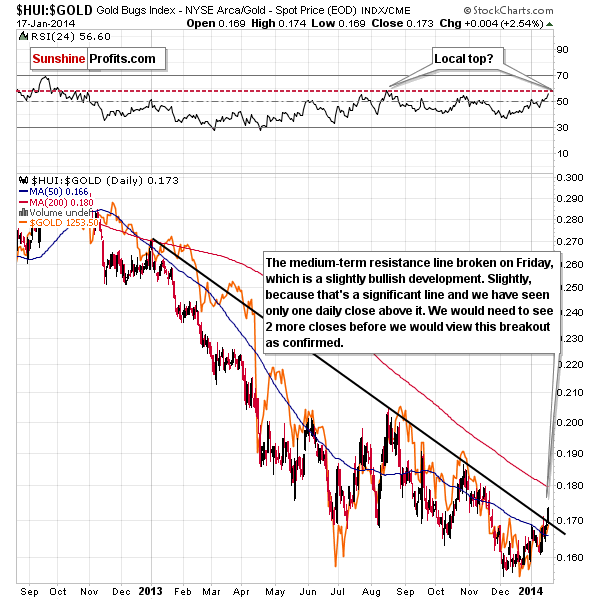
The declining resistance line on the gold stocks to gold ratio chart was broken, which has some bullish implications. However, becoming bullish based this price move might be misleading in our view. One daily close is not enough for us to view the breakout as confirmed – we would need to see additional 2 daily closes.
Additionally, the RSI indicator is very close to the level which marked a local top in August 2013. Miners‘ strength relative to gold looked even more promising at that time, but it turned out that a local top was formed.
Furthermore, the breakout is not visible if we use different proxies for miners and for gold.
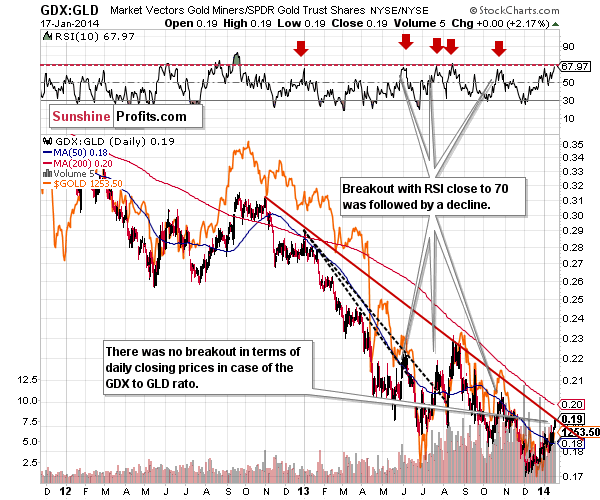
If we use ETFs: the GDX ETF as a proxy for the precios metals mining stocks and the GLD ETF as a proxy for gold, and divide GDX by GLD, we will get a bearish picture in which the ratio moved to the declining, medium-term resistance line without breaking it. Therefore, the trend remains down and declines are to be expected.
Moreover, the RSI indicator is very close to the 70 level – also something that indicated local tops in the previous months.
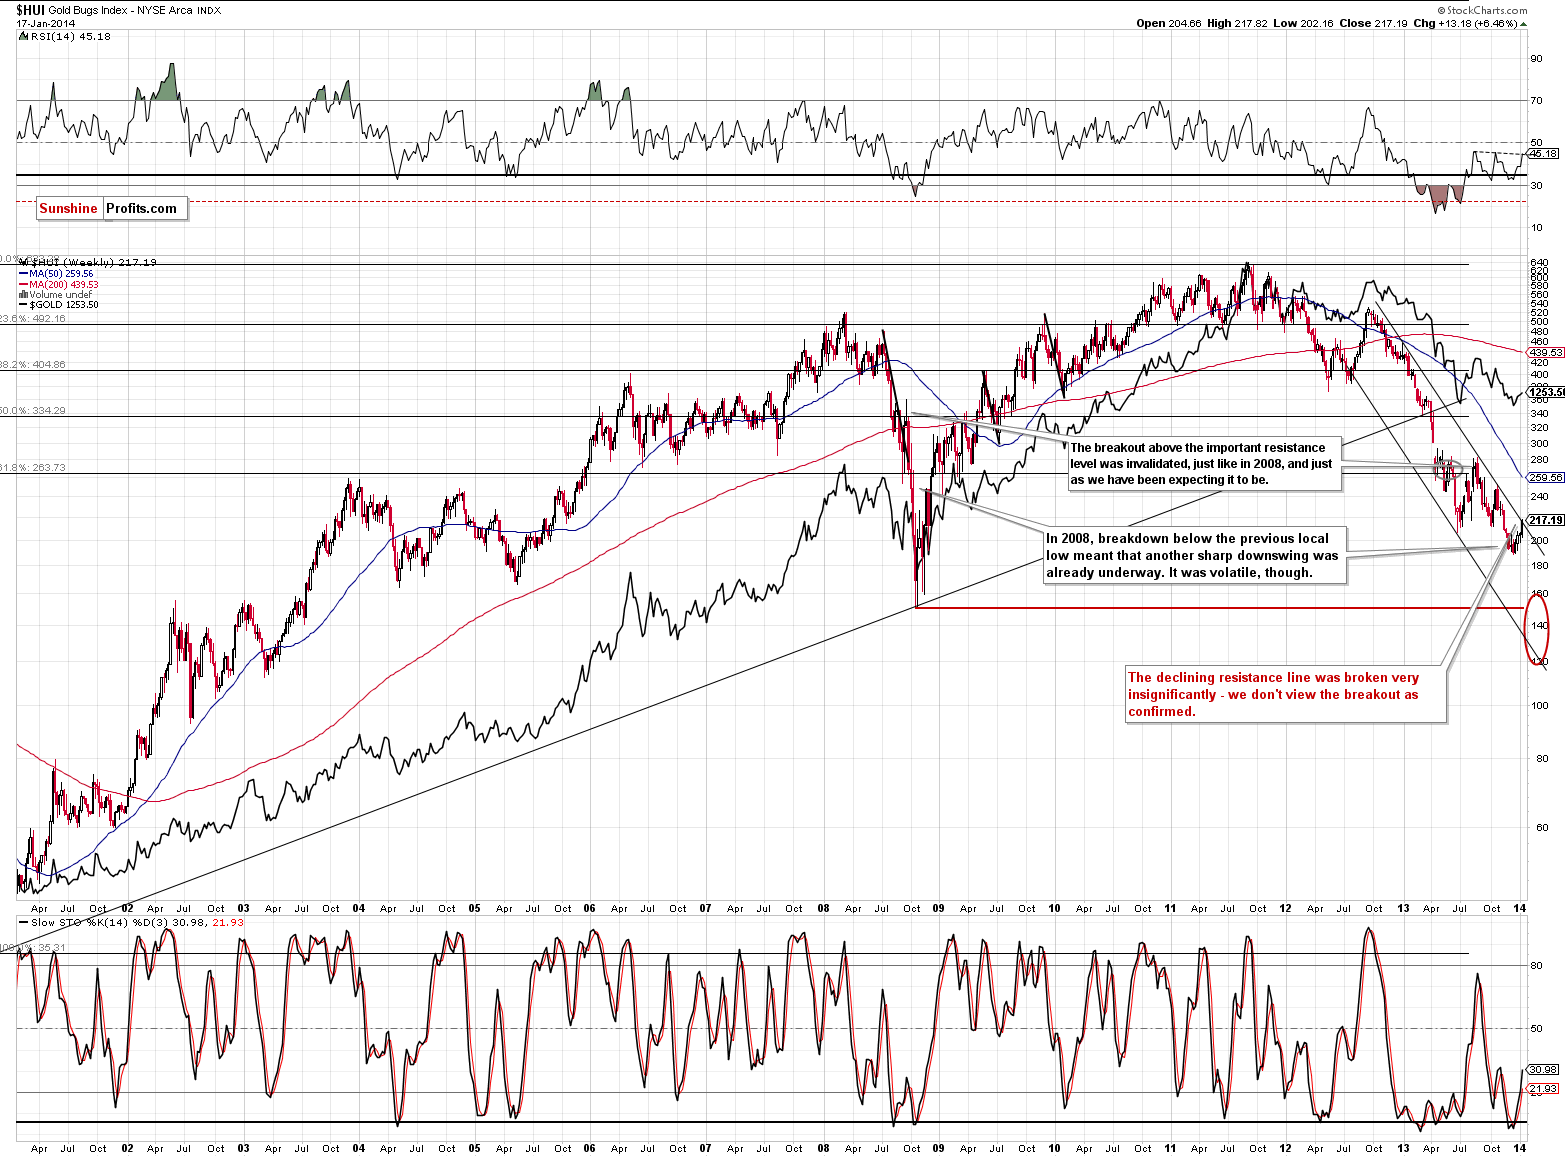
Gold stocks themselves - the HUI Index - moved higher last week, but even though the rally was quite significant on a day-to-day basis, it hasn’t changed much so far. We saw a move above the declining medium-term resistance line, but it was quite insignificant, so it’s not really meaningful. We would need to see at least (!) 2 more trading days with closes above it before viewing the breakout as confirmed.
Taking all of the above into account, we get the same result we got previously. The situation in the precious metals market is rather unclear for the short term (there are some bullish signs, but there are some strong resistance lines right where the prices/ratios are as well) but remains bearish for the medium term. Our best guess is that we will see a decline in the coming weeks but not necessarily right away. We will consider opening speculative short positions once we see some kind of confirmation.
To summarize:
- Trading capital: No positions.
- Long-term capital: No positions.
As always, we'll keep you - our subscribers - updated should our views on the market change. We will continue to send out Market Alerts on each trading day and we will send additional Market Alerts whenever appropriate.
The trading position presented above is the netted version of positions based on subjective signals from your Editor, and the automated tools (SP Indicators and the upcoming self-similarity-based tool).
As a reminder, Market Alerts are posted before or on each trading day (we usually post them before the opening bell, but we don't promise doing that each day). If there's anything urgent, we will send you an additional small alert before posting the main one.
=====
On an administrative note, as you read and saw last week, we moved from weekly updates and daily chart-less alerts to daily alerts with charts. This has one additional implication that doesn’t affect you, but we want to keep you informed anyway. Since there are no more „Premium Updates“, we will not be able to post „free essays based on Premium Updates“, which we previously used to let people know what we do and how we do it. You probably became aware of our existence after reading one of such essays. Since we need to provide something available for free in order to continue informing investors about our services, each week 1 or 2 of Gold & Silver Trading Alerts will be available publicly. As previously, only you – our subscribers – will remain updated at all times and you will receive these alerts on each trading day. The same rule will apply to our other trading alert services: Bitcoin Trading Alerts, Forex Trading Alerts, Oil Trading Alerts, and Stock Trading Alerts. We will provide links to other free alerts at the bottom of the emails with Gold & Silver Trading Alerts. For example, today’s free alert is dedicated to the crude oil market and you will find a link to it below.
=====
Thank you.
Sincerely,
Przemyslaw Radomski, CFA


