Briefly: In our opinion, speculative short positions in gold and silver (half) and a speculative short position in mining stocks (full) are justified from the risk/reward point of view.
Quite a lot happened in the precious metals market this week and one of the most important events took place in the silver market. Namely, silver closed below its 50-week moving average and after previous analogous breakdowns (precisely, invalidations of the breakouts above the line) silver declined quite substantially (over $2). Will we see the same kind of performance shortly?
In our opinion, it’s quite likely, but we still can’t rule out another temporary move higher in the next few days. Let’s take a look at the charts (charts courtesy of http://stockcharts.com).
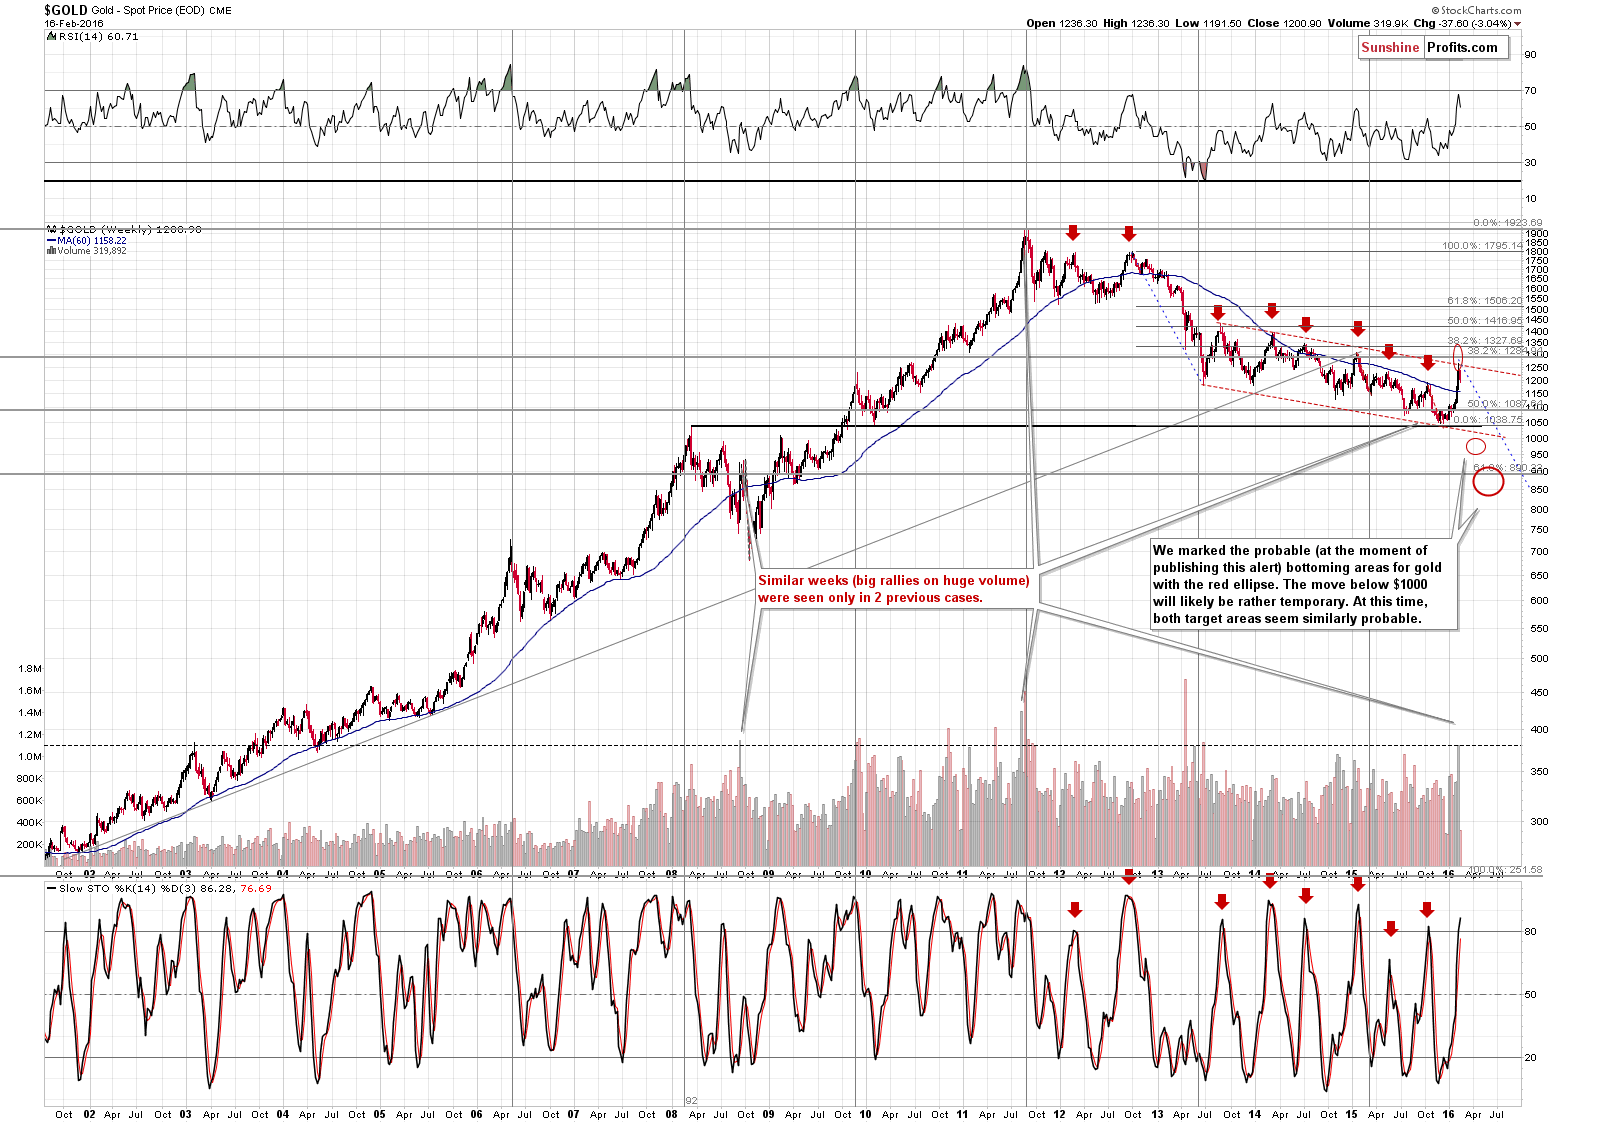
From the long-term perspective, gold appears to have topped. It moved to the upper border of the declining trend channel and reversed. The reversal was seen on huge volume and in the previous cases when similar volume was seen, gold plunged in the following weeks. However, in both most similar cases (late 2008 and 2011 tops) gold moved higher to re-test the previous highs. We don’t think a move this big will be seen as the rally was to a large extent based on the incorrect reading of what Janet Yellen had said about NIRP (thus the rally was somewhat random and artificial) and this factor is not likely to be repeated, however, a move higher from here might still be in the cards (it’s not very likely, though).
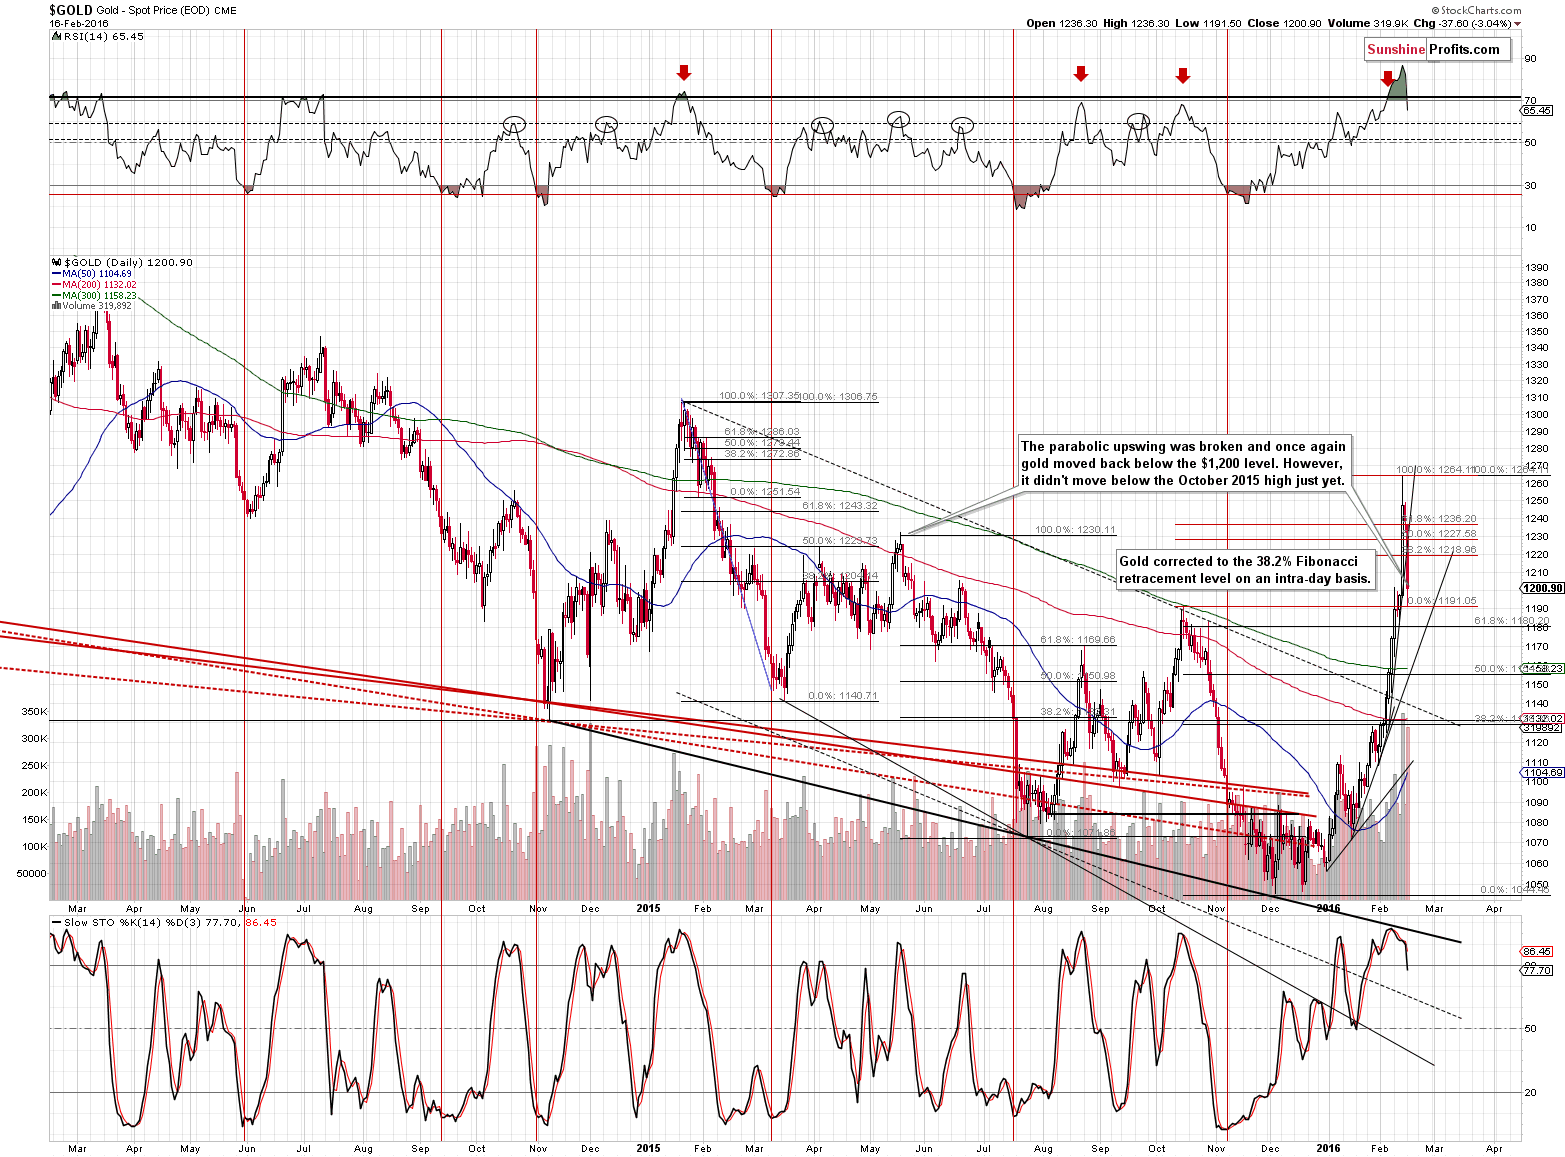
Yesterday, gold declined to the October 2015 high today and it started to correct. It moved more or less to the first of the classic Fibonacci retracement levels (38.2%) at $1,218 and then it declined once again. This tells us that the corrective rally could already be over, but it doesn’t prove it.
In other words, this is an indication that we should be considering doubling the size of the short position, but this signal is not bearish enough to really justify such action. We could also see a move to $1,236 (61.8% retracement) and it would also not change anything in the current outlook. What we would like to see is for instance a major daily reversal on strong volume or – even better – a move higher on weak volume. At this time it’s too unclear to double the position, but clear enough to keep the half of it (in the case of gold and silver) intact.
Yesterday’s downswing on significant volume is a bearish event, but by itself is not enough to really indicate that there will most likely be no additional upswing before the slide continues.
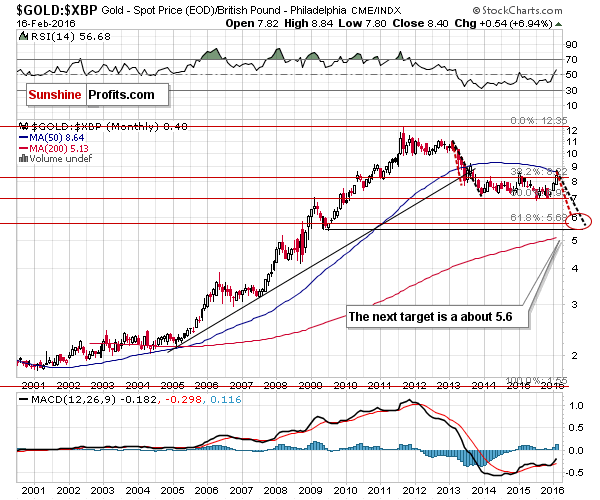
Taking a look at gold priced in the British pound, we see that it once again moved slightly above the 50-month moving average and then reversed. We saw the same kind of performance in 2013 and it was followed by further declines. The implications are bearish for the following weeks.
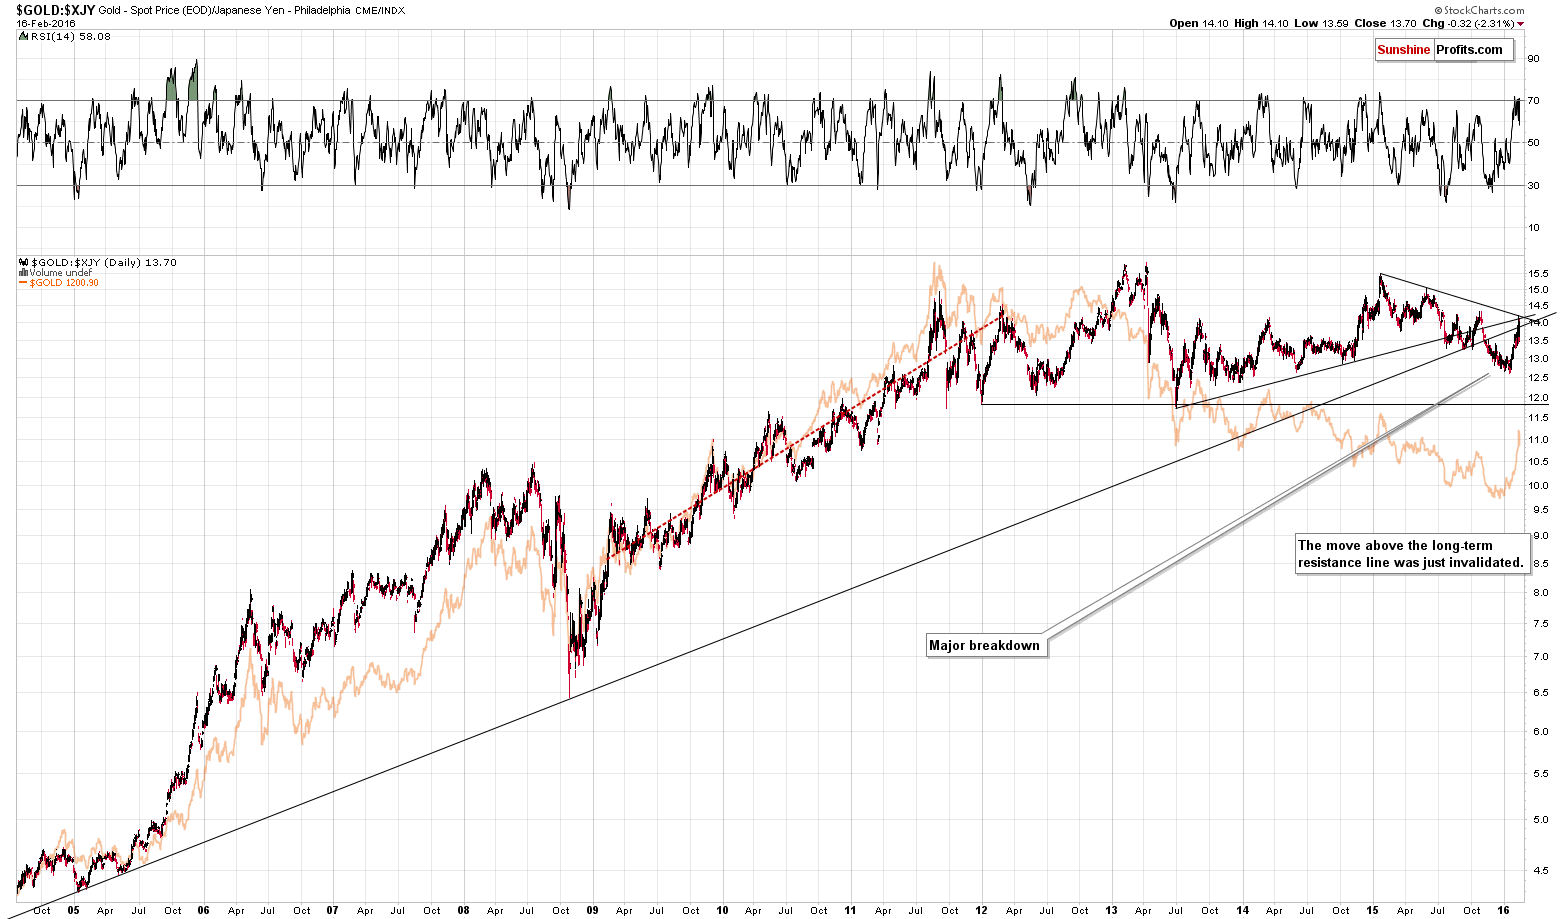
In Monday’s alert we wrote the following about the above chart:
The above chart features the gold price seen from the Japanese yen perspective. As is the case for other ratios, the above chart can help us detect tops and bottoms in gold as they correspond to tops and bottoms that we can see above. At this time, we can see that gold priced in the Japanese yen moved to a combination of 2 important resistance levels and then declined once again without breaking above them. This suggests that further rallies in gold will likely be limited and that gold is likely to reverse relatively soon.
We have also seen an invalidation of the breakout above the long-term rising resistance line, which is an additional bearish factor for the medium term.
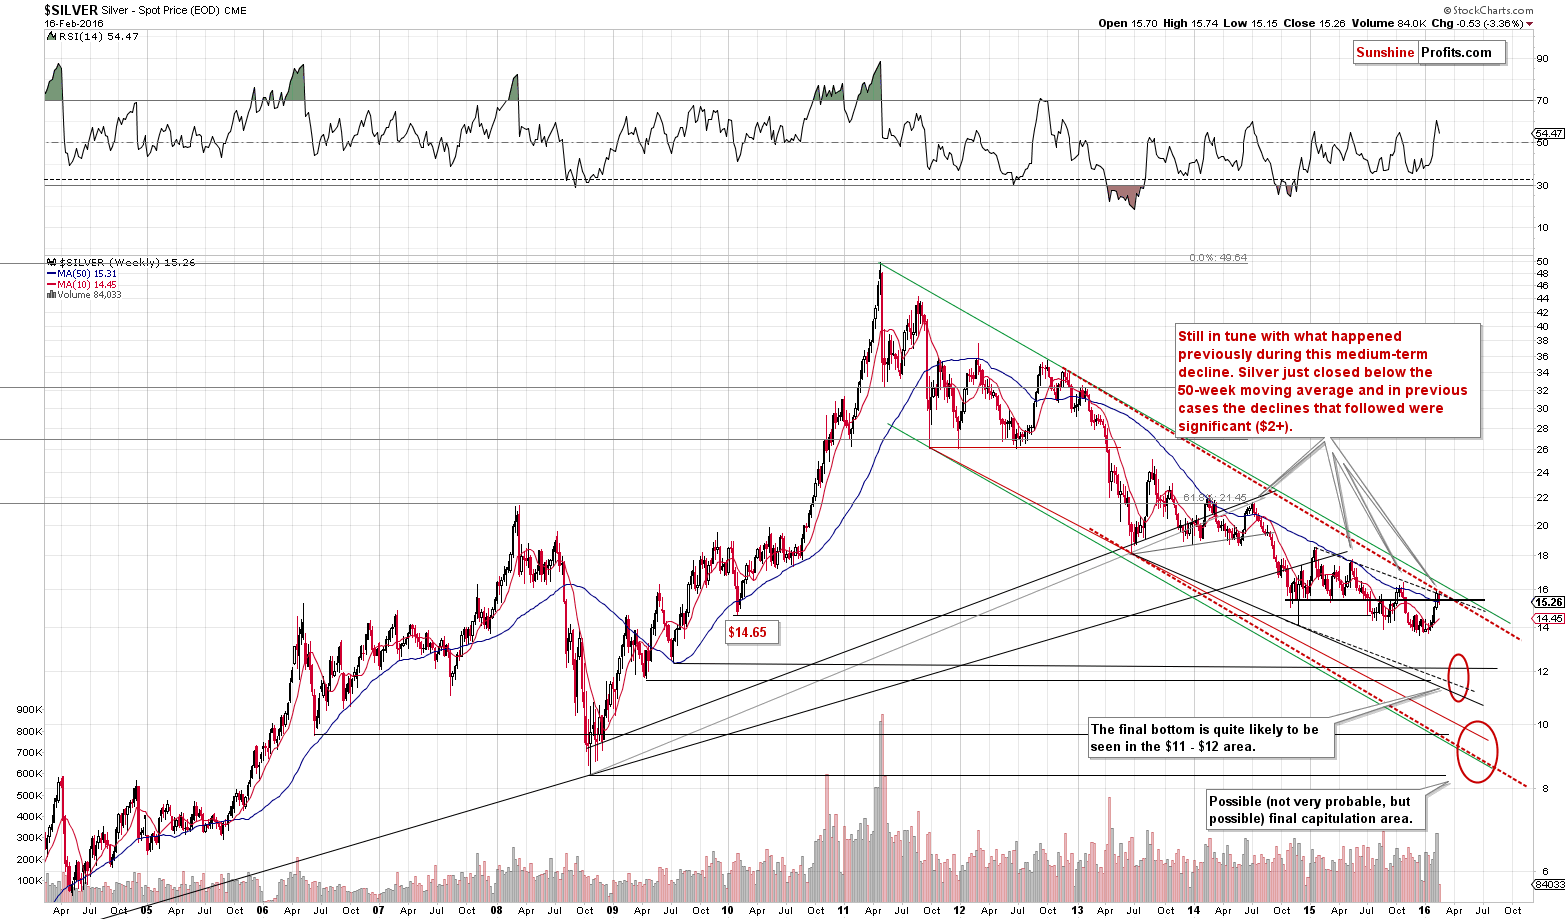
We wrote the following about silver in yesterday’s alert:
Silver moved back below the 50-week moving average earlier today, but now it’s once again above it. What does it mean? That silver is on the brink of generating yet another major sell signal – a close below the 50-week moving average would serve as such. The previous moves above this average were invalidated and we expect the history to repeat also this time. More importantly, these previous attempts and invalidations were followed by substantial declines (over $2) and it appears that the potential size of the next downswing is really significant.
We have just seen the mentioned bearish signal. A weekly close below the 50-week moving average would be even more profound, but at this time the implications are already bearish.
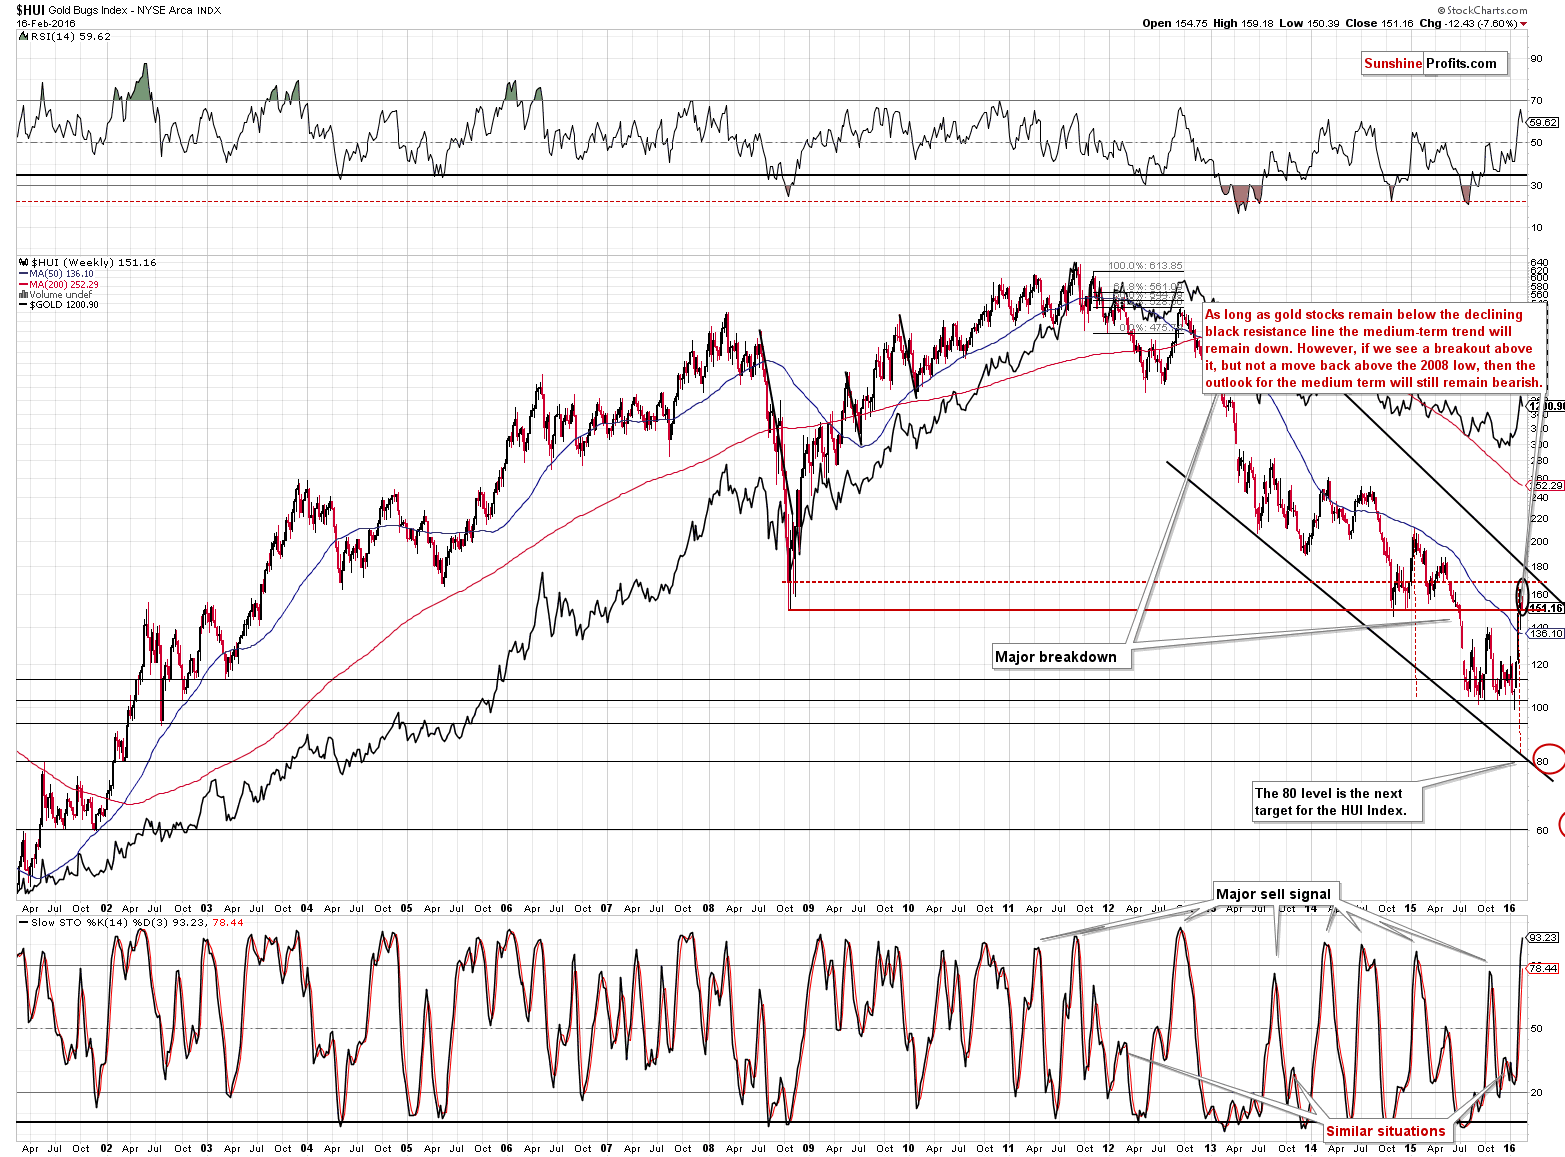
Gold stocks have declined significantly yesterday and they are almost back below the 150 level. Once miners slide visibly below their 2008 low and close there, we’ll have a strong bearish confirmation.
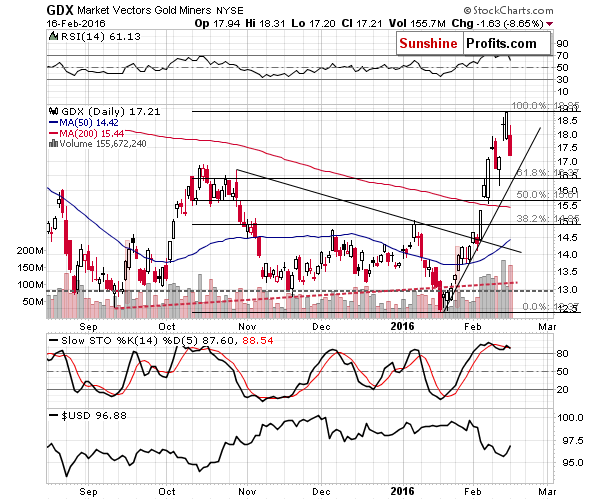
On a short-term basis, we see that GDX moved lower on high volume (much higher than what we had seen during the previous day’s upswing), which is a bearish sign, but – after giving it a lot of thought – it doesn’t seem strong enough to substantially increase the odds of declines in the coming days. Please note that in October 2015 miners also declined on significant volume, but that was not the very start of the decline. Miners moved higher once again before declining substantially. Therefore, while the outlook for the miners is already very bearish, we don’t think the confirmation that we got yesterday was strong enough to make the short-term outlook very bearish for gold and silver as well. For instance, a move higher on tiny volume or a confirmed breakdown below $16.40 or so (the rising support line and the 61.8% Fibonacci retracement level) would serve as a stronger bearish confirmation, but we haven’t seen these signs just yet.
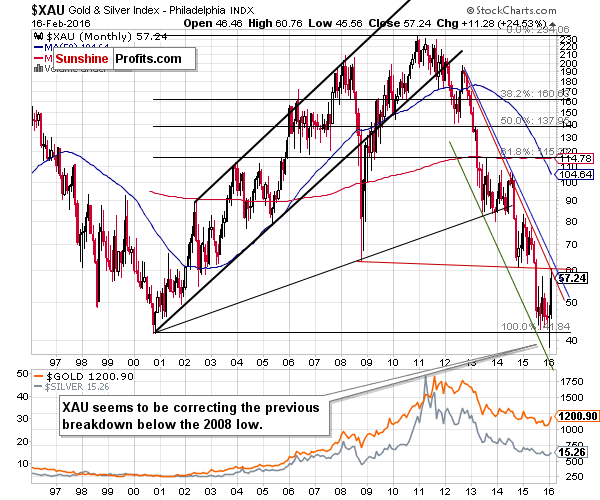
Still, let’s keep in mind that the XAU Index declined after moving to a combination of strong resistance levels, so the odds are that there will be no new high soon.
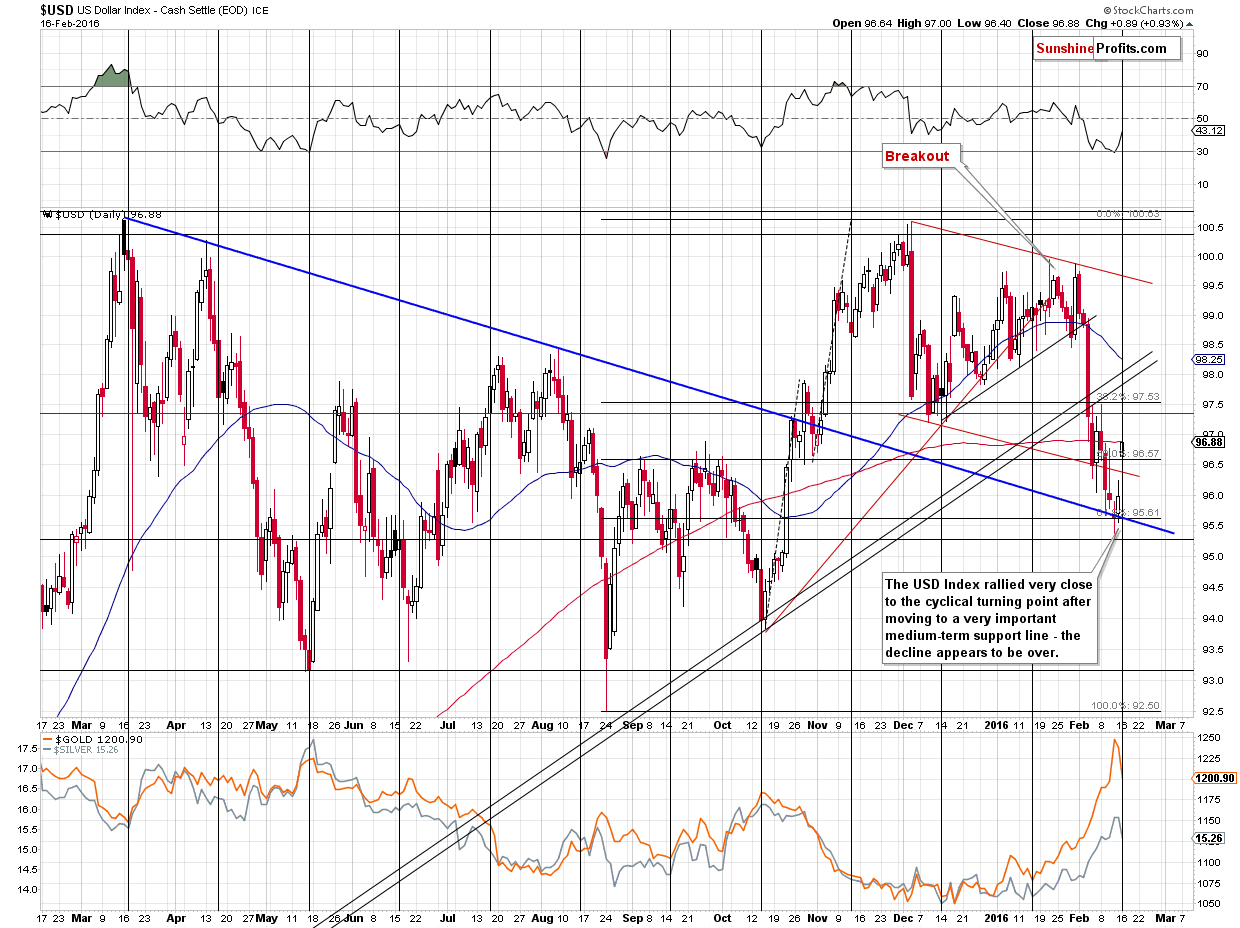
Meanwhile, our previous comments on the USD Index remain up-to-date:
The USD index is currently in a very bullish situation. It moved extremely low this month after comments from the Fed that the US dollar was too strong. This phrase is usually applied to stock market investments, but we were asked about it regarding the USD Index, so we would like to take this opportunity to discuss this issue.
It is common knowledge that one shouldn’t fight the Fed, but this could be extended to other monetary authorities as well. Does it change anything regarding the USD outlook? Yes, because the USD Index is the average of currency pairs and currency pairs are… well, pairs – it is quoting one currency against the other. So, the U.S. dollar is only half of the equation with each currency pair. The greatest and key weight in the USD Index is related to the EUR/USD pair. This means that it is not only the U.S. dollar per se that is important – the euro is critical as well and other currencies are important as well. Now, the question is: given all the turmoil and economic problems in Europe does the ECB want a stronger euro against the U.S. dollar? Of course not. Strong currencies mean less competitive exports and that’s the last thing that the ECB wants for the Eurozone.
All in all, the Fed does not want a strong dollar, but other central banks don’t want strong currencies either. “The currencies aren’t floating - they are sinking at different paces”. If the perceived value of the USD declines but the perceived value of the EUR declines more, the EUR/USD exchange rate will decline and the USD Index will rally unless other currency exchange rates move significantly.
So, if one doesn’t “fight” the Fed in case of the currency sector, they are likely fighting the ECB, BOJ and other monetary authorities. Since one can’t be “in tune” with what all of them want, it’s not really a very important factor not to be against or for any of them specifically.
What are the facts? By making a statement, the Fed wanted to push the USD lower and it managed to do so, however, the facts remain that the rates in the U.S. were just increased and they are being lowered on average in the rest of the world. Even if there are no additional rate increases (!), the USD Index could go higher, for instance if the rates are lowered in the rest of the world. The trend in the USD Index remains up.
What are the direct implications for the precious metals market? They are rather blurry but mostly bearish. Again, the trend in the USD Index remains up. Regarding the decisions for interest rates – market expectations drive the prices to a much greater extent along with emotions than it is the case with final decisions. For instance, gold moved higher despite an increase in the interest rates in the U.S. and years ago silver plunged right after the SLV ETF was introduced (which was supposed to drive silver prices to the moon). Consequently, even if it was the first and at the same last increase in the interest rates in the U.S., this does not imply that the final bottom in gold is already in. Gold declined from $1,900 to below $1,100 without an increase in interest rates and can decline without it once again.
So, what can we do to estimate gold’s likely moves? We can do what we’ve been doing for many years and what has proved to be profitable over the long run – we’ll analyze trends, signals, ratios, precious metals markets, related markets and how they perform relative to each other and the currency markets and in this way we’ll likely be able to detect market moves (especially the change in the medium-term trend in the precious metals market, which at this time remains down) much earlier than fundamental analysis would suggest.
Moving back to the above USD Index chart – the latter declined to a combination of a declining support line and the 61.8% Fibonacci retracement and it moved higher after doing so. Importantly, the USD rallied very close to the turning point, which makes it even more likely that the rally will be sustained. Still, we could see a re-test of the recent lows (95.6 or so) and it would not invalidate the bullish outlook.
Summing up, it’s likely that precious metals are starting a big decline here, and the short-term outlook deteriorated based on yesterday’s action (especially in silver) but we would like to see an additional bearish confirmation before doubling the size of the current short position in gold and silver. We expect to see it this week.
As always, we will keep you – our subscribers – updated.
To summarize:
Trading capital (our opinion): Short positions in gold and silver (half) and a short position in mining stocks (full) are justified from the risk/reward perspective with the following stop-loss orders and initial target price levels:
- Gold: initial target price: $973; stop-loss: $1,274, initial target price for the DGLD ETN: $94.27; stop-loss for the DGLD ETN $52.44
- Silver: initial target price: $12.13; stop-loss: $16.14, initial target price for the DSLV ETN: $77.53; stop-loss for DSLV ETN $42.69
- Mining stocks (price levels for the GDX ETF): initial target price: $9.34; stop-loss: $18.91, initial target price for the DUST ETF: $17.31; stop-loss for the DUST ETF $5.05
In case one wants to bet on junior mining stocks' prices (we do not suggest doing so – we think senior mining stocks are more predictable in the case of short-term trades – if one wants to do it anyway, we provide the details), here are the stop-loss details and initial target prices:
- GDXJ ETF: initial target price: $14.13; stop-loss: $25.53
- JDST ETF: initial target price: $36.46; stop-loss: $10.28
Long-term capital (our opinion): No positions
Insurance capital (our opinion): Full position
Plus, you might want to read why our stop-loss orders are usually relatively far from the current price.
Please note that a full position doesn’t mean using all of the capital for a given trade. You will find details on our thoughts on gold portfolio structuring in the Key Insights section on our website.
As a reminder – “initial target price” means exactly that – an “initial” one, it’s not a price level at which we suggest closing positions. If this becomes the case (like it did in the previous trade) we will refer to these levels as levels of exit orders (exactly as we’ve done previously). Stop-loss levels, however, are naturally not “initial”, but something that, in our opinion, might be entered as an order.
Since it is impossible to synchronize target prices and stop-loss levels for all the ETFs and ETNs with the main markets that we provide these levels for (gold, silver and mining stocks – the GDX ETF), the stop-loss levels and target prices for other ETNs and ETF (among other: UGLD, DGLD, USLV, DSLV, NUGT, DUST, JNUG, JDST) are provided as supplementary, and not as “final”. This means that if a stop-loss or a target level is reached for any of the “additional instruments” (DGLD for instance), but not for the “main instrument” (gold in this case), we will view positions in both gold and DGLD as still open and the stop-loss for DGLD would have to be moved lower. On the other hand, if gold moves to a stop-loss level but DGLD doesn’t, then we will view both positions (in gold and DGLD) as closed. In other words, since it’s not possible to be 100% certain that each related instrument moves to a given level when the underlying instrument does, we can’t provide levels that would be binding. The levels that we do provide are our best estimate of the levels that will correspond to the levels in the underlying assets, but it will be the underlying assets that one will need to focus on regarding the sings pointing to closing a given position or keeping it open. We might adjust the levels in the “additional instruments” without adjusting the levels in the “main instruments”, which will simply mean that we have improved our estimation of these levels, not that we changed our outlook on the markets. We are already working on a tool that would update these levels on a daily basis for the most popular ETFs, ETNs and individual mining stocks.
Our preferred ways to invest in and to trade gold along with the reasoning can be found in the how to buy gold section. Additionally, our preferred ETFs and ETNs can be found in our Gold & Silver ETF Ranking.
As always, we'll keep you - our subscribers - updated should our views on the market change. We will continue to send out Gold & Silver Trading Alerts on each trading day and we will send additional Alerts whenever appropriate.
The trading position presented above is the netted version of positions based on subjective signals (opinion) from your Editor, and the Tools and Indicators.
As a reminder, Gold & Silver Trading Alerts are posted before or on each trading day (we usually post them before the opening bell, but we don't promise doing that each day). If there's anything urgent, we will send you an additional small alert before posting the main one.
=====
Latest Free Trading Alerts:
Last week, the World Gold Council published a new edition of its quarterly report on gold demand. What does Gold Demand Trends Full Year 2015 say about the demand for gold in the fourth quarter of 2015 and the full year?
=====
Hand-picked precious-metals-related links:
Paulson Cut Stake in Top Gold ETF by 37% Before Rally
Did Mark Cuban and the Dow just prove Goldbugs right?
=====
In other news:
With recession lights amber, brittle markets vulnerable to all shocks
Japan Economy Minister: need more data to measure impact of negative rates
$17.5 Billion Hedge Fund Bigwig Says This Is a ‘Wall Street Recession’
Break up The Banks, Says The Fed's New Guy
China's debt mountain is growing fast
Why $100 Bills and €500 Notes May Soon Be Killed Off
Berkshire Hathaway Bets on Oil
Why Saudi Arabia's oil output freeze won't boost prices
=====
Thank you.
Sincerely,
Przemyslaw Radomski, CFA
Founder, Editor-in-chief
Gold & Silver Trading Alerts
Forex Trading Alerts
Oil Investment Updates
Oil Trading Alerts


