Briefly: In our opinion, short (full) speculative positions in gold, silver and mining stocks are justified from the risk/reward point of view.
The precious metals sector moved sharply higher and generated several new signals. What are their implications? Let’s jump right into charts (charts courtesy of http://stockcharts.com).
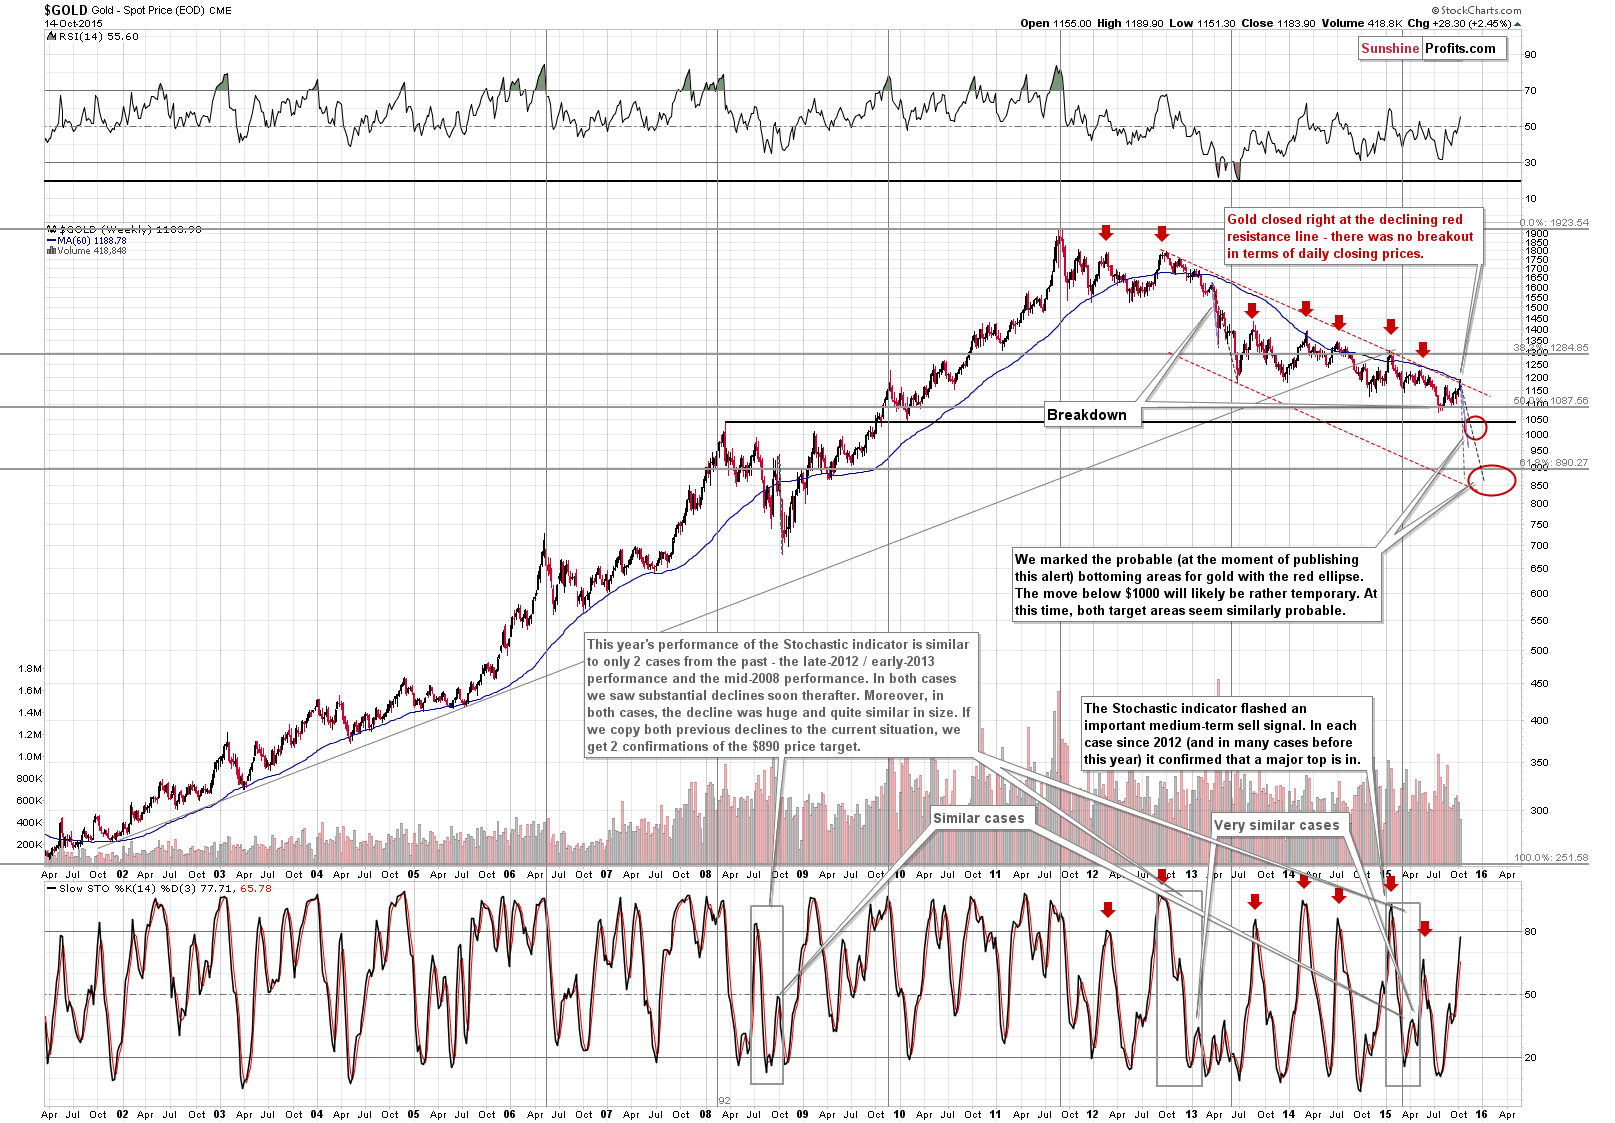
Yesterday we wrote the following:
Gold moved even closer to its August high than what we reported yesterday, but much more importantly, it moved even closer, or practically to the declining long-term red resistance line. The strength of this resistance is huge.
Please note that the Stochastic indicator is very close to the 80 level (at [77.71]) and sell signals from this indicator around this level were very often associated with important medium-term tops. It seems likely that we will see one soon.
Due to yesterday’s rally, gold is now exactly at the long-term declining red resistance line. Even though it seems that yesterday’s rally was a bullish development, reaching this important resistance level is a bearish signal. The 60-week moving average ($1,188.78) was reached yesterday on an intra-day basis. Again, without confirmed breakouts, the above are bearish signs as they suggest a reversal shortly.
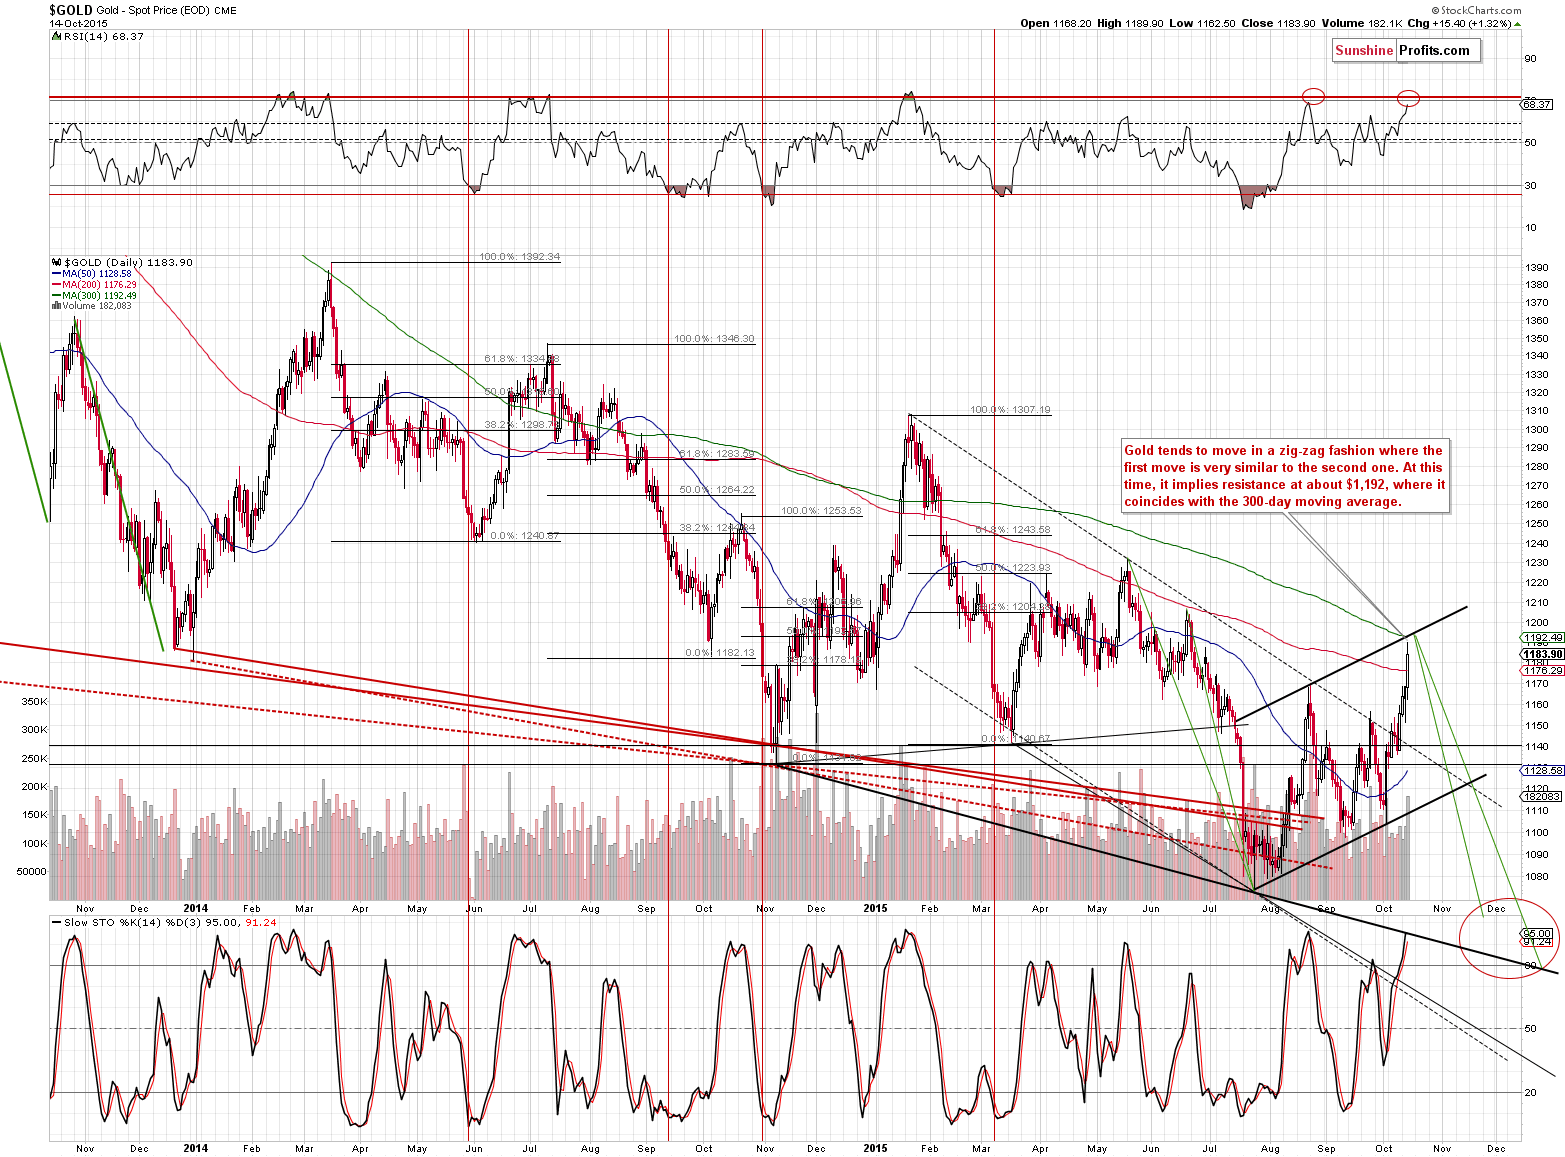
On a short-term basis, gold’s daily rally was impressive in terms of size and volume, but let’s keep in mind that when gold moved sharply higher on similar volume in the second half of September, it marked a local top.
The above chart shows that if we calculate the 60-week moving average using daily closing prices and not weekly ones (making it the 300-day moving average), we’ll get a resistance at $1,192.49. This level closely coincides with the rising black resistance line (parallel line to the line based on the July and October lows). We would not be surprised to see an intra-day move to these levels ($1,193 or so) and a daily close back below / at the long-term red resistance line (more or less the current price levels).
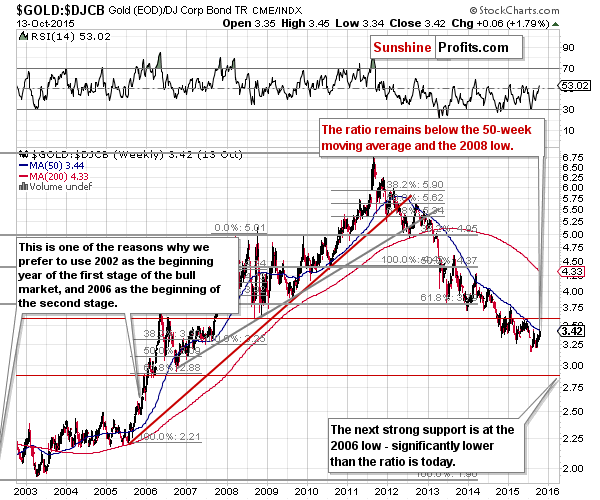
Let’s take one more look at the long-term picture – this time from the gold to bonds ratio perspective. This ratio does an excellent job at keeping one focused while at the same time smoothing out the very short-term price swings. This ratio is now telling us that the corrective upswing is likely over or very close to being over as it reached its 50-week moving average (marked on the above chart in blue). This level served as very strong resistance many times in the past and it has not been broken (except for a small rally above it in early 2014 that was invalidated shortly thereafter) since early 2012.
The gold to bonds ratio has been more or less trading sideways (declining a bit on average, though) for about a year now. That’s a big consolidation after the breakdown below the 2008 lows. Based on the length of the consolidation, it seems that the decline may now resume and that the next big move will be to the downside.
Speaking of bonds…
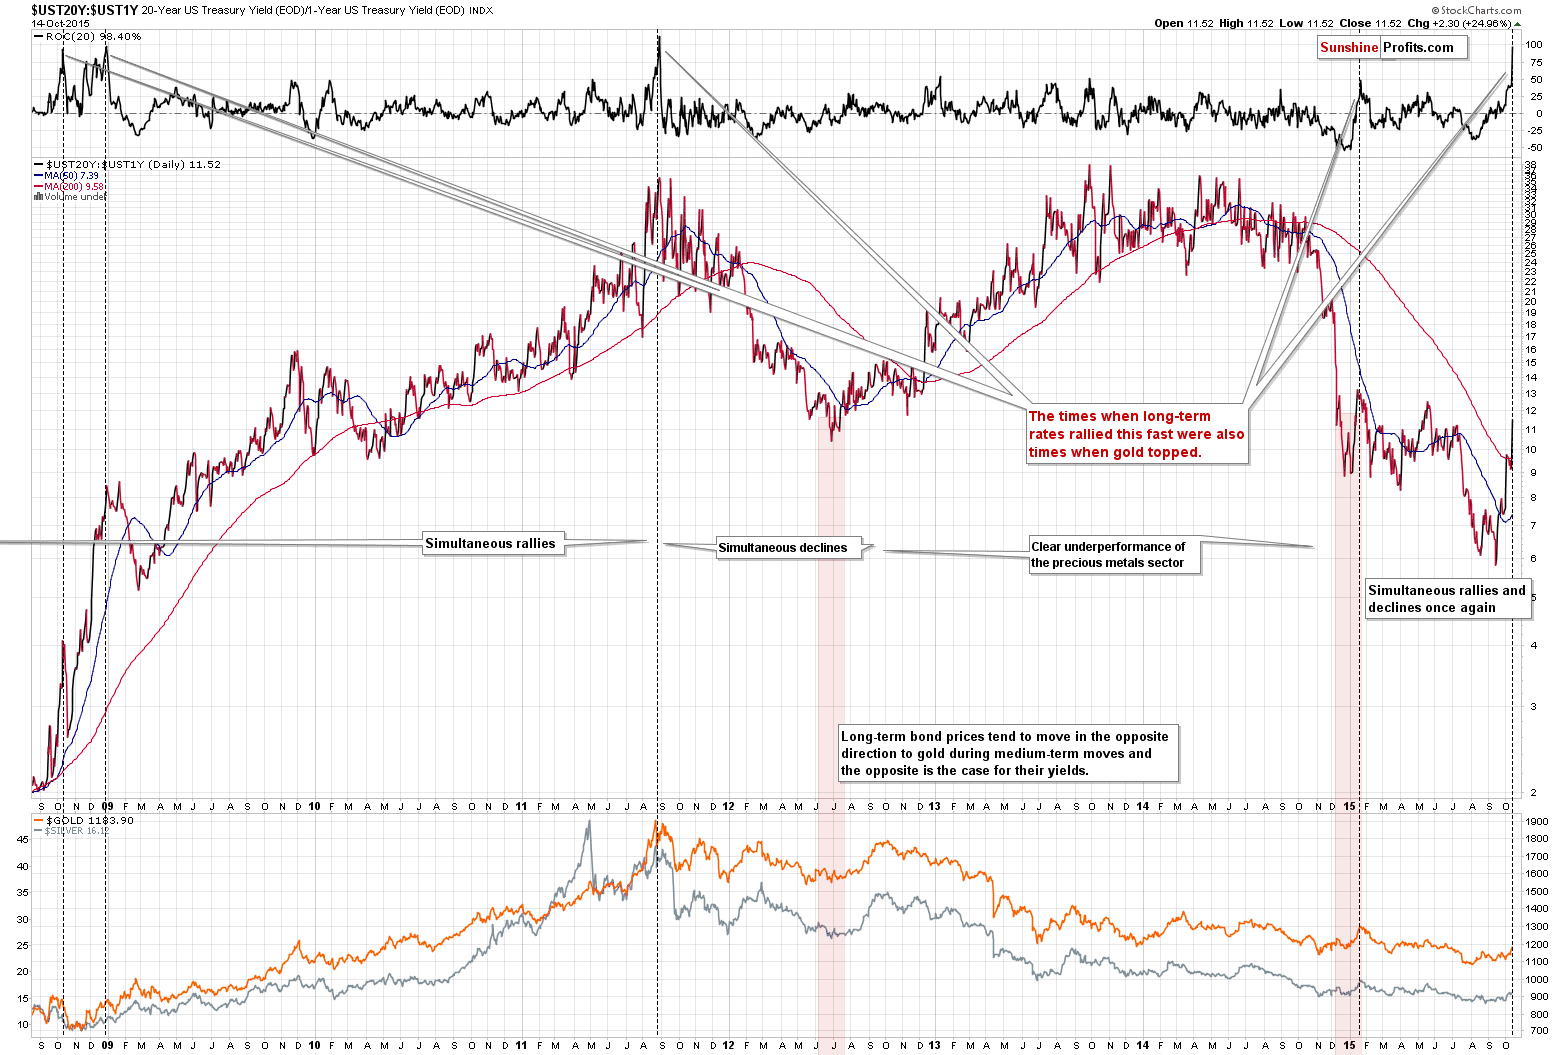
The above chart features the ratio between the yield on the 20-year bonds and the 1-year ones. It’s designed to emphasize the moves in long-term bonds.
Why analyze bonds at all while it is the precious metals market that we want to invest in? Besides the fact that all markets are somehow connected and it’s good to have an overview of more of them in order to make decisions regarding only one, there is an additional link between gold and bonds. Namely, both can be viewed as a hedge against risks – both bonds and gold are viewed as hedges against various risks. Consequently, there can be – and in fact are – similarities between both markets and at times one market can say something about the other.
We haven’t commented on the above chart in many months as there was nothing to report, but that’s one of the approximately 100 things (charts, tools etc.) that we examine each day.
The interesting thing that we can observe now in the bond market is the sharp increase in long-term yields. In the upper part of the above chart we plotted the ROC (Rate of Change) indicator to have a more detailed look at the sharpness of the move. As you can see it has indeed been significant. In the past 7 years there were 4 cases, when we saw such sharp increases. They were all (!) accompanied by tops in gold (and silver as well, but its clearer in the case of the yellow metal). Please note that the scale on the lower part of the chart is linear (not logarithmic), so the tops in 2008 were actually more significant than they appear based on the above chart alone. Moreover, please note that the 2011 high was also indicated by this signal.
We just saw it again – the ROC is almost at the 100 level, which has bearish implications for the precious metals market.
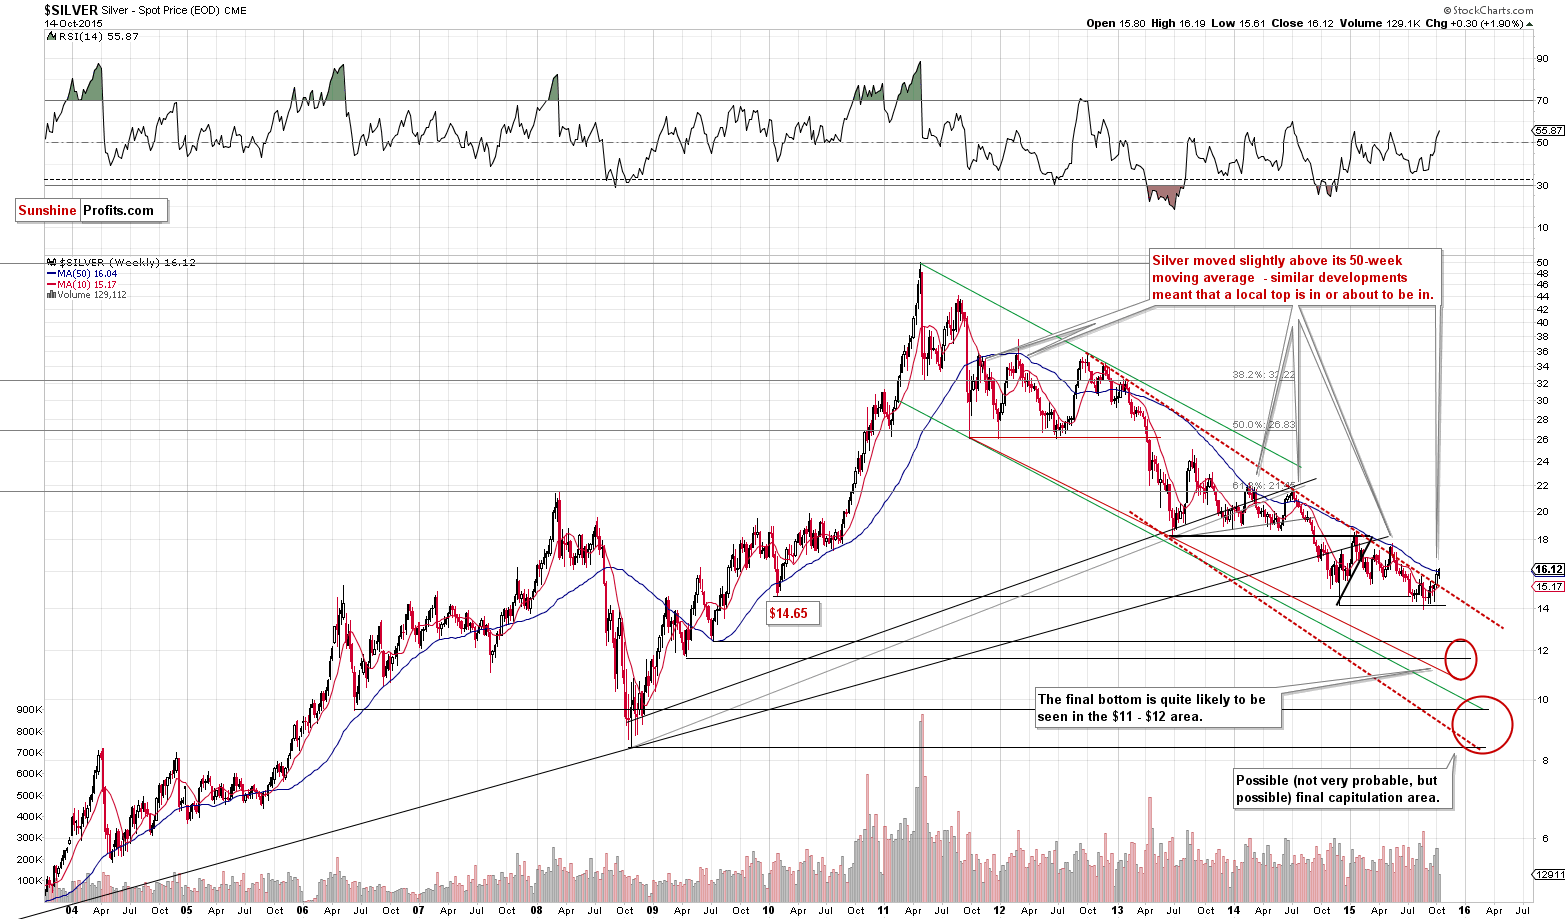
Silver’s long-term chart provides no new signals – silver is a bit above the declining red resistance line and very close to the 50-week moving average – multiple times in the past this meant that a local top was in or very close.
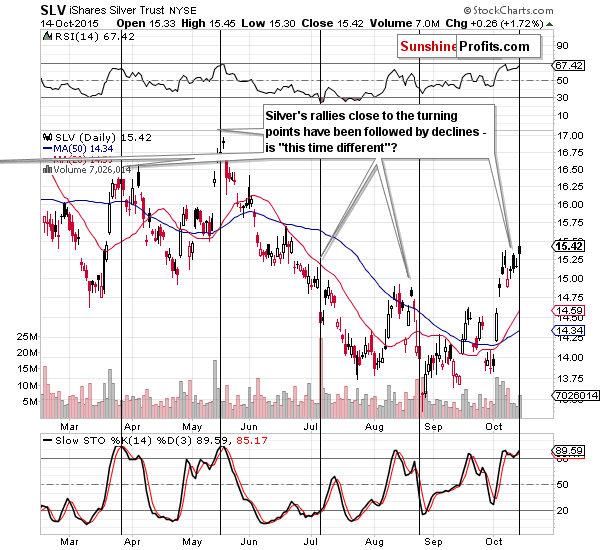
Moreover, silver’s cyclical turning point is upon us and our yesterday’s comments on silver remain up-to-date:
Silver’s cyclical turning point is just around the corner and in the recent past silver always either declined or truly plunged after these turning points. The implications are clearly bearish. The sell signal from the Stochastic indicator and RSI touching the 70 level make the outlook even more bearish.
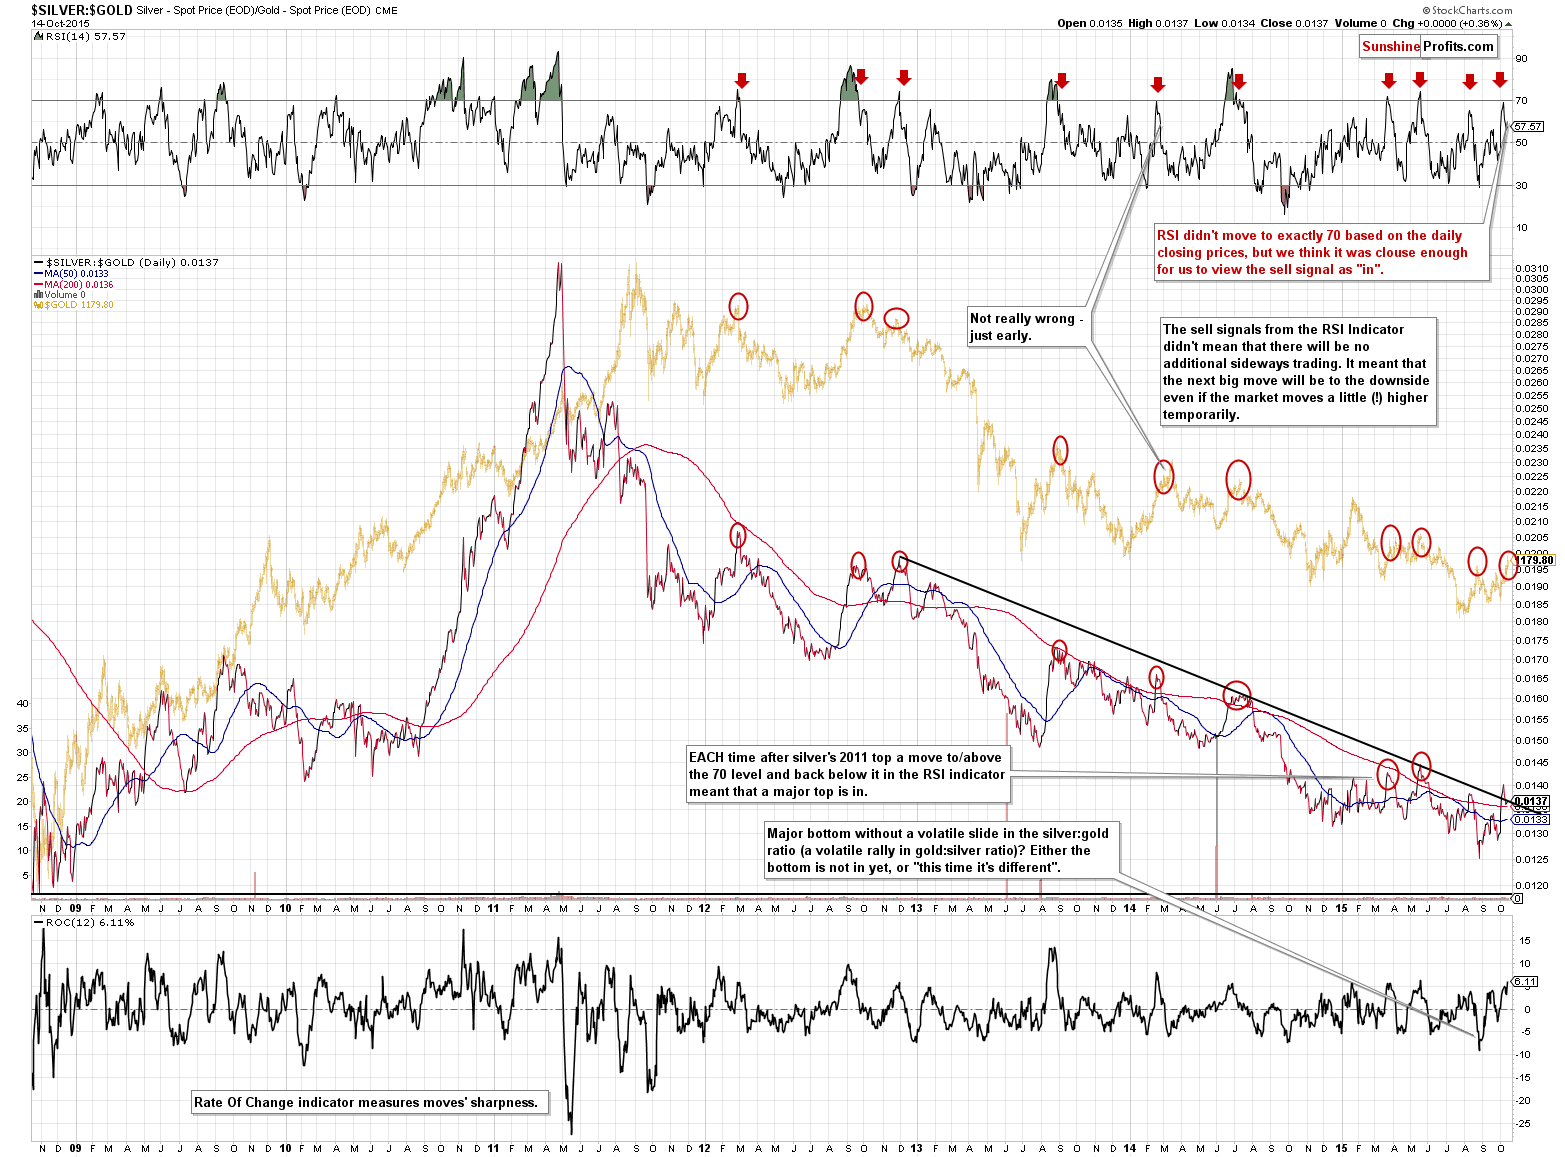
Meanwhile, the silver to gold ratio continues to have bearish implications for the entire precious metals sector as the RSI indicator based on it is declining after moving very close to the 70 level. Multiple times in the past this was seen at or right before the major tops.
The sell signal from the GDX to GLD ratio remains up-to-date as well, but let’s take a closer look at a different ratio, the mining stocks’ performance relative to other stocks:
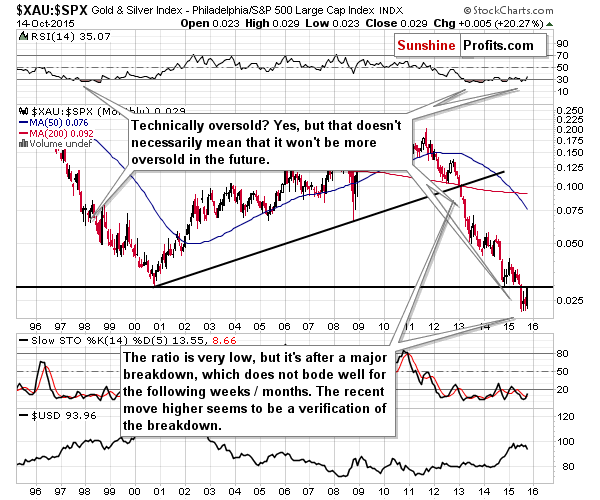
The XAU to S&P 500 ratio moved higher this month, which may seem bullish until one notices that it’s actually a post-breakdown verification and a move back to the previously broken 2000 low. The strong resistance level was reached (but not broken), so the odds are that we’ll see a decline relatively soon.
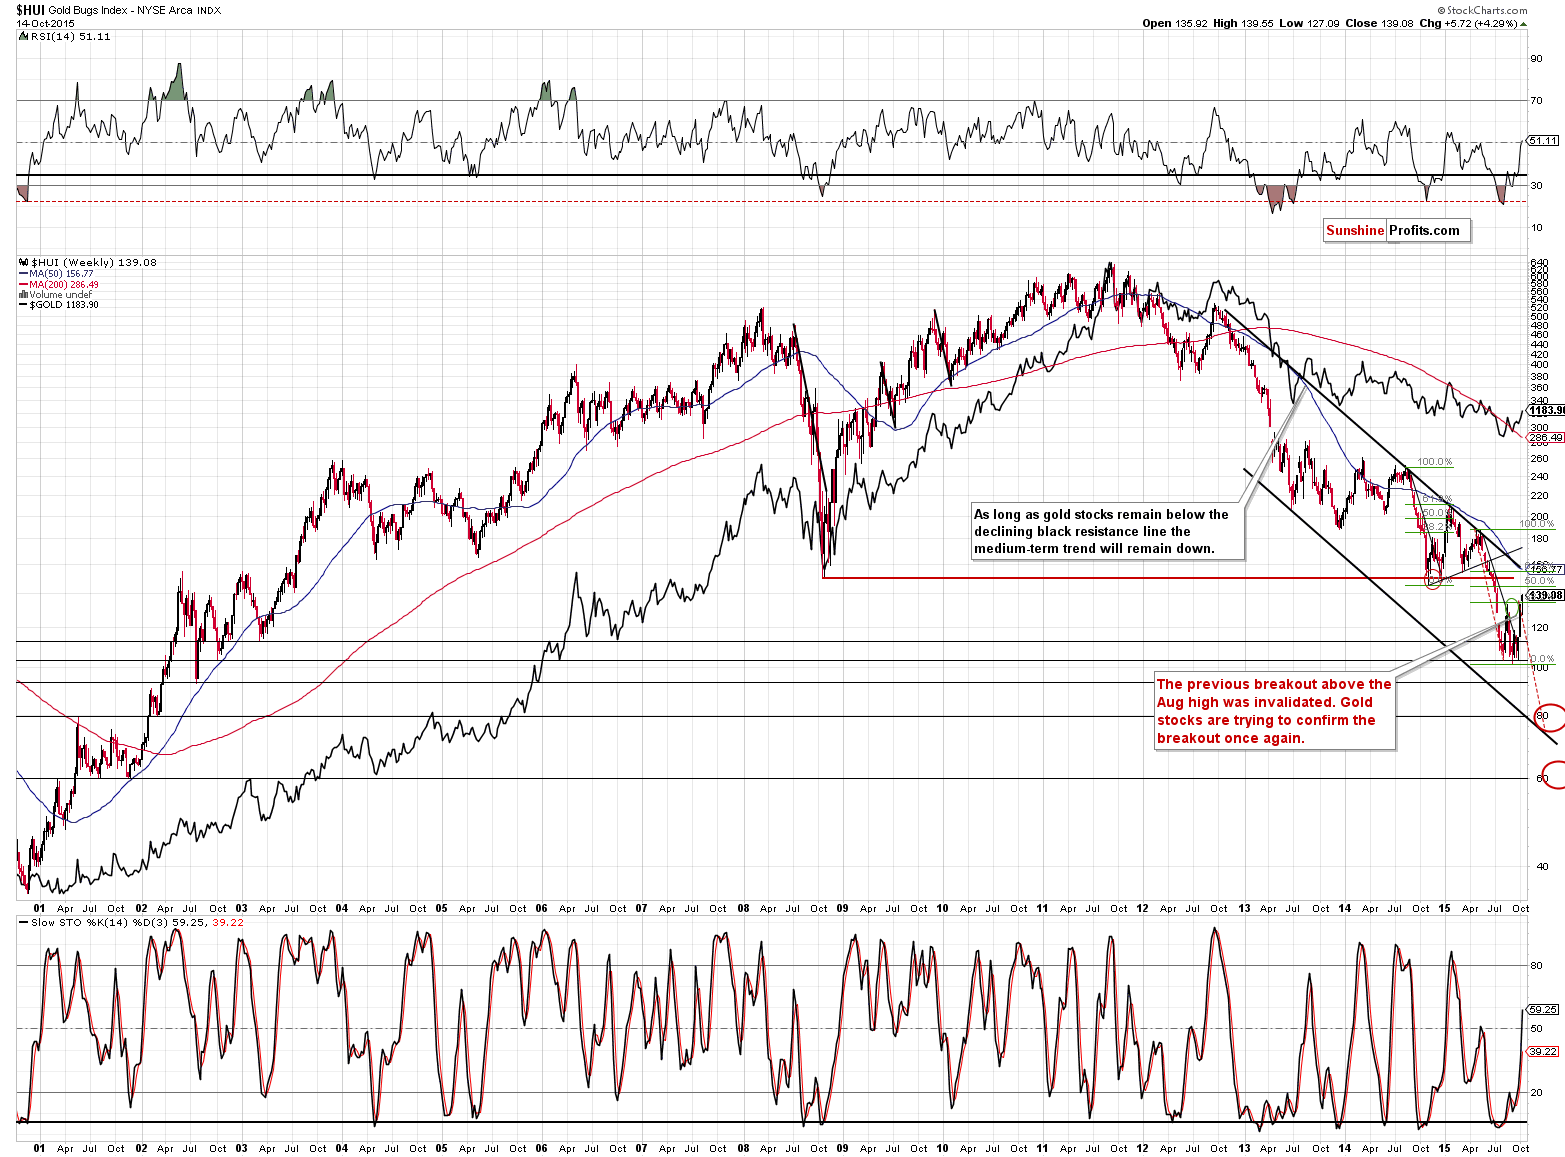
What about mining stocks themselves? The HUI Index moved once again higher and is once again trying to confirm the breakout above the August high. The previous attempt was not successful – the breakout was invalidated. Will this attempt result in much higher prices? As you can see based on the charts that we featured previously, it’s not likely and even if that were the case and the HUI Index moved to 2014 low or so, it would be very likely that the direction would be soon reversed.
The breakout itself doesn’t really have significantly bullish implications, as it was not confirmed.
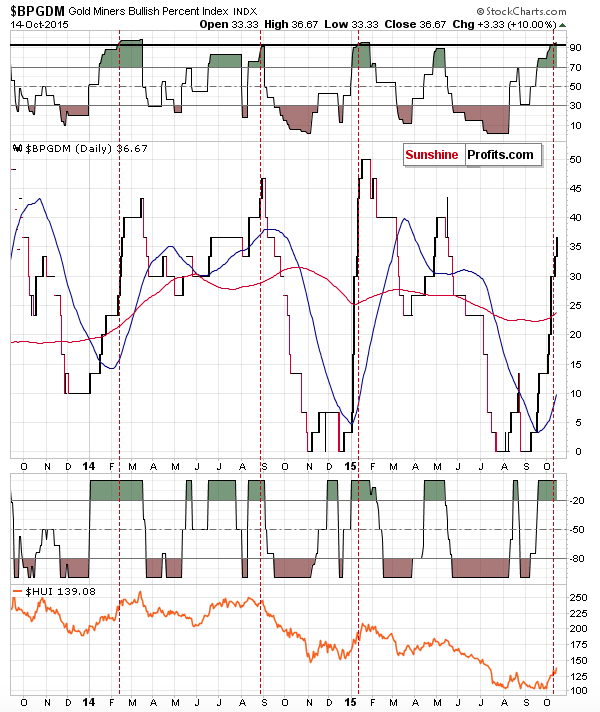
The Gold Miners’ Bullish Percent Index is also suggesting lower prices on the horizon. The RSI indicator is above 90 and similar situations were seen not necessarily at local tops, but either at them or right before them. In all cases in the recent years, it meant that the rally was over or about to be over and short positions should’ve been at least considered, not long ones.
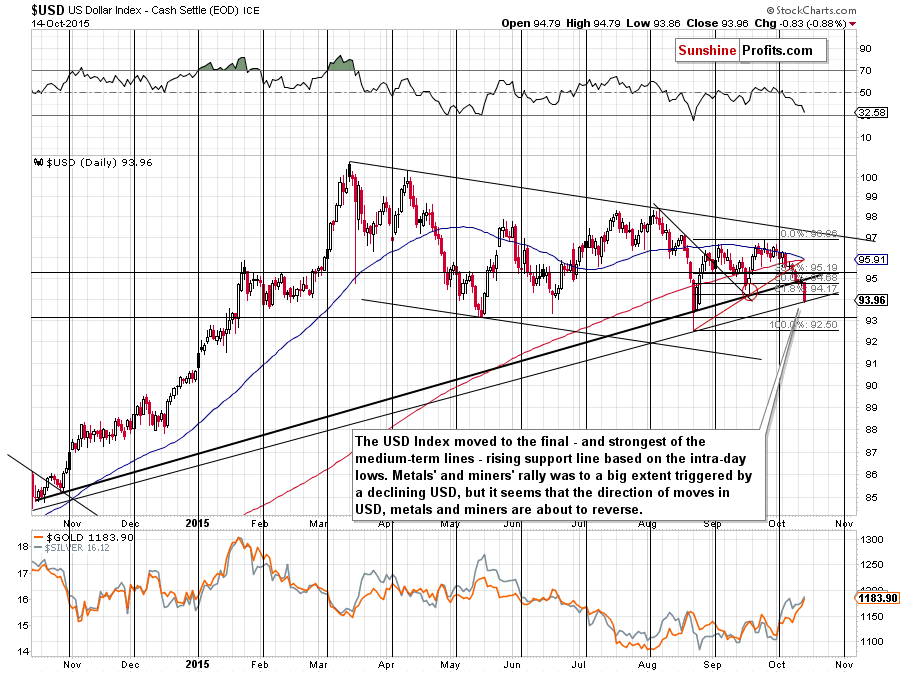
Finally, the USD Index moved below the previously mentioned support levels, but closed at the most important of the support levels that we have on the above chart – the rising support line based on the intra-day lows of October 2014 and August 2015. It’s still likely to reverse and move substantially higher in the coming weeks and – most likely – days.
Before summarizing, we would like to discuss and reply to the questions that we received.
One question is if we’re going to close the short positions and open long positions once gold moves above $1,200 or above the current stop-loss levels. The reply is that it depends on too many factors to say that in advance. When the stop-loss levels are hit, the positions will be closed. However, what we would do in such scenario depends on (and only on) the outlook. It doesn’t depend on whether a position is already held or if one considers opening it. It doesn’t depend on whether an opened position is profitable or not. It doesn’t depend on what we, you, or anybody else thought about the market a week or day ago. The only thing that is important is the current outlook. This is the approach that led us to profit on the previous $100+ decline in gold – we didn’t close the position early based on some sort of subjective profit-take level as the outlook remained negative for a long time.
The outlook depends on many things and price is just one of them – and today’s alert and the number of things that we discussed serve as a good example. So, in short, it’s not possible to tell if we will re-open the short position if it is closed or if we will open a long one when certain price levels are reached. That’s because the price is only part of the story. We don’t know what the volume would be, what the corresponding news would be, the action in general stock market, in currencies, what the investor sentiment would be, etc.
As you can see in today’s alert, there are multiple signals pointing to lower prices and some of them were actually seen because of yesterday’s rally. At this time, we are not close to changing our outlook just as there are so many things that point to lower prices and a small amount of things that point to higher ones (we don’t want to discuss the favorable long-term potential of the precious metals market here, because that’s not what drives the price in the short term – it’s a long-term factor).
The second question is how the market can move against us, if we have so many factors on our side.
In general, the reply is that… Even though it might seem to be the case based on the moves higher, it doesn’t seem that we’re wrong – after re-examining it, we think that our reasoning (as described in the previous alerts) is correct and so is our approach. The majority of those that are now profiting on higher prices have not profited on the trades that we had previously and will likely miss the following trades or even this short one (when PMs finally plunge). The only way to assess the value of the approach or strategy is over the long run, not from a one-trade perspective – and the same approach and strategy that is making us hold on to the short positions is the same approach and strategy that resulted in massive profits earlier this year. The $100+ gold decline that we profited on (you’ll find details in the summary of the July 27 alert), didn’t start immediately either – we had to be patient and this patience was very well rewarded.
Still, we think (and there are multiple reasons for it as you have read in today’s alert) that this trade continues to have good potential at this time.
We can be correct and lose money from time to time - that’s just how trading is. If we continue to do research and focus on it and not on emotions (regarding trading that is), then we’ll be making money, but that doesn’t mean there will be no temporary corrections in profits, like what we have right now. Again, we think this trade continues to have good potential at this time.
Having said that, we will prepare an exhaustive list of trades that we entered in the past 12 months and their results and we will provide it to you in the coming days.
The final question is if we continue to think that the final bottom for the precious metals market is still ahead of us. In short, the reply is “yes”. We haven’t seen confirmations that it’s in and the price levels that we expect to stop the decline haven’t been reached either.
Summing up, gold, silver and mining stocks moved visibly higher yesterday, but despite the rallies being generally a positive phenomenon, this resulted in several bearish signs that we covered in today’s alert. Based on multiple signals that we have right now, it seems that the next big move will be to the downside and being positioned to take advantage of it remains justified from the risk/reward point of view. We are moving the stop-loss levels in mining stocks and gold a bit higher based on the increased amount of sell signals (in light of which, it makes more sense to endure even additional temporary strength without closing the position).
As always, we will keep you – our subscribers – updated.
To summarize:
Trading capital (our opinion): Short position (full) position in gold, silver and mining stocks is justified from the risk/reward perspective with the following stop-loss orders and initial (! – this means that reaching them doesn’t automatically close the position) target prices:
- Gold: initial target price: $1,050; stop-loss: $1,223, initial target price for the DGLD ETN: $98.37; stop loss for the DGLD ETN $62.34
- Silver: initial target price: $12.60; stop-loss: $16.73, initial target price for the DSLV ETN: $96.67; stop loss for DSLV ETN $40.28
- Mining stocks (price levels for the GDX ETN): initial target price: $11.57; stop-loss: $18.13, initial target price for the DUST ETN: $26.61; stop loss for the DUST ETN $9.22
In case one wants to bet on junior mining stocks' prices (we do not suggest doing so – we think senior mining stocks are more predictable in the case of short-term trades – if one wants to do it anyway, we provide the details), here are the stop-loss details and initial target prices:
- GDXJ: initial target price: $16.27; stop-loss: $25.23
- JDST: initial target price: $46.47; stop-loss: $15.58
Long-term capital (our opinion): No positions
Insurance capital (our opinion): Full position
Please note that a full position doesn’t mean using all of the capital for a given trade. You will find details on our thoughts on gold portfolio structuring in the Key Insights section on our website.
As a reminder – “initial target price” means exactly that – an “initial” one, it’s not a price level at which we suggest closing positions. If this becomes the case (like it did in the previous trade) we will refer to these levels as levels of exit orders (exactly as we’ve done previously). Stop-loss levels, however, are naturally not “initial”, but something that, in our opinion, might be entered as an order.
Since it is impossible to synchronize target prices and stop-loss levels for all the ETFs and ETNs with the main markets that we provide these levels for (gold, silver and mining stocks – the GDX ETF), the stop-loss levels and target prices for other ETNs and ETF (among other: UGLD, DGLD, USLV, DSLV, NUGT, DUST, JNUG, JDST) are provided as supplementary, and not as “final”. This means that if a stop-loss or a target level is reached for any of the “additional instruments” (DGLD for instance), but not for the “main instrument” (gold in this case), we will view positions in both gold and DGLD as still open and the stop-loss for DGLD would have to be moved lower. On the other hand, if gold moves to a stop-loss level but DGLD doesn’t, then we will view both positions (in gold and DGLD) as closed. In other words, since it’s not possible to be 100% certain that each related instrument moves to a given level when the underlying instrument does, we can’t provide levels that would be binding. The levels that we do provide are our best estimate of the levels that will correspond to the levels in the underlying assets, but it will be the underlying assets that one will need to focus on regarding the sings pointing to closing a given position or keeping it open. We might adjust the levels in the “additional instruments” without adjusting the levels in the “main instruments”, which will simply mean that we have improved our estimation of these levels, not that we changed our outlook on the markets. We are already working on a tool that would update these levels on a daily basis for the most popular ETFs, ETNs and individual mining stocks.
Our preferred ways to invest in and to trade gold along with the reasoning can be found in the how to buy gold section. Additionally, our preferred ETFs and ETNs can be found in our Gold & Silver ETF Ranking.
As always, we'll keep you - our subscribers - updated should our views on the market change. We will continue to send out Gold & Silver Trading Alerts on each trading day and we will send additional Alerts whenever appropriate.
The trading position presented above is the netted version of positions based on subjective signals (opinion) from your Editor, and the Tools and Indicators.
As a reminder, Gold & Silver Trading Alerts are posted before or on each trading day (we usually post them before the opening bell, but we don't promise doing that each day). If there's anything urgent, we will send you an additional small alert before posting the main one.
=====
Latest Free Trading Alerts:
Fed officials gave several speeches this week. What can we learn from them?
Fed Speeches, Fed Speeches Everywhere
Although the Australian Bureau of Statistics showed that the number of employed people declined by 5,100 in the previous month (missing expectations for an increase of 5,000), Australia's unemployment rate remained unchanged at 6.2% in Sept. Thanks to these numbers, AUD/USD extended yesterday’s gains, erasing most of the Tuesday decline. Will we see a fresh Oct high in the coming days?
Forex Trading Alert: AUD/USD Erases Losses
=====
Hand-picked precious-metals-related links:
More Market Turmoil As Fed Experiment Ends Badly Will Drive Gold Higher - Tocqueville
LAWRIE WILLIAMS: Best Answer Yet to Great SGE Gold Withdrawals Anomaly?
Charting the Markets: Burberry and Bonds Not as Good as Gold
=====
In other news:
Dollar at two-month low as Fed easing whispers start
Fed hike more problematic for global economy than before: ECB
ECB's Nowotny Says Euro-Area Core Inflation `Clearly' Below Goal
Volkswagen Was the Final Straw for Europe Stock Forecasters
Rand must decline by 15% and more for survival of SA mining
=====
Thank you.
Sincerely,
Przemyslaw Radomski, CFA
Founder, Editor-in-chief
Gold & Silver Trading Alerts
Forex Trading Alerts
Oil Investment Updates
Oil Trading Alerts


