Briefly: In our opinion, short (full) speculative positions in gold, silver and mining stocks are justified from the risk/reward point of view.
Last week was quite volatile for precious metals, commodities, currencies and the general stock market and there are at least 2 good reasons for it – the interest rate hike by the Fed and the “quadruple witching” on Friday. Whereas the impact of the derivatives’ expiration could have been of short term meaning, the rate hike should not be ignored. Consequently, last week’s price movement can tell us quite a lot about the next move in the precious metals sector.
As a reminder, “quadruple witching” is a phrase that means that 4 different types of derivatives expire (three related classes of options and futures contracts expire, along with individual stock futures options) on this day and many market participants want to push the prices on this day to exit their positions at favorable prices.
Having said that, let’s jump right into charts (charts courtesy of http://stockcharts.com).
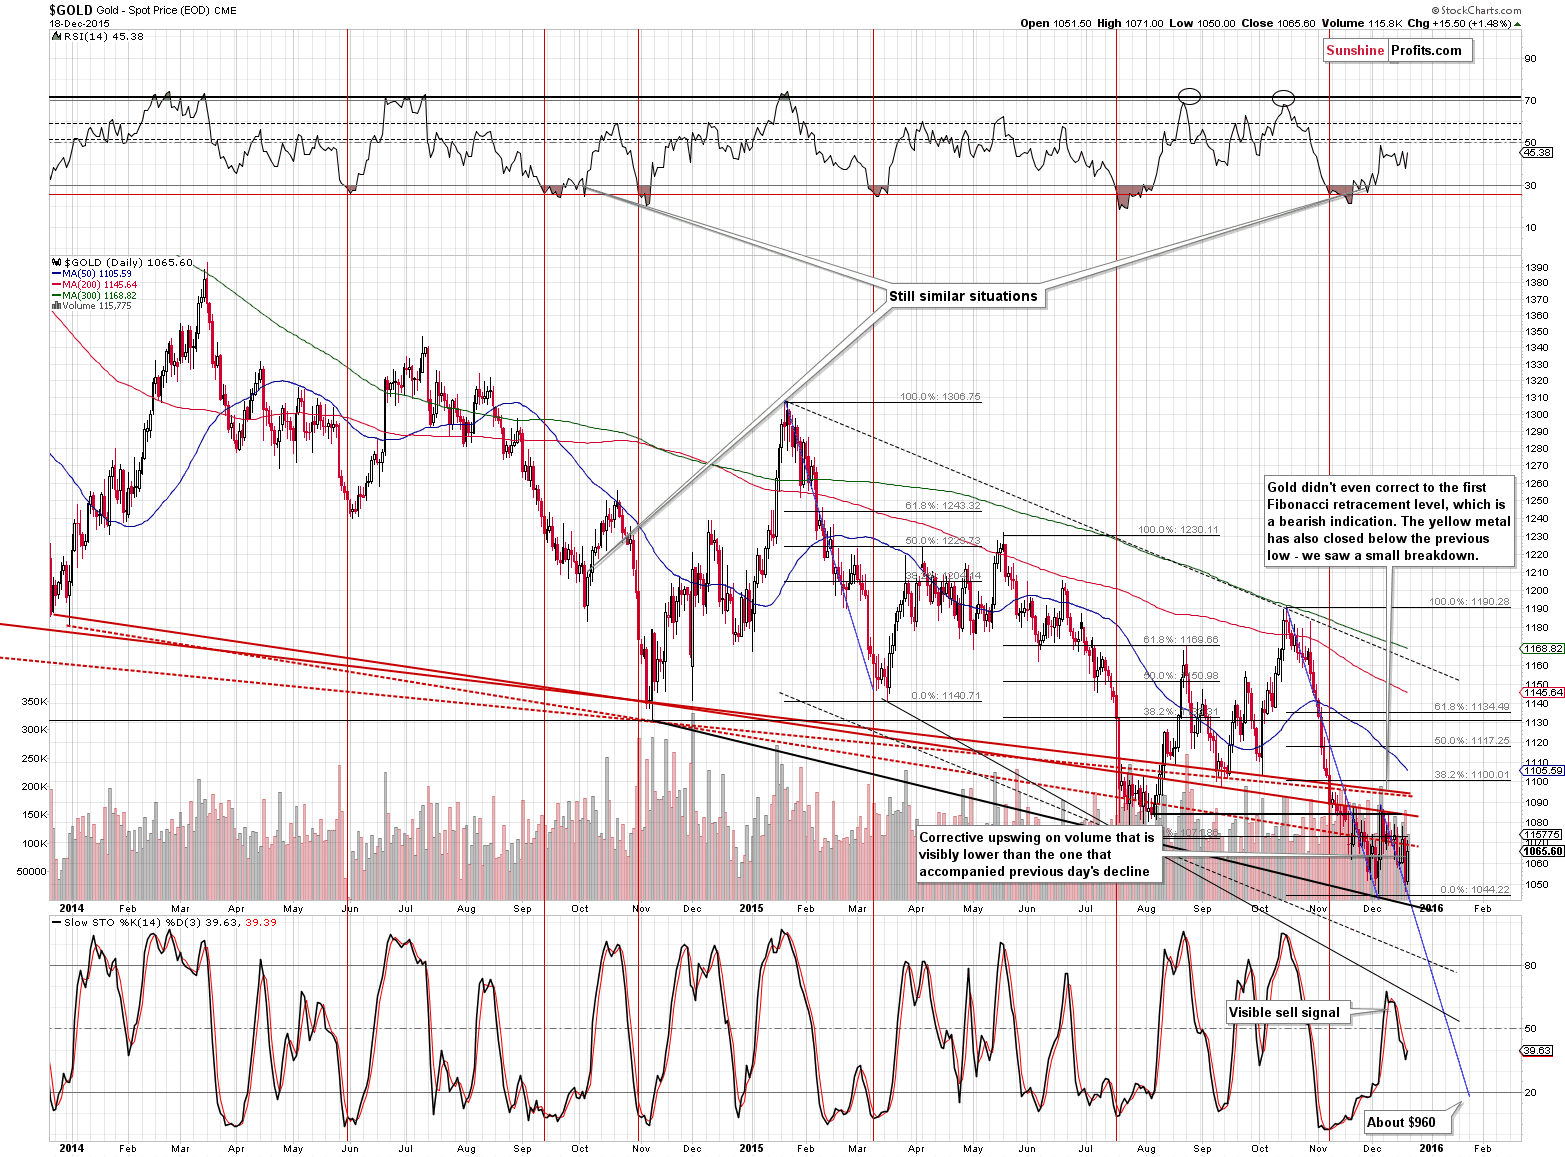
In our Friday alert we wrote the following:
Gold moved decisively lower and the move as accompanied by significant volume. The move was big enough to take gold to new lows – the yellow metal closed the day a few dollars below the previous low. The implications are bearish.
How low can gold go? As we described in Tuesday’s alert, the next target is at about $960:
(…) please note that gold often moves in a zigzag fashion and the first part of the decline is equal or very similar to the second part. If the corrective upswing is indeed over and gold is likely to decline by as much (percentagewise) as it did before the upswing, then we might see it decline to $960 or so before the next wave down is over. Would this be the final bottom? It’s possible, but it’s not certain – a lot depends on the number of confirmations that we see when gold moves that low.
If the current slide (the one that has just begun) is similar to the one that we saw in the first half of 2013, then $960 is justified also from this perspective – if the initial decline is currently as big as the initial decline in 2013, we should see gold at $960 and we are likely to see it there soon.
The above remains up-to-date despite gold’s move higher on Friday. As mentioned earlier, Friday’s move was not meaningful because of the “quadruple witching” which could have made the move artificial. Moreover, the volume that accompanied the move to the upside was smaller than what we had seen previously. Consequently, the outlook remains bearish.
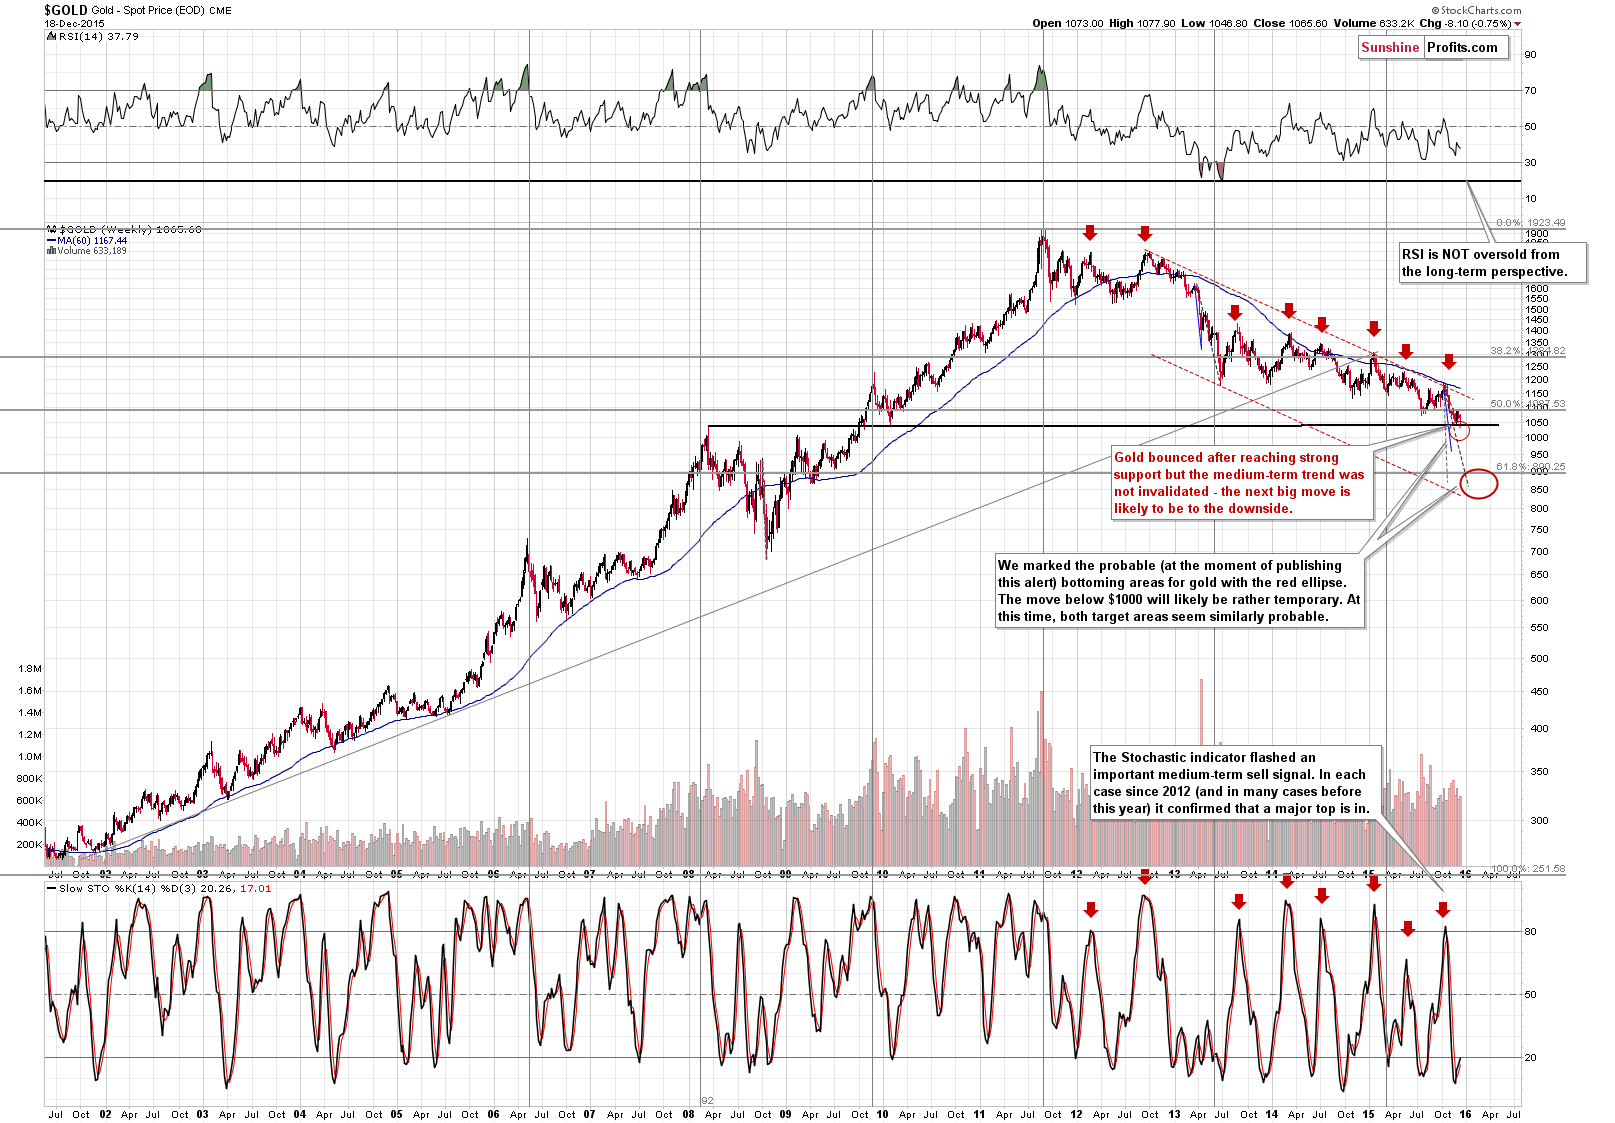
On the long-term chart, we see the illustration of the above-described analogy to the 2013 decline – if the sizes of the initial big declines are similar, then we can expect gold to move to $960 initially.
Please note that we have recently seen a buy signal from the weekly Stochastic indicator – something that was usually followed by higher prices. In our opinion, this is not very bullish at this time and the reason is that we already saw a small move higher recently and because if the analogy to 2013 is indeed in place, then the buy signal is not really reliable – back then we saw very similar signals and all they indicated were pauses within a big slide.
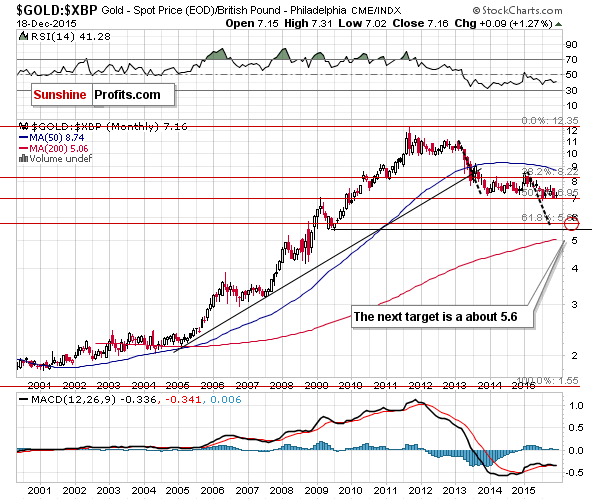
Nothing changed on the above chart featuring gold priced in the British pound, but we decided to feature it once again as the implications are very meaningful as far as the direction and size of the next major move are concerned.
While we usually don’t include all the charts that we monitor on a daily basis (it’s not possible as there are about 100 of them, plus the majority of them doesn’t feature any changes on a daily basis), today we decided to include the chart featuring the price of gold in terms of the British pound. Why did we do so? Because it shows that gold is on a verge of breaking lower and once it does, the following slide is going to be significant – something like what we saw in the first half of 2013.
Gold is about to move below the 50% Fibonacci retracement level, which worked so well as support in the previous months and years. The next major support is created by the 2009 low and the 61.8% Fibonacci retracement.
Gold has been consolidating for many months and after the breakdown we can expect gold to decline in a way similar to the move that preceded the consolidation – the 2013 decline. This confirms the mentioned price targets and we can expect the above ratio to slide to 5.5 – 5.6 before the final bottom is in.
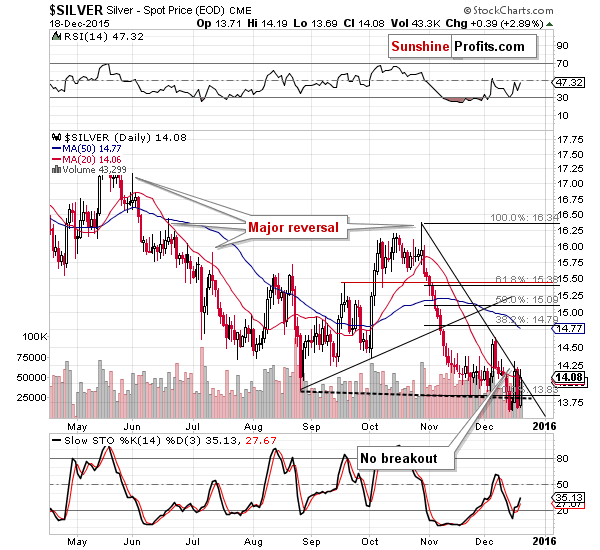
Silver has once again moved higher, but it once again wasn’t able to break below the declining resistance line. Consequently, there are no meaningful bullish implications of Friday’s move higher, especially in light of the “quadruple witching”. Moreover, please note that it’s not uncommon for silver to move lower after a short-term double-top formation and August 2015 serves as a good example.
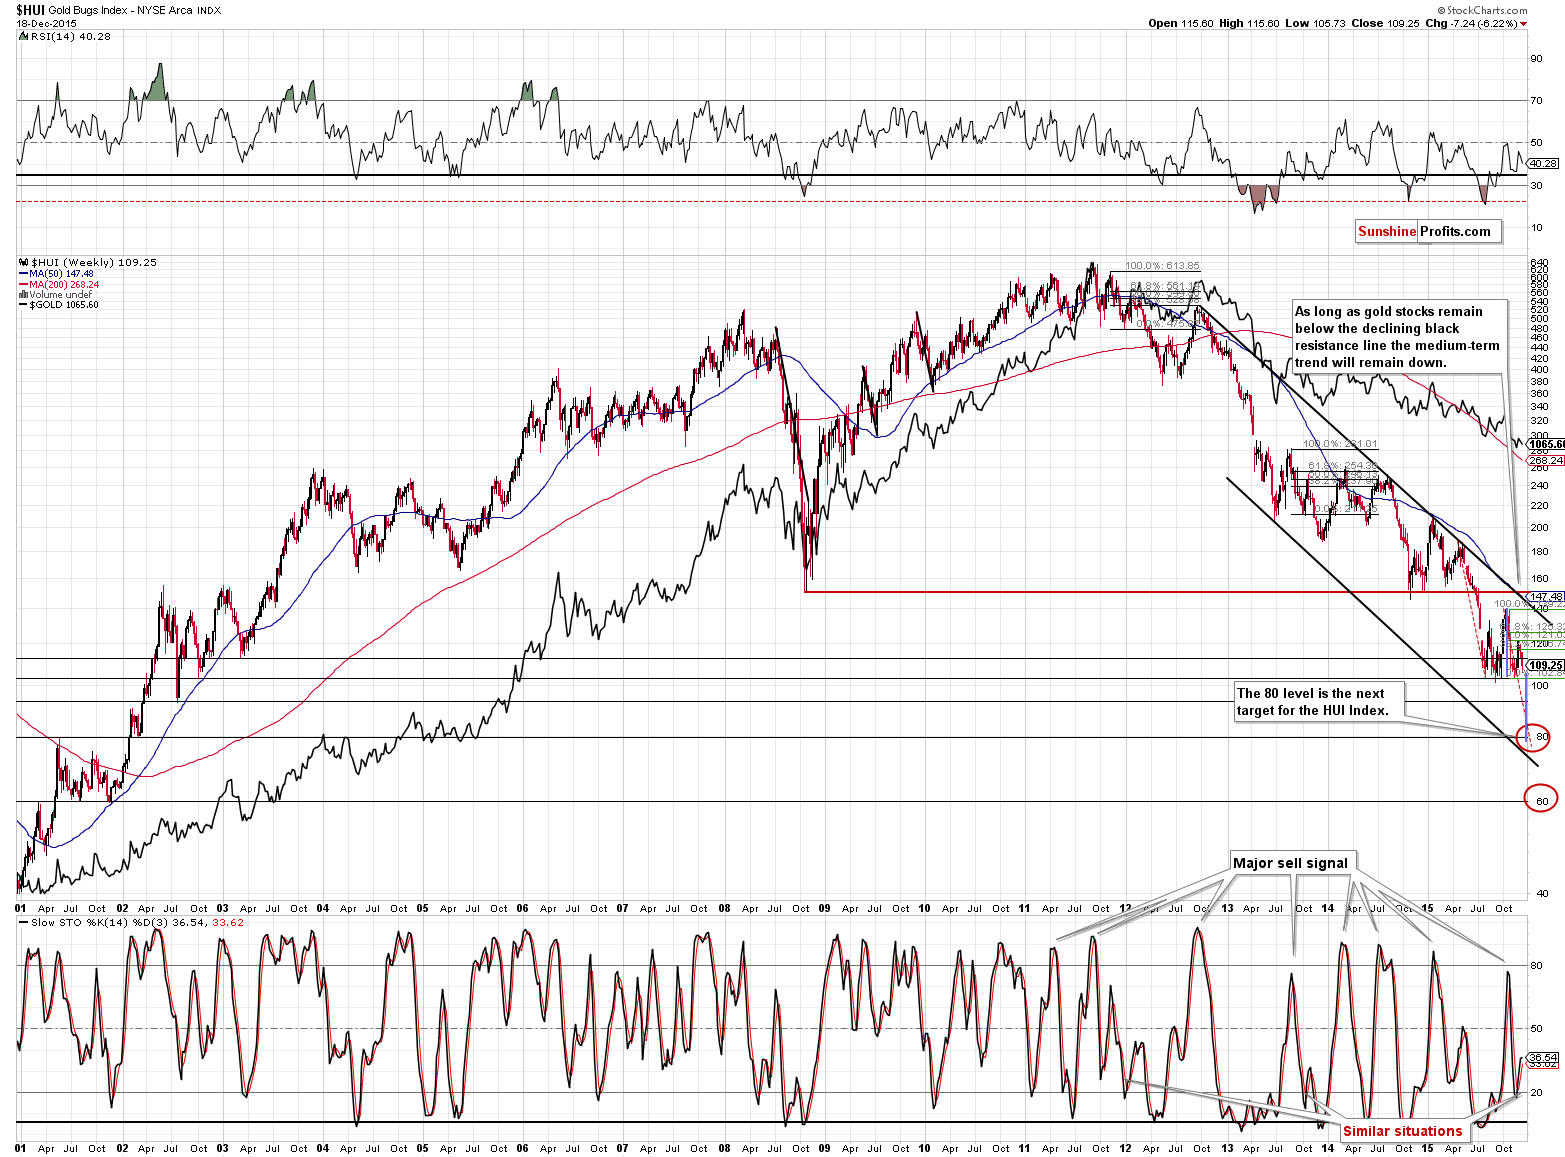
As far as the situation in the HUI Index is concerned, not much changed from the long-term perspective on Friday and our previous comments remain up-to-date:
The HUI Index moved visibly lower and it’s about to create a bearish head-and-shoulders pattern. The target based on this formation is the 80 level, which was our next interim target anyway based on the early 2002 low and other calculations (the gold price target and the gold stocks to gold ratio analysis). Consequently, this target is even more likely to really hold the decline (at least for some time). Please note that there is also another level to which gold stocks could decline – the 60 level.
It seems unrealistic – we know – but did 106 seem realistic when the HUI was trading above 600 just a few years ago? The fundamental outlook for the precious metals market remains bullish in our view, but that doesn’t change anything (!) regarding the short term or even the medium term, given a strong downtrend. Markets are logical only in the long run, and emotional in the short run. Consequently, it is possible for the HUI Index to become even more oversold than it is right now before the final bottom is in.
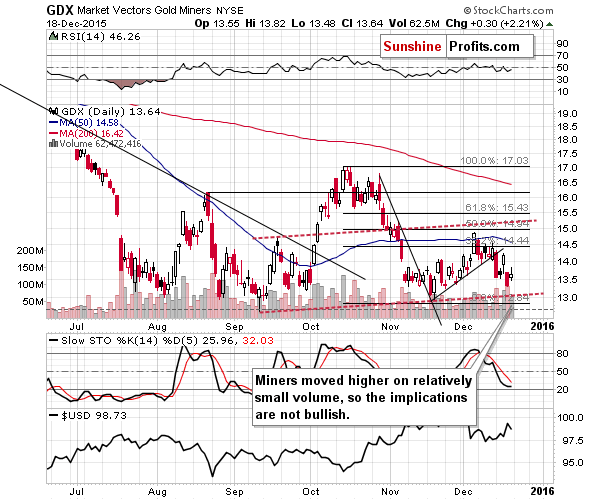
As far as the short-term picture is concerned, we have a small bearish indication for mining stocks (the GDX ETF includes both gold and silver stocks) – the same we saw for gold. Miners moved higher on lower volume, which suggests that Friday’s move was a corrective upswing, whereas Thursday’s slide was the move in tune with the current trend. The implications are bearish.
Let’s move back to the gold stocks’ proxy – the HUI Index. Let’s examine the True Seasonal tendencies for this market (True Seasonality, unlike regular seasonal tendencies takes into account the effect that the derivatives’ expiration is likely to have on the market; you’ll find more details here: report, video).
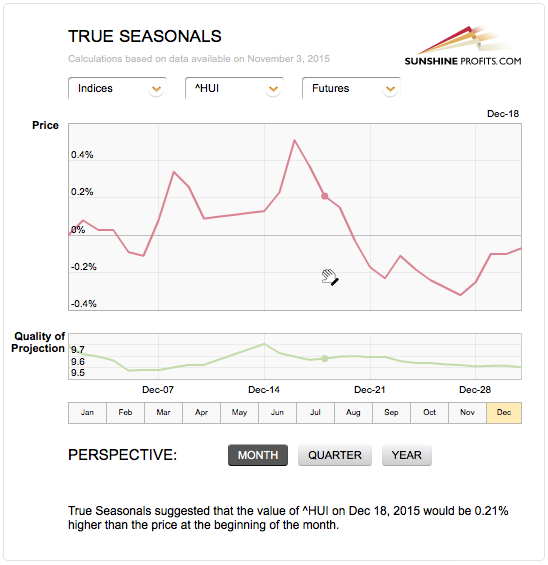
The charts that we feature in today’s alert are based on Friday’s (Dec. 18) closing prices. We marked Dec 18 on the above chart with a small dot. While the first half of the month tends to be somewhat positive for gold stocks, the second half is not that positive. This month we saw a sharp rally at the beginning of the month (a bit earlier than usually in December), but nonetheless we are in the second half, in which gold miners are likely to decline. Please note that the majority of declines usually take place after Dec. 18, so the implications are bearish. Of course, this does not guarantee an immediate plunge, but it does indicate that a move lower is more probable than an upswing also from the True Seasonal point of view.
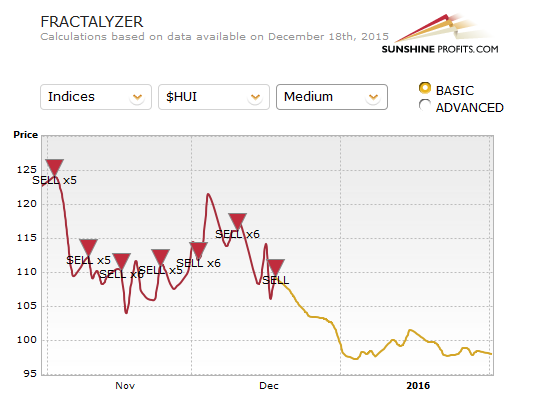
Our other tool – Fractalyzer – dedicated to detecting and taking advantage of self-similar patterns is pointing to lower prices. In short, Fractalyzer looks for patterns that are similar to what we’ve seen recently, checks what happened in the past after these similar patterns and then averages out the following action and provides it as a price projection (more info: video). The golden line is the mentioned projected price path and it indicates much lower prices in the coming days and weeks.
Please note that the more distant the projection, the less clear it is. Consequently, the above does not rule out a move to the 80 level, as we described earlier in today’s alert.
Before moving to another technical chart, please note that there were only sell signals in the past few months (red triangles on the above chart), but that doesn’t mean that this is the only signal that the Fractalyzer ever provides.
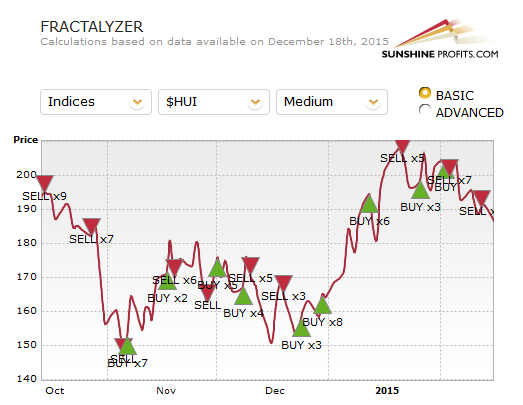
Back in November and December 2014, the Fractalyzer flashed buy signals before and during rallies in the HUI Index. After that time there were only sell signals – and we now know (after seeing the miners’ performance in 2015) that it was a quite good approach. The odds are that the current bearish signal is useful once again.
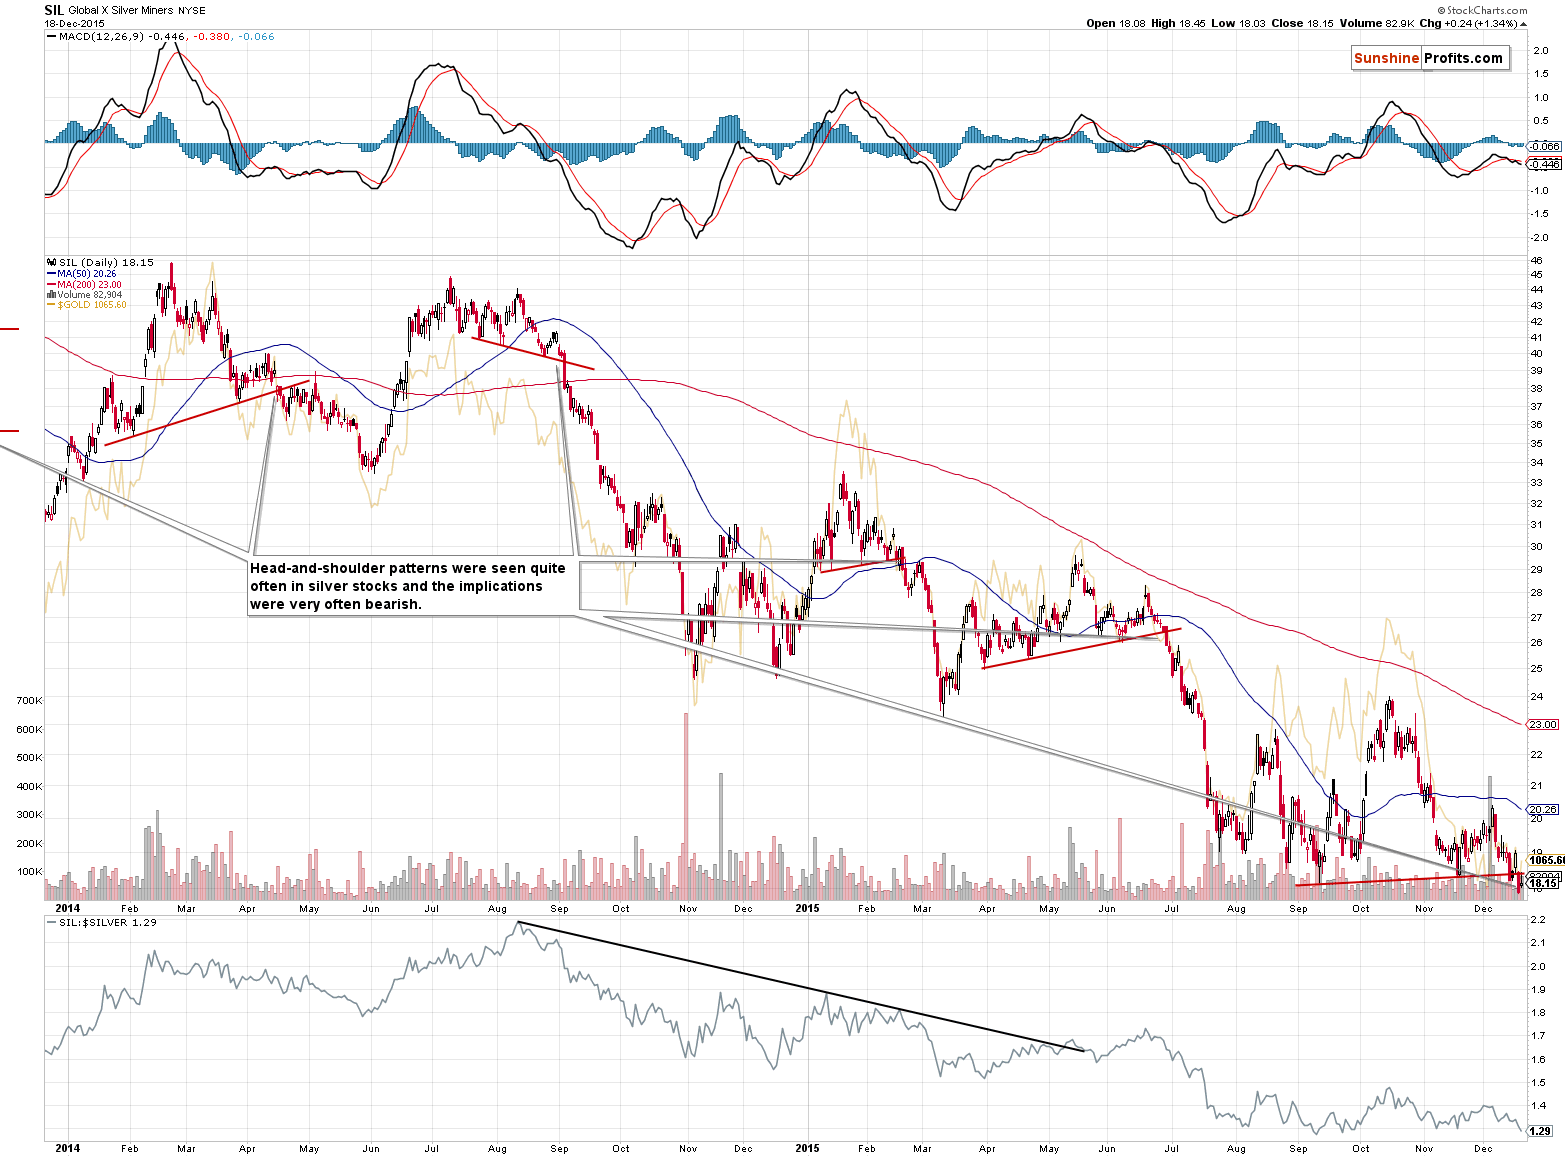
Before summarizing, we would like to discuss the situation in part of the mining stocks sector – in silver stocks. Silver miners are currently suggesting much lower prices – also for the rest of the precious metals sector, since all parts of the sector usually move together during major moves.
The SIL ETF move well below the previous lows on Thursday and it didn’t move back above them on Friday. Silver stocks closed the week at new lows, which is a major development, especially in light of silver’s daily upswing on Friday.
Moreover, please note that silver stocks just broke below the neck level of the bearish head-and-shoulders formation and that’s something that we’ve seen many times in the past. Previously, these breakdowns were followed by lower prices, so we can expect the same outcome also this time.
We would also like to comment on one additional thing – the Commitment of Traders report as we received many questions about it over the weekend. In particular we were asked to comment on this article.
In our opinion, the CoT is a short-term indication only and if we are on a brink of another medium-term decline, then it doesn’t matter that much that it’s pointing to higher prices. The numbers presented in the CoT report are usually a mirror image of gold prices. Speculative gold shorts are already close to all-time nominal highs and hitting new percentage highs, and to some this may suggest that gold shorts are exhausted and that higher prices are to be expected. We disagree that it has to work this way. Since the CoT numbers are, to a great extent, a reflection of gold prices, new nominal highs are a reflection of… new nominal lows in gold (on a side note, it’s not a coincidence that we are hearing more about the CoT numbers with gold’s each new low). Is the situation in gold bullish just because of new nominal lows? No.
Moreover, in the mentioned article, please take a look at the chart titled “The Hedgers” and focus on what happened in the first half of 2013 after the last small corrective upswing before the major plunge - the same thing that’s happening now - the indicator is at the green line. This may be a bullish short-term sign, but it’s not that relevant given the medium-term sell signals.
While were at it… Please take a look at gold’s 1-year chart and note the price-volume link in the circled areas. In the past 3 cases the volume was high during daily upswings and low during daily downswings. The opposite is the case now. Previously the implications were bullish, but now they are bearish.
Gold’s 7-year chart - OK, gold moved to a support line, but it moved below several other support lines and previous lows. The “suspected falling wedge” would become bullish only after a breakout above its upper border (well above $1,150) and right now gold is at its lower border. If it breaks below it, the following move to the downside is likely to be significant.
Also, if one creates support lines that would have been seen in the past based on the 2013 low and other local lows in gold, then each of these support lines would have been broken to the downside before a corrective upswing. A slide to $960 or so would fit nicely into this analogy.
The USD chart - the USD might be forming a double top, but this chart doesn’t show why this would be likely.
The most bearish thing is that we haven’t seen confirmations of the final bottom. Given that the medium-term trend remains down, the big moves are likely to be to the downside. After the rate hike, a lot of uncertainty is gone and trends are likely to be resumed. This is not bullish, but bearish.
All in all, Mr. Maund’s article doesn’t change our position on the precious metals market (we respect Mr. Maund’s work, even though we currently disagree with his position).
Summing up, Thursday’s session confirmed that the “next” big slide is already underway and Friday’s move higher doesn’t seem to have changed much. It seems that the profits on the current speculative short position will become much bigger – after all our target of $960 in gold is well below the current market price and if the analogy to the 2013 slide is indeed in place, then we will likely not have to wait long before this level is reached. Since the situation clarified in the past several days, we think it’s justified to move the stop-loss levels for silver a bit higher, so that a temporary small move higher (which could still take place) doesn’t take us automatically out of the positions.
The upcoming year will likely start with major events in the precious metals world and paying extra attention to this market for the first few months should prove well worth it.
As always, we will keep you – our subscribers – updated.
To summarize:
Trading capital (our opinion): Short positions (full) in gold, silver and mining stocks are justified from the risk/reward perspective with the following stop-loss orders and initial target price levels:
- Gold: initial target price: $973; stop-loss: $1,107, initial target price for the DGLD ETN: $117.70; stop-loss for the DGLD ETN $81.84
- Silver: initial target price: $12.13; stop-loss: $14.83, initial target price for the DSLV ETN: $101.84; stop-loss for DSLV ETN $57.49
- Mining stocks (price levels for the GDX ETF): initial target price: $10.23; stop-loss: $15.47, initial target price for the DUST ETF: $31.90; stop-loss for the DUST ETF $10.61
In case one wants to bet on junior mining stocks' prices (we do not suggest doing so – we think senior mining stocks are more predictable in the case of short-term trades – if one wants to do it anyway, we provide the details), here are the stop-loss details and initial target prices:
- GDXJ ETF: initial target price: $15.23; stop-loss: $21.13
- JDST ETF: initial target price: $52.99; stop-loss: $21.59
Long-term capital (our opinion): No positions
Insurance capital (our opinion): Full position
Plus, you might want to read why our stop-loss orders are usually relatively far from the current price.
Please note that a full position doesn’t mean using all of the capital for a given trade. You will find details on our thoughts on gold portfolio structuring in the Key Insights section on our website.
As a reminder – “initial target price” means exactly that – an “initial” one, it’s not a price level at which we suggest closing positions. If this becomes the case (like it did in the previous trade) we will refer to these levels as levels of exit orders (exactly as we’ve done previously). Stop-loss levels, however, are naturally not “initial”, but something that, in our opinion, might be entered as an order.
Since it is impossible to synchronize target prices and stop-loss levels for all the ETFs and ETNs with the main markets that we provide these levels for (gold, silver and mining stocks – the GDX ETF), the stop-loss levels and target prices for other ETNs and ETF (among other: UGLD, DGLD, USLV, DSLV, NUGT, DUST, JNUG, JDST) are provided as supplementary, and not as “final”. This means that if a stop-loss or a target level is reached for any of the “additional instruments” (DGLD for instance), but not for the “main instrument” (gold in this case), we will view positions in both gold and DGLD as still open and the stop-loss for DGLD would have to be moved lower. On the other hand, if gold moves to a stop-loss level but DGLD doesn’t, then we will view both positions (in gold and DGLD) as closed. In other words, since it’s not possible to be 100% certain that each related instrument moves to a given level when the underlying instrument does, we can’t provide levels that would be binding. The levels that we do provide are our best estimate of the levels that will correspond to the levels in the underlying assets, but it will be the underlying assets that one will need to focus on regarding the sings pointing to closing a given position or keeping it open. We might adjust the levels in the “additional instruments” without adjusting the levels in the “main instruments”, which will simply mean that we have improved our estimation of these levels, not that we changed our outlook on the markets. We are already working on a tool that would update these levels on a daily basis for the most popular ETFs, ETNs and individual mining stocks.
Our preferred ways to invest in and to trade gold along with the reasoning can be found in the how to buy gold section. Additionally, our preferred ETFs and ETNs can be found in our Gold & Silver ETF Ranking.
As always, we'll keep you - our subscribers - updated should our views on the market change. We will continue to send out Gold & Silver Trading Alerts on each trading day and we will send additional Alerts whenever appropriate.
The trading position presented above is the netted version of positions based on subjective signals (opinion) from your Editor, and the Tools and Indicators.
As a reminder, Gold & Silver Trading Alerts are posted before or on each trading day (we usually post them before the opening bell, but we don't promise doing that each day). If there's anything urgent, we will send you an additional small alert before posting the main one.
=====
Latest Free Trading Alerts:
The recent U.S. economic data, especially concerning the manufacturing sector, is worrisome. What does it imply for the gold market?
Is Recent U.S. Economic Data Positive for Gold?
S&P 500 index got closer to 2,000 mark on Friday, as it continued its short-term downtrend. Will this sell-off continue? The broad stock market sits at medium-term support level.
Stock Trading Alert: Positive Expectations Following Last Week's Sell-off, But Will It Last?
=====
Hand-picked precious-metals-related links:
Technician: As clouds gather, a 'perfect storm' brews for gold
Gold Speculators Cut Net Bullish Positions Last Week
=====
In other news:
Yellen will 'go down in infamy': SocGen bear
Yellen, Bull Markets and Extinction in a Seven-Year Stock Rally
Nine Signposts for Navigating Market Volatility
This is what will happen when U.S. oil producers start to export
China to keep economic policies accommodative in 2016: source
Investors on edge: Brazil to scale back austerity?
DEUTSCHE BANK: Here's why the US dollar will continue to rally
Why Inflation May Overrun the Fed
Azerbaijan adopts floating manat rate
=====
Thank you.
Sincerely,
Przemyslaw Radomski, CFA
Founder, Editor-in-chief
Gold & Silver Trading Alerts
Forex Trading Alerts
Oil Investment Updates
Oil Trading Alerts


