Briefly: No speculative positions in gold, silver and mining stocks are justified from the risk/reward perspective. We are expecting to be back in the short positions relatively soon, but not yet at this time.
In the previous alert we wrote that it was likely that metals and miners would move higher before forming another local top and we didn’t have to wait long for this to become reality. Gold, silver and mining stocks rallied strongly yesterday and gold even reached the upper part of our previous target area – is the top in?
In short, that’s possible, but we have seen to few confirmations to say that this is very likely and thus we are not taking a position just yet.
Let’s take a look at the charts for details (charts courtesy of http://stockcharts.com).
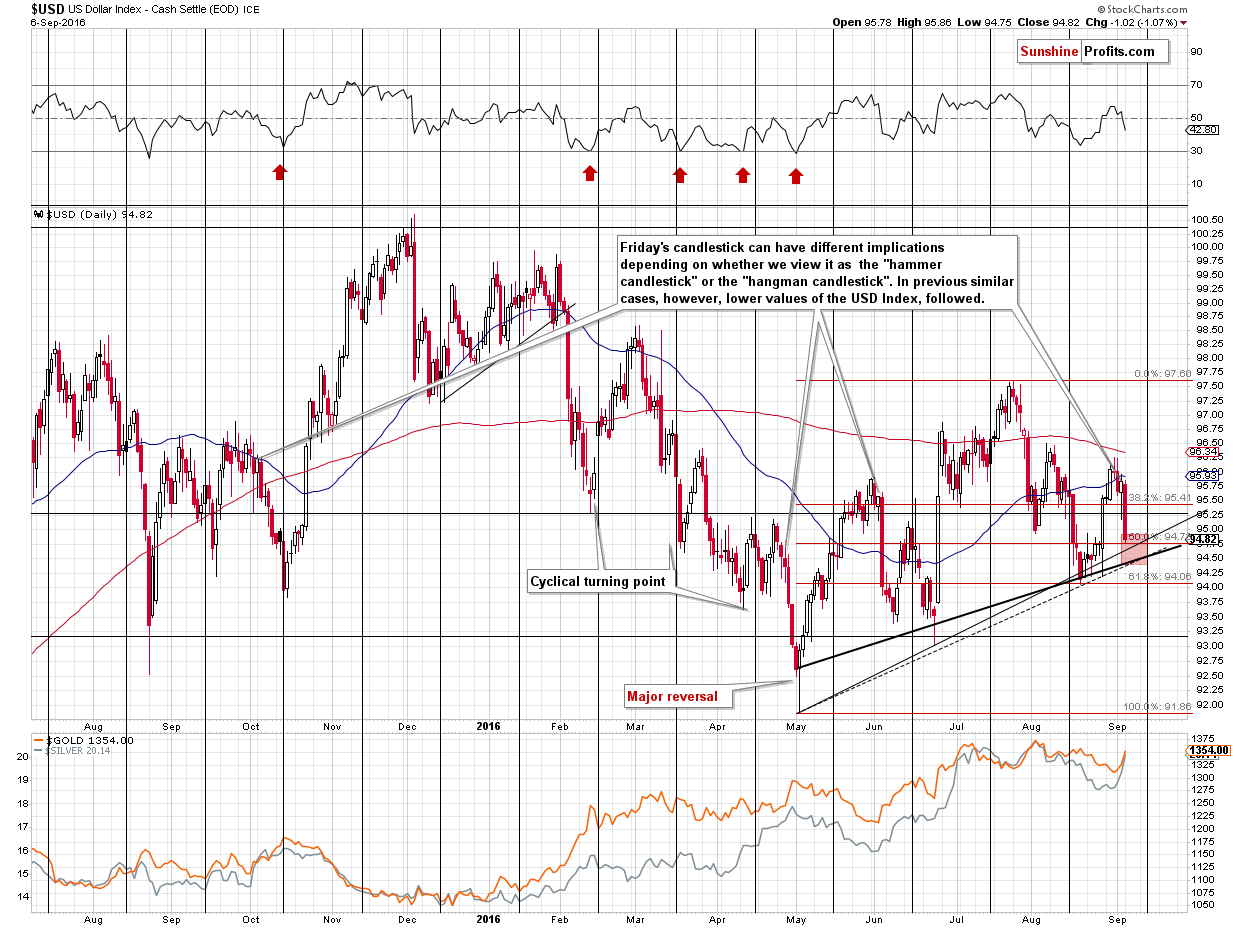
In the previous alert, we discussed that the hangman candlestick had bearish implications even though it looked like a bullish reversal:
The reversal, in which the price moves lower at first, but ends the session cancelling most of the declines (or even ends in appreciation) is called a “hammer”, but only if it is preceded by a decline. If it is preceded by a rally, it’s called a “hangman” candlestick and it has bearish implications, not bullish ones. So, one question that one has to answer before assessing the implications is whether the preceding move was up or down. It may seem obvious, but it isn’t – the USD declined on Thursday and it didn’t really rally on Wednesday, so one might view the reversal as bullish. However, the size of the late-August rally is much more significant than Thursday’s daily downswing, so after all, it seems that the entire move that preceded Friday’s session was an upswing. Therefore, the implications are bearish, but not extremely so, as it is somewhat unclear what the preceding move really was.
The second – and more important – question that one has to reply to is whether similar sessions (in a similar context) were followed by rallies, declines, or both. As we marked on the chart, similar sessions were seen a few times in the very early parts of declines. The above confirms our previous observation – that the implications of Friday’s session are not bullish, but bearish.
How low can the USD Index go? Quite likely to the combination of significant support levels: the 50% Fibonacci retracement level and the rising support line. Moreover, assuming the pace of the decline will be similar to the previous declines, the mentioned support is likely to be reached close to the cyclical turning point, which makes the reversal more likely.
Now, since the USD Index has already moved to the mentioned 50% retracement, is the bottom in? It could be, but it doesn’t have to be. If it had taken several days for the USD Index to reach this level (and the rising support line, at the same time), we would view the bottom as being most likely in, but given that it took just one day to decline so significantly, we think that there might be a few additional daily declines before the decline is truly over.
The sessions that we marked on the above chart (similar based on the hangman candlestick and also based on the follow-up decline) were all followed by at least a few daily declines, which suggests that there may be more to come.
Consequently, we added other relevant support levels to the above chart to estimate the size of the entire short-term move. It appears that most of the decline is already behind us, but an additional slide – to 94.50 or so is quite possible as well. The lowest of the likely target levels is created by the 61.8% Fibonacci retracement and the August low at about 94. We don’t expect the USD Index to move below this level (if it is not stopped higher – for instance at 94.50 or at the current levels – that is).
This suggests that the rally in the precious metals market may not be over just yet.
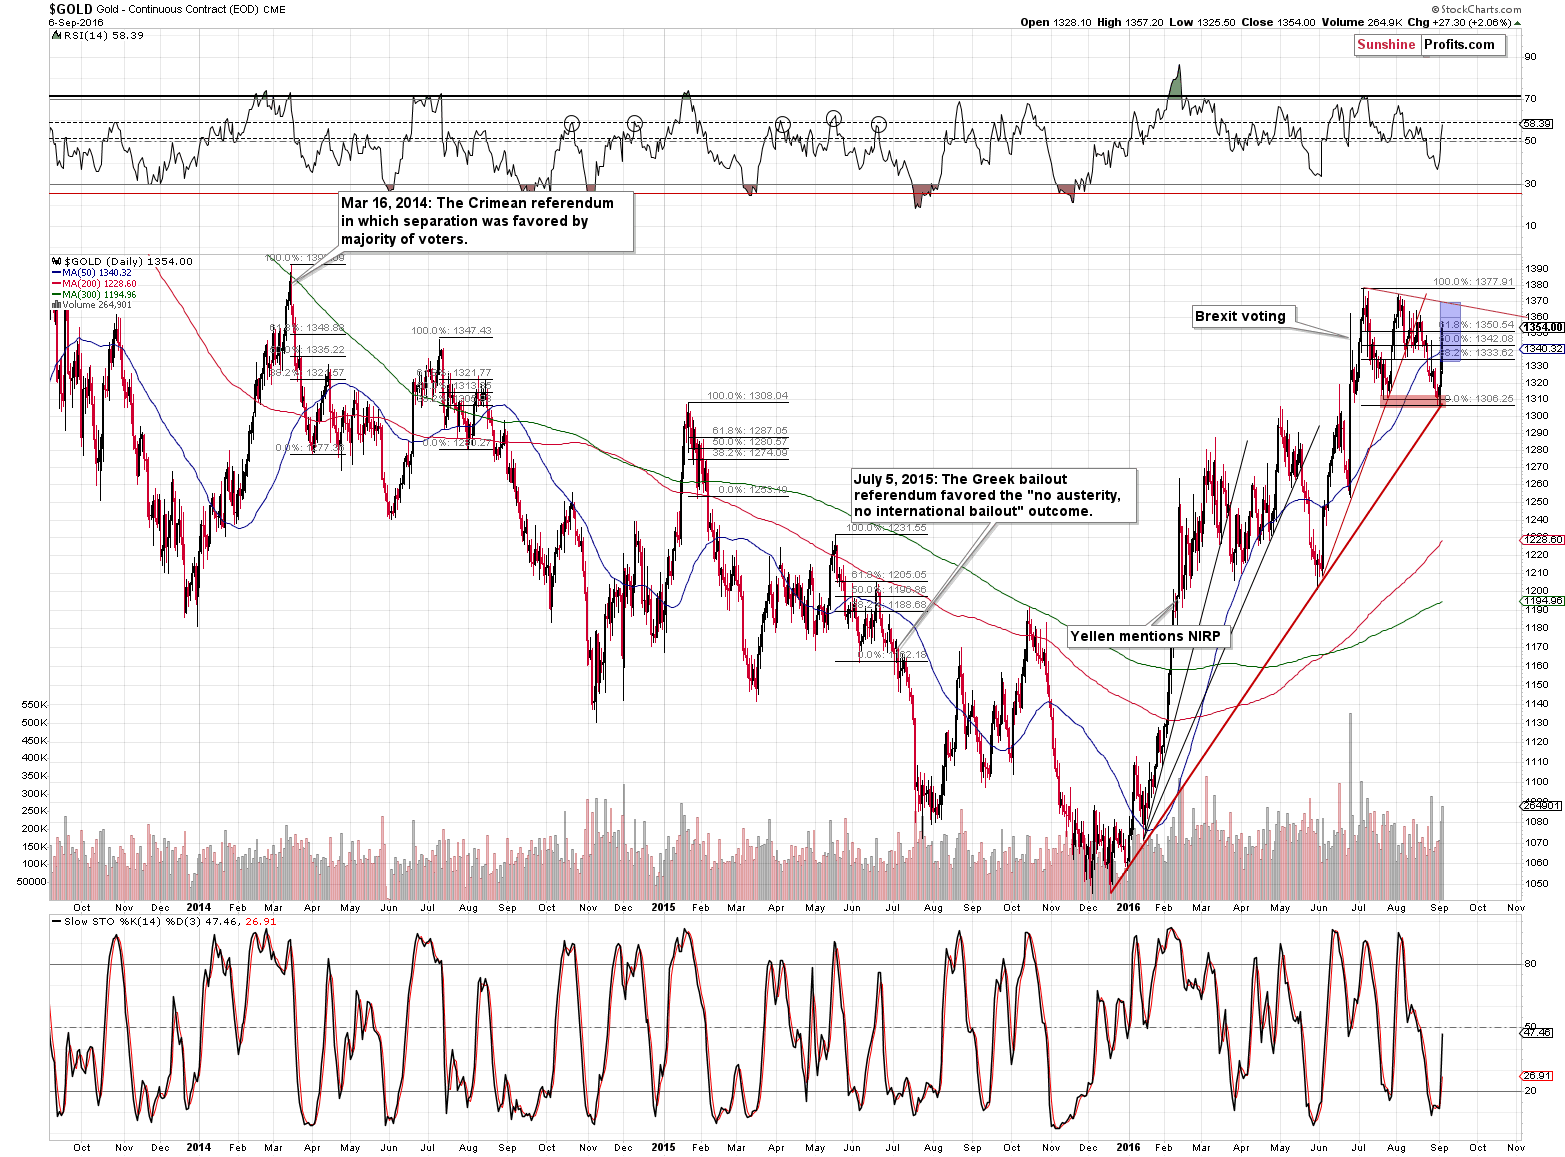
As indicated earlier today, gold moved to the upper border of our previous target area – the 61.8% Fibonacci retracement and the top could be in based on this fact alone. However, the situation in the USD Index and the huge volume on which gold rallied without reversing, makes another daily rally or a few of them quite possible. Too possible for us to open short positions at this time.
Where’s the next resistance? At the declining resistance line, which is currently at about $1,370. Consequently, we would not be surprised to see gold move to this level this or the next week. Still, please keep in mind that gold hitting this level will most likely not be enough for us to open a speculative short position by itself – we will be looking for confirmations that the top is in and when we see enough of them, then we will open the position and not sooner.
One of such confirmations can come from the silver market.
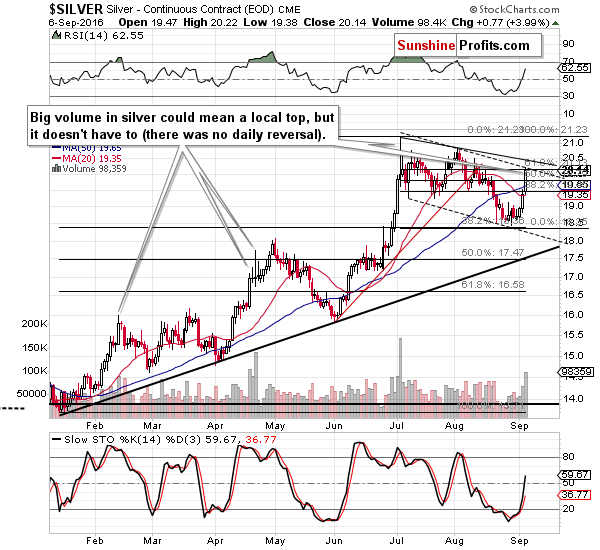
In fact, we saw a somewhat reliable confirmation yesterday. Silver moved higher and touched the resistance level and it all happened on big volume (biggest in 2 months). This could confirm that the local top is in (like it was the case in mid-February and early July), but it’s quite possible that another smaller upswing will follow – just like what took place in late April.
If silver is to move higher, then how high could it go? Quite likely to the declining resistance line based on the July and August highs or the August high itself.
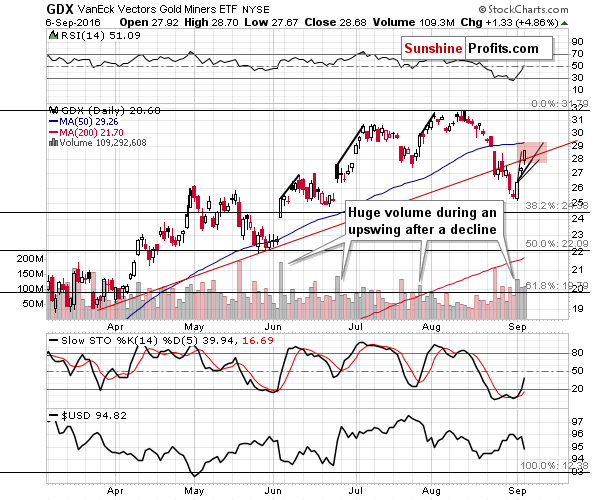
Mining stocks moved higher and once again the rally materialized on strong volume. Most previous similar rallies ended on relatively low volume (with the exception of the late-April top), so it seems that this rally may not be over also from the miners’ point of view. The 50-day moving average provides resistance and its in tune with the similarity to the June-July rally. Still, if gold moves $20 higher or so, it could be the case that miners move temporarily even above the moving average – in this case the July highs provide the next resistance.
Still, we would like to emphasize that the price targets only indicate where a turnaround is likely to take place, but are too weak to be sell signals on their own. The necessary confirmations can come from the price to volume link (upswing on tiny volume or decline on much bigger volume), one market under- or outperforming the other (silver’s sudden outperformance or miners’ underperformance), shapes of daily and weekly candlesticks, relationship between metals and the USD Index and other underlying factors, the strength of reaction to news and from other sources.
Before summarizing, we would like to feature important sell signals that are of medium-term importance (not a short-term one).
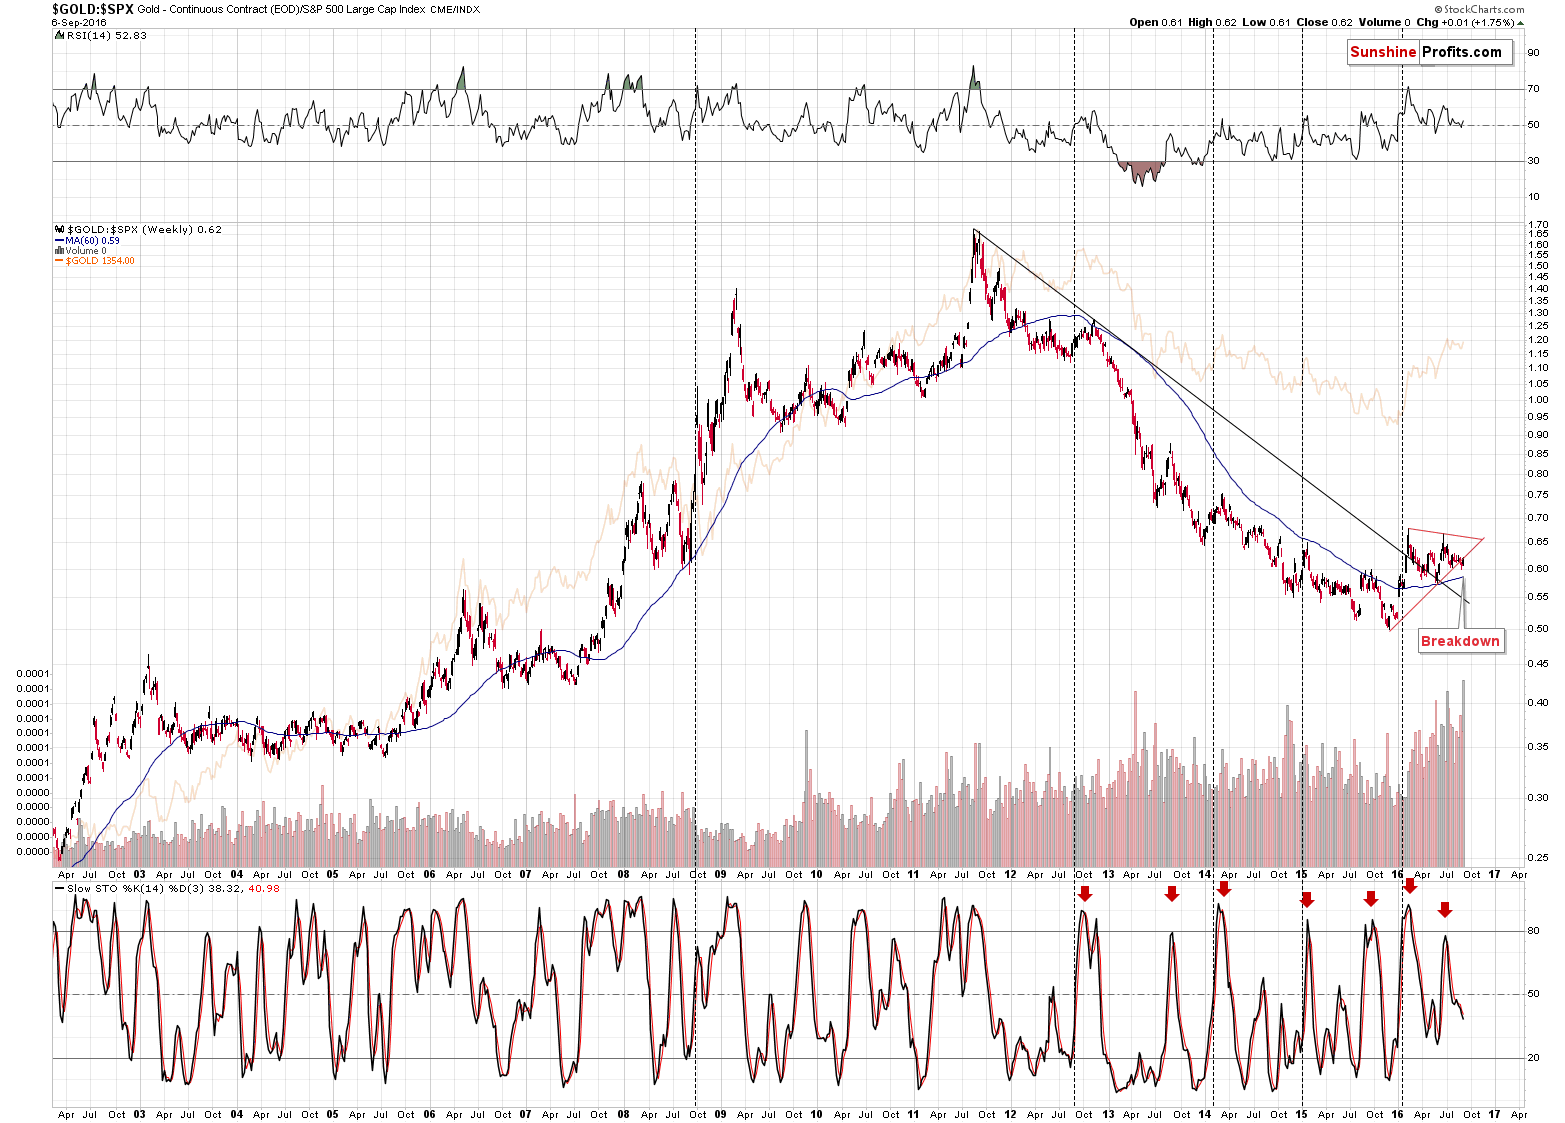
In the previous alert, we wrote the following about the gold to S&P 500 ratio:
In case of the gold to S&P 500 ratio (unlike what we saw in gold), we saw a breakdown below the rising support line and this breakdown was not invalidated based on what happened on Friday. Consequently, the breakdown is seen even in the case of weekly closing prices, which has bearish implications.
The mentioned bearish implications remain in place. Even though gold rallied yesterday, the ratio only moved back to the previously broken rising support / resistance line – there was no breakdown below it.
Finally, let’s take a look at the mining stocks’ relationship with the general stock market.
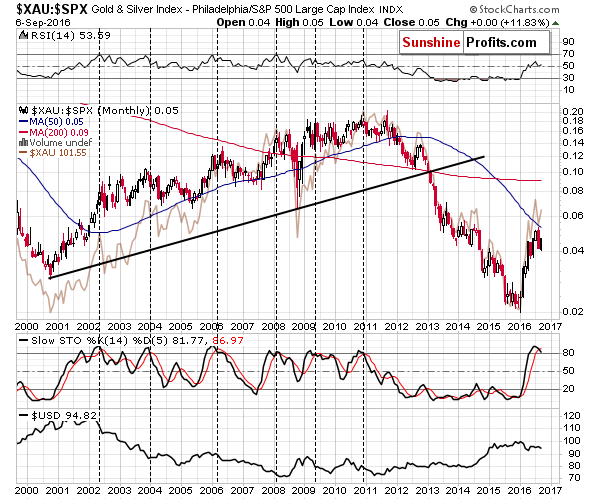
What’s so special about this chart? The sell signal from the Stochastic indicator based on the monthly closing prices. Naturally, September is not over yet, but the indicator was (and still is) significantly overbought and the move below the signal line (red) is quite visible and that’s the case despite this week’s rally. Consequently, the signal is already at least somewhat meaningful.
What does the signal imply? There were a few similar cases in the past 20 years and usually a big decline was seen in the months following the signal. That was the case in 2002, 2006, and 2008. In 2004 we saw a small rally first, but a bigger decline still followed shortly and in 2009, we saw only a small decline within a rally. Consequently, the overall implications of the current situation in the Stochastic indicator are bearish for the following months.
Summing up, even though the 1983 analogy and the big downtrend remain in place, it appears that an additional short-term rally is still quite possible in the coming days and that we will be able to re-enter the speculative short positions at higher prices. For now, both long and short positions seem too risky, so we are staying on the sidelines, waiting for a better risk to reward ratio. There will most likely be at least a few bearish confirmations present when the next local top is formed and we will be paying extra attention to the markets and report to you if we see such events.
As always, we will keep you – our subscribers – updated.
To summarize:
Trading capital (supplementary part of the portfolio; our opinion): No positions
Long-term capital (core part of the portfolio; our opinion): No positions
Insurance capital (core part of the portfolio; our opinion): Full position
Plus, you might want to read why our stop-loss orders are usually relatively far from the current price.
Please note that a full position doesn’t mean using all of the capital for a given trade. You will find details on our thoughts on gold portfolio structuring in the Key Insights section on our website.
As a reminder – “initial target price” means exactly that – an “initial” one, it’s not a price level at which we suggest closing positions. If this becomes the case (like it did in the previous trade) we will refer to these levels as levels of exit orders (exactly as we’ve done previously). Stop-loss levels, however, are naturally not “initial”, but something that, in our opinion, might be entered as an order.
Since it is impossible to synchronize target prices and stop-loss levels for all the ETFs and ETNs with the main markets that we provide these levels for (gold, silver and mining stocks – the GDX ETF), the stop-loss levels and target prices for other ETNs and ETF (among other: UGLD, DGLD, USLV, DSLV, NUGT, DUST, JNUG, JDST) are provided as supplementary, and not as “final”. This means that if a stop-loss or a target level is reached for any of the “additional instruments” (DGLD for instance), but not for the “main instrument” (gold in this case), we will view positions in both gold and DGLD as still open and the stop-loss for DGLD would have to be moved lower. On the other hand, if gold moves to a stop-loss level but DGLD doesn’t, then we will view both positions (in gold and DGLD) as closed. In other words, since it’s not possible to be 100% certain that each related instrument moves to a given level when the underlying instrument does, we can’t provide levels that would be binding. The levels that we do provide are our best estimate of the levels that will correspond to the levels in the underlying assets, but it will be the underlying assets that one will need to focus on regarding the signs pointing to closing a given position or keeping it open. We might adjust the levels in the “additional instruments” without adjusting the levels in the “main instruments”, which will simply mean that we have improved our estimation of these levels, not that we changed our outlook on the markets. We are already working on a tool that would update these levels on a daily basis for the most popular ETFs, ETNs and individual mining stocks.
Our preferred ways to invest in and to trade gold along with the reasoning can be found in the how to buy gold section. Additionally, our preferred ETFs and ETNs can be found in our Gold & Silver ETF Ranking.
As always, we'll keep you - our subscribers - updated should our views on the market change. We will continue to send out Gold & Silver Trading Alerts on each trading day and we will send additional Alerts whenever appropriate.
The trading position presented above is the netted version of positions based on subjective signals (opinion) from your Editor, and the Tools and Indicators.
As a reminder, Gold & Silver Trading Alerts are posted before or on each trading day (we usually post them before the opening bell, but we don't promise doing that each day). If there's anything urgent, we will send you an additional small alert before posting the main one.
=====
Latest Free Trading Alerts:
There are only two months left before the U.S. presidential elections. What are the current odds of both candidates and what do they mean for the gold market?
Gold Two Months before U.S. Presidential Elections
=====
Hand-picked precious-metals-related links:
Gold Holds Biggest Jump Since Brexit on Lowered Fed Rate Bets
Weak U.S. Data Pushes Gold, Silver Prices Sharply Higher
Gold Miners Are Getting Even More Volatile Relative to Gold
Platinum’s Discount Trade to Gold Lures Japanese Jewelry Lovers
=====
In other news:
Fed’s Williams Says He Isn’t Jumping to Conclusions on Data
Goldman Sachs: China signaling further stimulus on the way
Draghi Set to Tell Tale of Stimulus Undercut by Brexit Woes
ECB might deliver more QE but Fitch's top economist says 'don't bother'
World stocks hit one-year highs as Fed hike prospects fade
=====
Thank you.
Sincerely,
Przemyslaw Radomski, CFA
Founder, Editor-in-chief, Gold & Silver Fund Manager
Gold & Silver Trading Alerts
Forex Trading Alerts
Oil Investment Updates
Oil Trading Alerts


