In short: No changes and no positions. The situation on gold and silver charts became more bearish while mining stock charts became more bullish. Overall, the situation became less clear, but the medium-term trend in the precious metals market remains down.
Yesterday was a quite volatile day on the precious metals market, so let’s start by checking the most important thing – the long-term chart – and verifying whether anything major changed or not. Please take a look below (charts courtesy of http://stockcharts.com.)
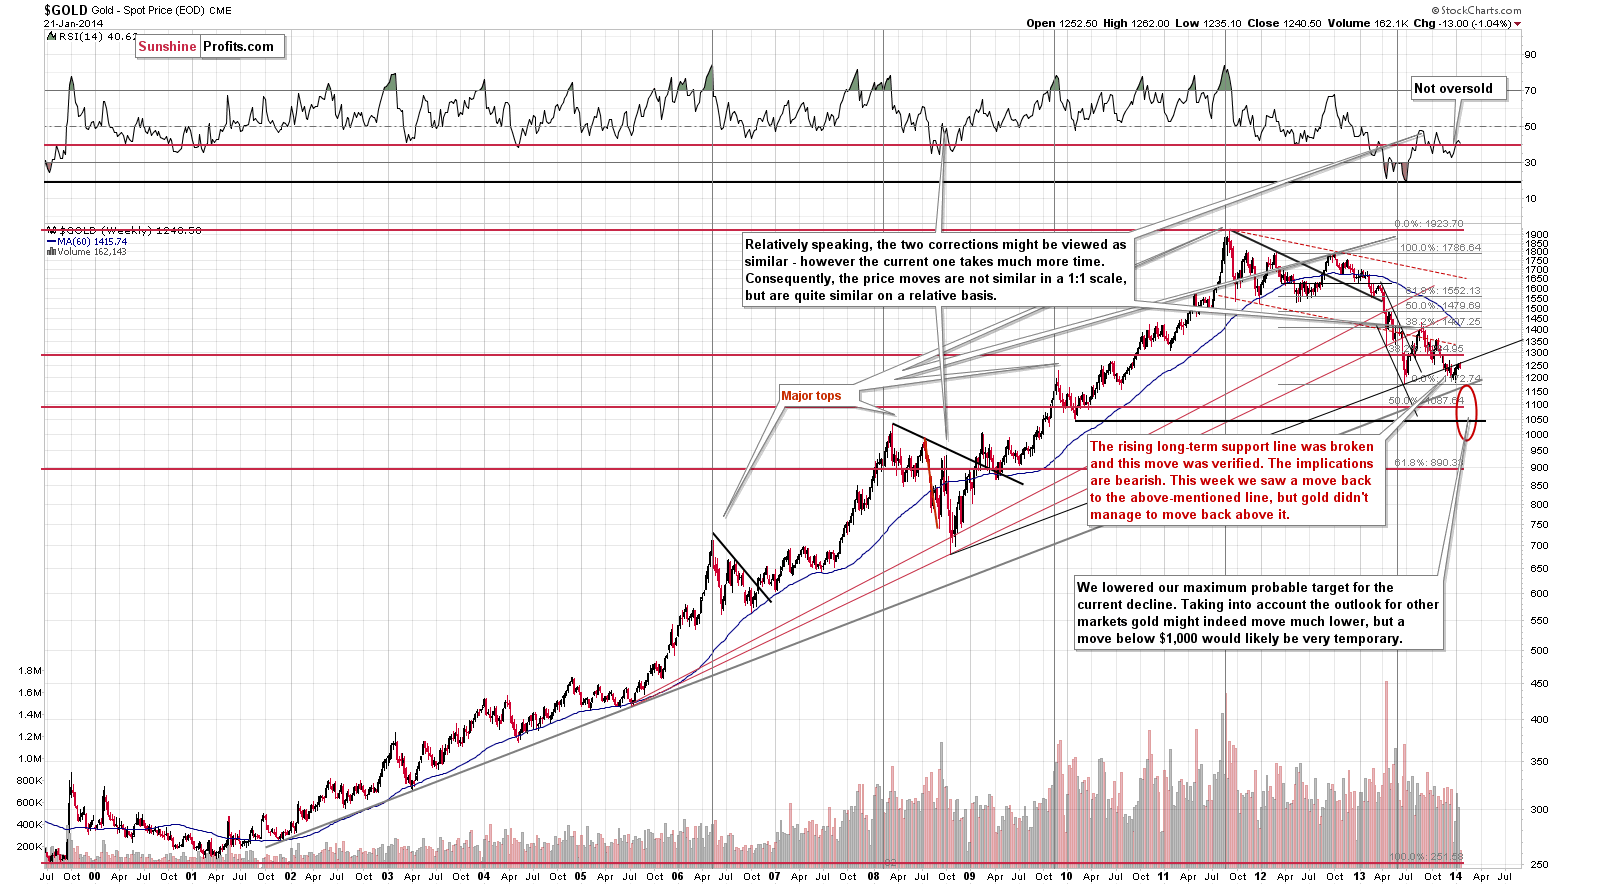
Nothing changed. The long-term support line was broken, we saw a pullback to it, and we saw a decline once again. The breakdown was simply verified.
From the short-term perspective, the situation is more dynamic.
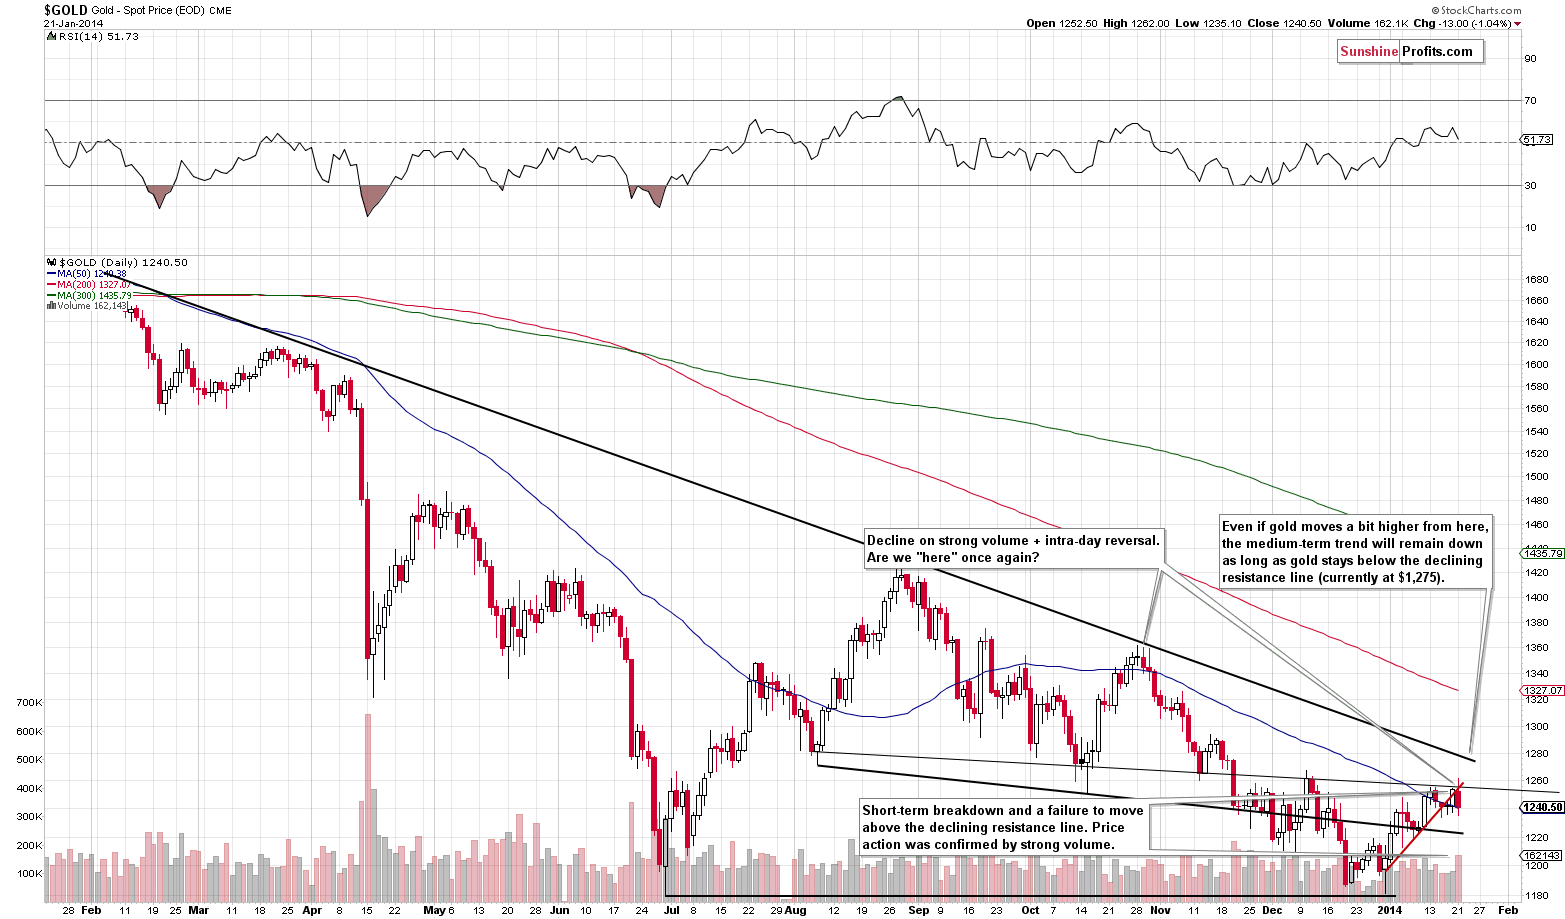
We have previously written that the current situation was similar to 2 cases from the past – one right at the local top and the second a few days before it. Yesterday’s session was similar to what we had previously seen when gold topped. This fits into the previous assumption about the self-similarity, and has bearish implications.
Taking the above analogy aside, there were also 3 other bearish factors. The first one is the invalidation of the move above the (slightly) declining resistance line. The second one is a breakdown below the rising short-term support line (marked in red). The final one is that these events happened on relatively strong volume.
Overall, the outlook for the gold market deteriorated based on the above.
Let’s see what other charts suggest.
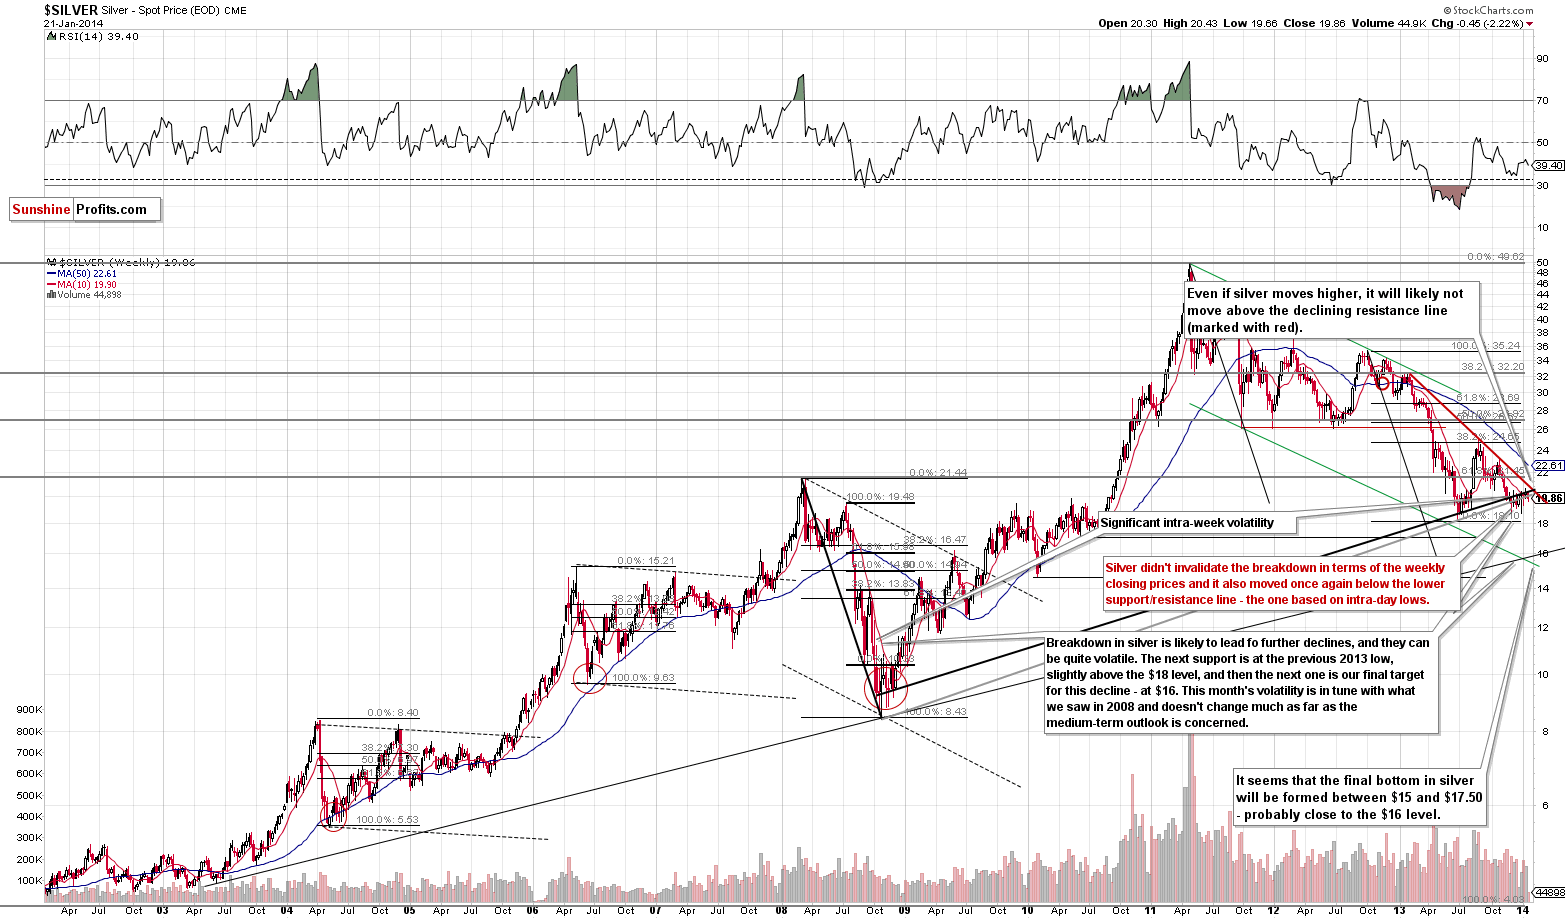
Silver moved significantly lower and once again declined below the lower of the long-term support/resistance lines. The trend clearly remains down and the outlook deteriorated based on the breakdown.
The bearish implications remain in place.
Here’s what’s really "disturbing" (or encouraging depending on how one looks at the situation) about the above two charts.
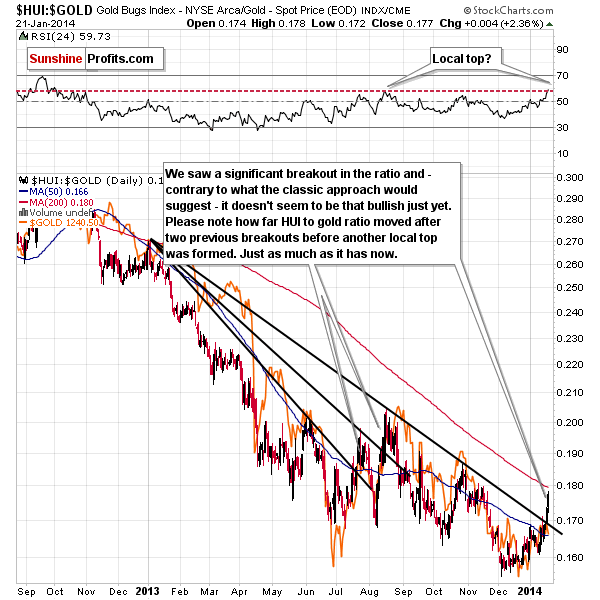
Miners rallied sharply relative to gold, which – unlike what we described earlier today – has bullish implications.
A rally in miners relative to gold was a very bullish indication several years ago. However, for the last few years, this signal has not been working like it used to previously. In fact, we saw similarly encouraging strength in July and August 2013 – and this was when local tops were formed. There even were breakouts above declining resistance lines in both cases, just like what we’re seeing right now.
So, how bullish is it, really? "Mildly, so far" is our best answer at this time.
What about silver stocks?
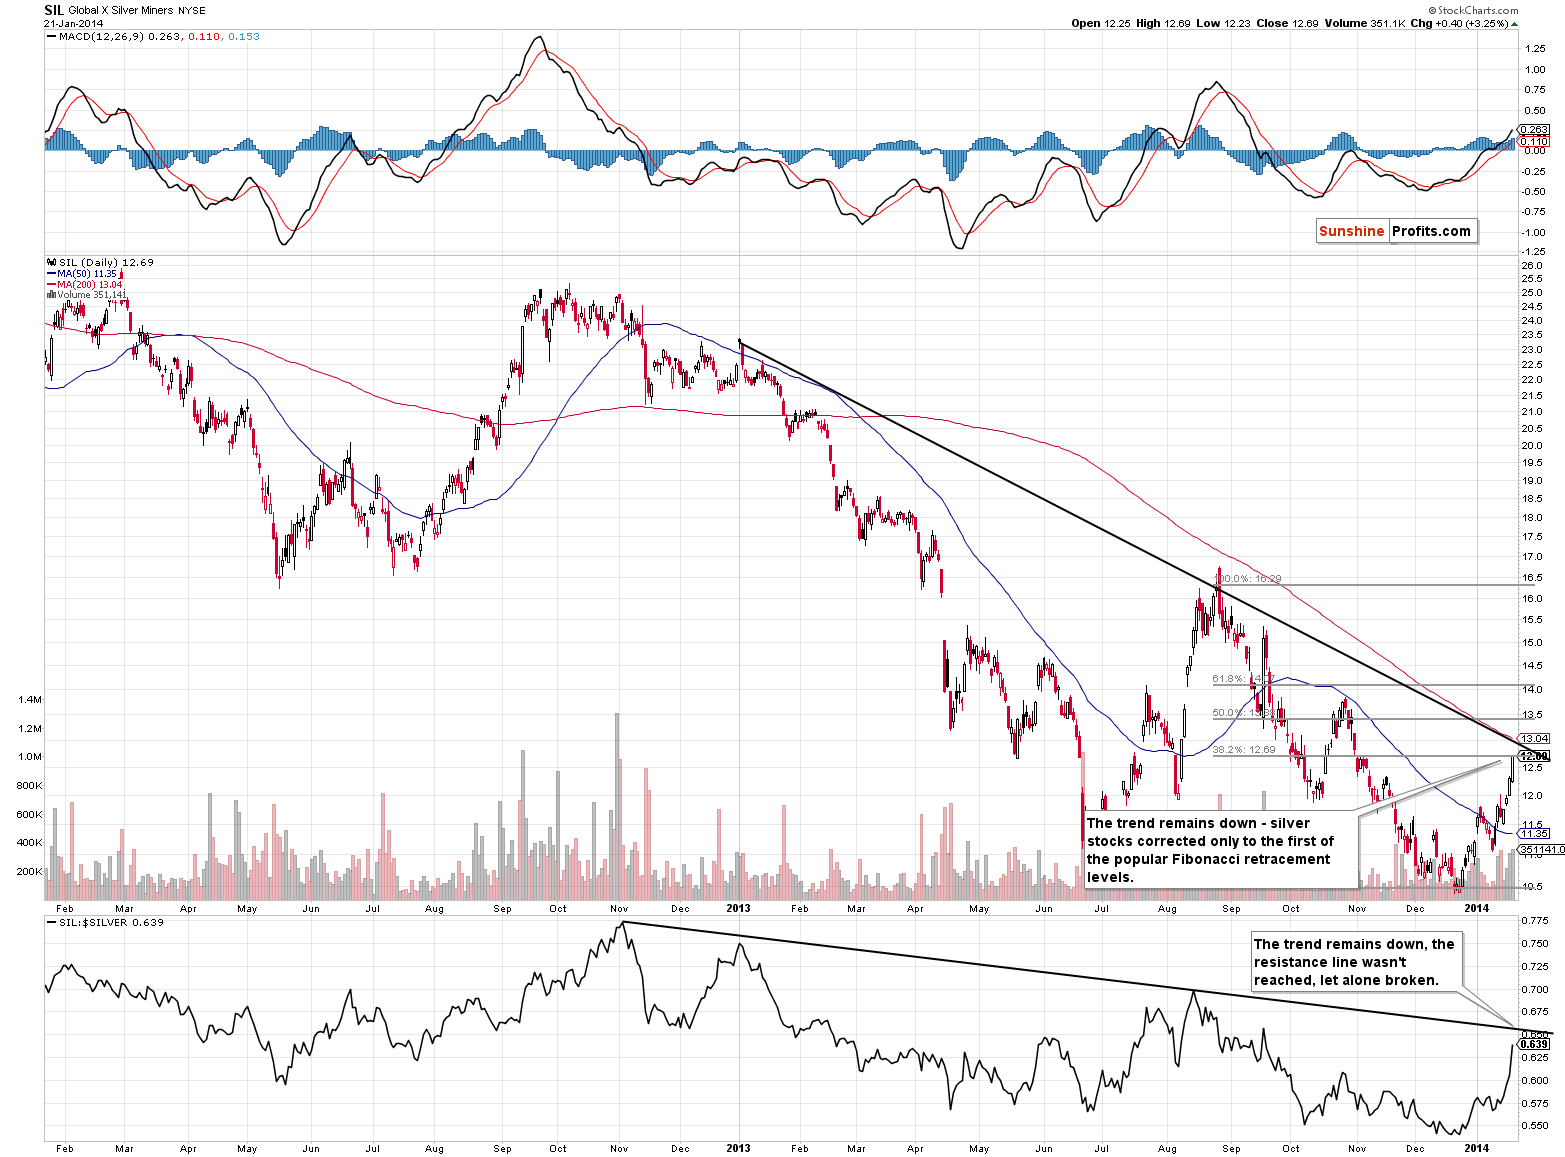
Silver stocks have corrected to the first of the classic Fibonacci retracement levels, to the 38.2% retracement. This means that the trend remains down and all that what we saw was a correction.
The declining resistance lines (in silver stocks themselves, and in their ratio to silver, which you can see in the lower part of the chart) were not broken and the trend remains down.
Before we summarize, let’s take a look at one more interesting thing that happened in the market recently.
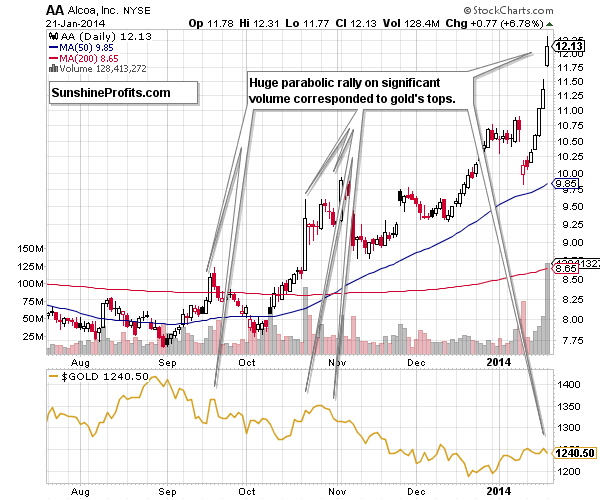
Alcoa shares rallied very significantly in the past few days. The volume was even more significant. Why compare AA with gold? Because there has been a visible link between the two and they are both (Alcoa being world’s third biggest aluminum producer) in the commodity sector. Technically speaking, parabolic upswings and a daily rally on huge volume meant a local top not only in AA shares, but also in gold in the past. That’s another bearish signal that we saw yesterday.
Taking all of the above into account, we get the same result we got previously. We saw several important developments in the precious metals market yesterday, but they are not pointing in the same direction. We could see a decline from here, or we could see another move higher and then a decline – the very short term (the next few days) is still rather unclear.
We will consider opening speculative short positions once we see some kind of confirmation.
To summarize:
- Trading capital: No positions.
- Long-term capital: No positions.
As always, we'll keep you - our subscribers - updated should our views on the market change. We will continue to send out Market Alerts on each trading day and we will send additional Market Alerts whenever appropriate.
The trading position presented above is the netted version of positions based on subjective signals from your Editor, and the automated tools (SP Indicators and the upcoming self-similarity-based tool).
As a reminder, Market Alerts are posted before or on each trading day (we usually post them before the opening bell, but we don't promise doing that each day). If there's anything urgent, we will send you an additional small alert before posting the main one.
Thank you.
Sincerely,
Przemyslaw Radomski, CFA


