Briefly: In our opinion, short (full) speculative positions in gold, silver and mining stocks are justified from the risk/reward point of view.
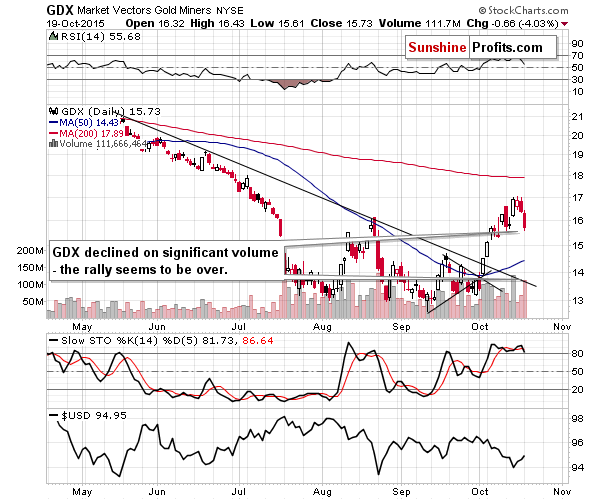
Just when it seemed that the only way the mining stocks could move was up, they invalidated their breakout above the August high. This was the second attempt of mining stocks to move above this high that was just invalidated – and this time it was accompanied by significant volume. What are the implications?
In short, the implications are exactly as they were on Friday and on Thursday. To a large extent, today’s situation is the likely follow-up action that was heralded by multiple signals. There were only a few developments in the precious metals market that are worth focusing on, so today’s alert is once again going to be short, but we would like to emphasize that many additional reasons justifying our current outlook and preferred way of taking advantage of it were described in Thursday’s alert. These reasons remain up-to-date, so if you haven’t had the chance to read the mentioned alert, we encourage you to do so today.
Having said that, let’s take a look at the charts that show some new developments (charts courtesy of http://stockcharts.com).

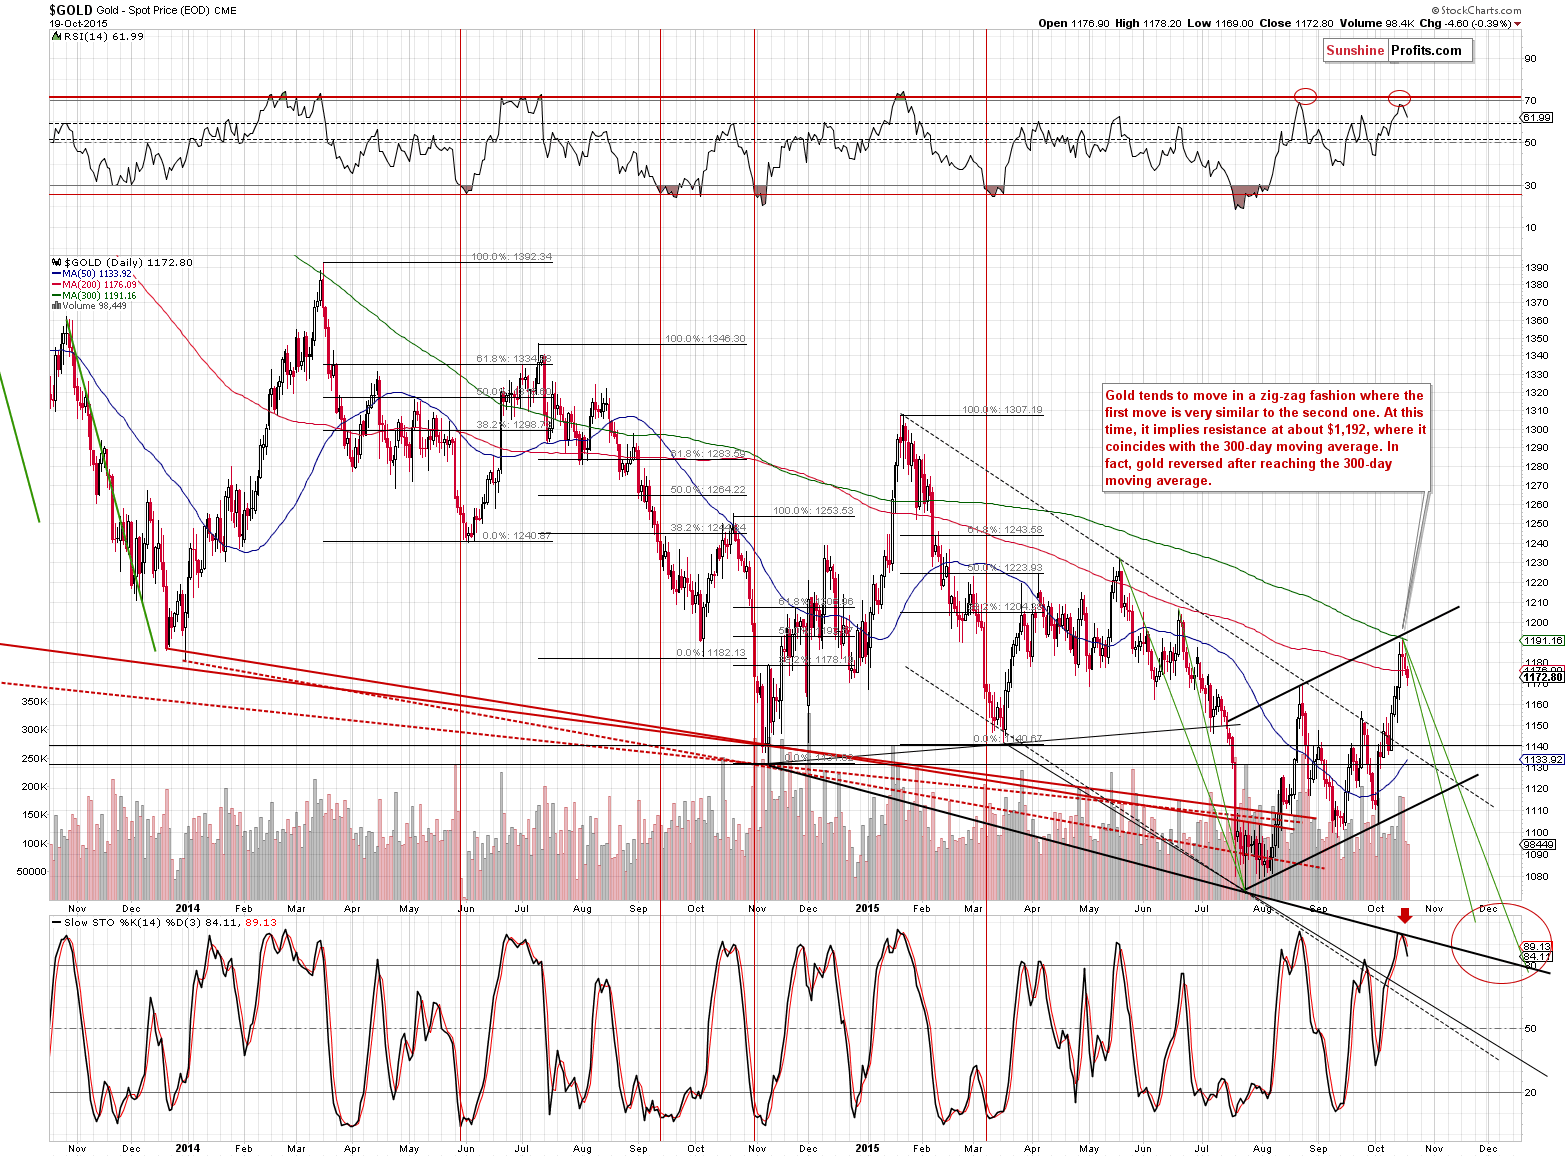
Gold moved lower once again and our previous comments on the above chart remain up-to-date:
First of all, we would like to once again emphasize the fact that gold reversed after moving right to the 300-day moving average and this average has been particularly important since late 2001. In fact, it was 100% efficient from late 2001 to 2007. It was quite efficient in the subsequent years as well. It was reached once again and the volume during Thursday’s session was significant. It could be the case that the rally is already over.
The Stochastic indicator flashed a sell signal and the RSI more or less did the same (it was not at 70 but very close to it). The implications are bearish.
The important change here is that gold closed once again below the 200-day moving average, thus invalidating the breakout. In the past year or so when gold moved and closed below this moving average, it meant that lower gold prices were to be expected. This signal was seen only a few times in the past year, so it’s not particularly important, but still, in light of multiple other bearish indications (that we covered on Thursday), this serves as a bearish confirmation. We will move back to discussing this moving average before summarizing today’s alert.

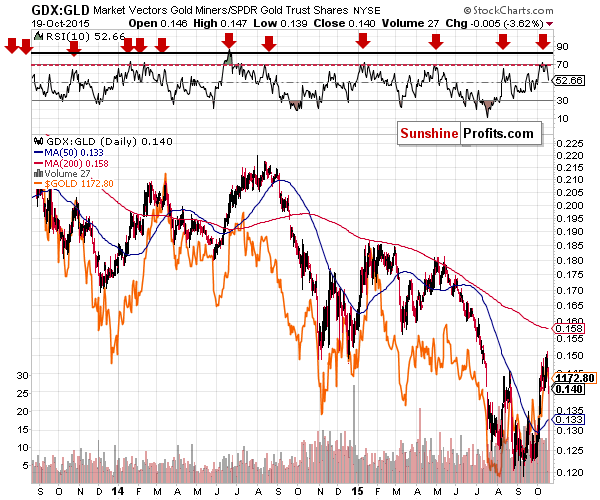
The mining stocks to gold ratio flashed a sell signal recently and we didn’t have to wait for long for the decline to materialize. The decline in the ratio is still small (for now), but the performance of the RSI indicator shows that the sell signal was clear and the implications are bearish.

The GDX ETF is finally showing significant signs that the rally is over – we have just seen a move and close back below the August high. The second attempt to break above this high was once again invalidated. The most important thing is that this time the volume that accompanied the decline is much higher. Additionally, there was no analogous decline in the stock market, so the fact that miners declined so visibly is profound.
All in all, the situation in the precious metals market deteriorated based on yesterday’s session.
Before summarizing, we would like to discuss the issue raised in one of the articles that were recently posted and on which we were asked to comment. This is the link to the article. The article has seemingly bullish implications, but - based on the charts from this article alone - we would like to point out that there are actually none.
In short, the article is about a very specific signal. The author argues that the third move above the 200-day moving average that takes place after gold has been below this average for at least 100 days is the true breakout. The level of sophistication of this signal and the fact that it is the only signal that is being featured is something that alone should make one concerned and to look for a possible data mining bias.
The thing is that “if you torture the dataset long enough, it will confess to anything”. This is another way to say that if you check an enormous number of parameters for a certain indicator (for instance changing the number of days based on which a moving average is calculated), you’ll almost always find “the perfect parameter” for which the historical performance would have theoretically been excellent. Unfortunately, in the vast majority of cases, the above results in losses when applied to real life. Why? Because in most cases it was just a coincidence. If (this example comes from “Fooled by Randomness” by Nassim Taleb) you put an almost infinite amount of monkeys in front of typewriters and see what they write, the odds are that one of them will eventually type “Iliad,” just like Homer. Would anyone want to bet that this particular monkey would then be able to write the “Odyssey” next? No, because that was just a coincidence.
Having said that, we want to emphasize that such optimization of parameters is not wrong per se - it’s simply not enough to describe something as useful. If there is a reason for a certain phenomenon to work (a fundamental one), then such optimization can result in useful signals right away, however, even in this case, some tests should be conducted before deciding on giving such signal a try in real-life trading.
A good way to test a given phenomenon is to conduct the sensitivity analysis. In other words, to check if a given parameter (say, a number of days based on which a moving average is calculated) was changed a bit in any direction, would it have a material impact on the final outcome. If yes, then the odds are that a good historical result was just accidental. If the outcome is still favorable and not significantly worse, then one might have discovered something.
Another important thing is to look at the number of signals that were generated and tested previously. The more signals there were, the more reliable the result - given that it passes the sensitivity analysis test. If we saw just 2 signals, then it’s nothing to call home about, but if we saw more than 5 signals, and ideally more than 30 signals, then we could start getting excited about possibly discovering something new that’s useful.
There are some other tests that we run, but we would prefer not to disclose all the details.
Finally, even if everything looks good, it doesn’t seem justified to rely on just one signal - there should be much more of them and they should confirm each other and there should not be many reliable signals that point to a different outcome (and one should be on a lookout for the signals invalidating the current point of view, not vice-versa).
Having said that, let’s move back to the article. The second chart in the article shows the signals. In the past 40 years, there were 3 cases that the “current signal” is based on. That’s a small number and based on this alone, the strength of the signal would be limited if everything else was “ok” with it - and it isn’t.
The sensitivity analysis in this case suggests that this signal is not useful - note how many times the signal line was very close to 100 around the year 1990 and note the “almost-to-100” move right before 1999. There was also one “almost-to-100” move close to the beginning of 2014. Consequently, the signal is very imprecise, because just a small change in the parameter (days below 200-day average) would mean a big change in efficiency. Consequently, what we see on the chart does not confirm this indicator’s efficiency.
Finally, since this indicator is based on 3 cases from the past, each of them should be closely analyzed. The second signal marked on the chart, July 14, 1992, was actually followed by lower prices in the following months, which would actually confirm our outlook (that the final bottom is not very far - in terms of time - but not yet behind us).
All in all, we think that the signal based on the third time that gold moves above its 200-day moving average is not really important and it doesn’t change our long-, medium- and short-term outlook on the precious metals market.
Summing up, gold, silver and mining stocks moved lower yesterday and the underperformance of miners was quite visible. In fact, miners declined on significant volume and it seems likely that the recent counter-trend rally is already over – or very close to being over. Based on multiple signals that we have right now, it seems that the next big move will be to the downside and being positioned to take advantage of it remains justified from the risk/reward point of view.
As always, we will keep you – our subscribers – updated.
To summarize:
Trading capital (our opinion): Short position (full) position in gold, silver and mining stocks is justified from the risk/reward perspective with the following stop-loss orders and initial (! – this means that reaching them doesn’t automatically close the position) target prices:
- Gold: initial target price: $1,050; stop-loss: $1,223, initial target price for the DGLD ETN: $98.37; stop loss for the DGLD ETN $62.34
- Silver: initial target price: $12.60; stop-loss: $16.73, initial target price for the DSLV ETN: $96.67; stop loss for DSLV ETN $40.28
- Mining stocks (price levels for the GDX ETF): initial target price: $11.57; stop-loss: $18.13, initial target price for the DUST ETF: $26.61; stop loss for the DUST ETF $9.22
In case one wants to bet on junior mining stocks' prices (we do not suggest doing so – we think senior mining stocks are more predictable in the case of short-term trades – if one wants to do it anyway, we provide the details), here are the stop-loss details and initial target prices:
- GDXJ ETF: initial target price: $16.27; stop-loss: $25.23
- JDST ETF: initial target price: $46.47; stop-loss: $15.58
Long-term capital (our opinion): No positions
Insurance capital (our opinion): Full position
Please note that a full position doesn’t mean using all of the capital for a given trade. You will find details on our thoughts on gold portfolio structuring in the Key Insights section on our website.
As a reminder – “initial target price” means exactly that – an “initial” one, it’s not a price level at which we suggest closing positions. If this becomes the case (like it did in the previous trade) we will refer to these levels as levels of exit orders (exactly as we’ve done previously). Stop-loss levels, however, are naturally not “initial”, but something that, in our opinion, might be entered as an order.
Since it is impossible to synchronize target prices and stop-loss levels for all the ETFs and ETNs with the main markets that we provide these levels for (gold, silver and mining stocks – the GDX ETF), the stop-loss levels and target prices for other ETNs and ETF (among other: UGLD, DGLD, USLV, DSLV, NUGT, DUST, JNUG, JDST) are provided as supplementary, and not as “final”. This means that if a stop-loss or a target level is reached for any of the “additional instruments” (DGLD for instance), but not for the “main instrument” (gold in this case), we will view positions in both gold and DGLD as still open and the stop-loss for DGLD would have to be moved lower. On the other hand, if gold moves to a stop-loss level but DGLD doesn’t, then we will view both positions (in gold and DGLD) as closed. In other words, since it’s not possible to be 100% certain that each related instrument moves to a given level when the underlying instrument does, we can’t provide levels that would be binding. The levels that we do provide are our best estimate of the levels that will correspond to the levels in the underlying assets, but it will be the underlying assets that one will need to focus on regarding the sings pointing to closing a given position or keeping it open. We might adjust the levels in the “additional instruments” without adjusting the levels in the “main instruments”, which will simply mean that we have improved our estimation of these levels, not that we changed our outlook on the markets. We are already working on a tool that would update these levels on a daily basis for the most popular ETFs, ETNs and individual mining stocks.
Our preferred ways to invest in and to trade gold along with the reasoning can be found in the how to buy gold section. Additionally, our preferred ETFs and ETNs can be found in our Gold & Silver ETF Ranking.
As always, we'll keep you - our subscribers - updated should our views on the market change. We will continue to send out Gold & Silver Trading Alerts on each trading day and we will send additional Alerts whenever appropriate.
The trading position presented above is the netted version of positions based on subjective signals (opinion) from your Editor, and the Tools and Indicators.
As a reminder, Gold & Silver Trading Alerts are posted before or on each trading day (we usually post them before the opening bell, but we don't promise doing that each day). If there's anything urgent, we will send you an additional small alert before posting the main one.
=====
Latest Free Trading Alerts:
Last week was full of important economic news. We wrote about weak retail sales and the lack of CPI inflation, but until now we haven’t had time to discuss all new pieces of information. What do they tell us about the U.S. economy and how can they affect the gold market?
U.S. Manufacturing Still Sinks
Over the weekend, there was action and Bitcoin moved away from $250. The currency briefly went over $270. This looks like a very bullish development. But is it?
Bitcoin Trading Alert: Bitcoin Might Be in for a Dive
=====
Hand-picked precious-metals-related links:
LBMA: Little cheer for gold investors from LBMA conference panel
Goldman's Bearish Gold View 2015: Wrong For Wrong Reasons
Tough liquidity rules could push more banks out of gold - LBMA
=====
In other news:
Is ECB President Mario Draghi set to launch QE2?
Europe may need another 'whatever it takes' pledge
Skeptics suggest China's slump deeper than acknowledged
Emerging markets: Bouncing back or further to fall?
Canada election: Liberals sweep to power
Diamond industry dragged into slump as China demand ebbs away
Oil market showdown: Can Russia outlast the Saudis?
=====
Thank you.
Sincerely,
Przemyslaw Radomski, CFA
Founder, Editor-in-chief
Gold & Silver Trading Alerts
Forex Trading Alerts
Oil Investment Updates
Oil Trading Alerts


