Briefly: No speculative positions in gold, silver and mining stocks are justified from the risk/reward perspective. We are expecting to be back in the short positions relatively soon, but not yet at this time.
Precious metals and – in particular – mining stocks rallied strongly yesterday. The volume accompanying the rally in miners was huge and it appears that yesterday’s decision to take profits off the table and exit the short positions was correct, as it doesn’t seem that the rally is completely over. Does it mean that long positions are now justified?
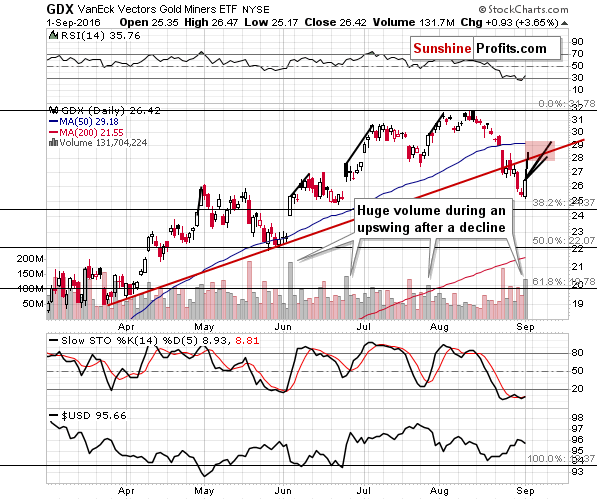
In our opinion, this is not the case and the reason is that there are indications that we will see some strength in the short term, but nothing more. Sure, the volume that accompanied yesterday’s rally in miners was enormous, but how far have miners rallied after similar sessions? Let’s take a closer look at the charts, starting with mining stocks (charts courtesy of http://stockcharts.com).

We marked the similar moves that took place after the similar daily rallies (from the highest point of the initial session to the final top in intra-day terms) and we applied these moves to yesterday’s high. The red rectangle is the area where miners would have to go for this rally to be similar to the previous ones.
Please note that even when mining stocks were moving mostly higher, the sizes of the follow-up rallies were not that huge. After a relatively big daily rally, it turned out that a large part of the entire short-term rally was already over.
What does that imply for the current situation? That it’s likely not worth participating in this rally as the potential size thereof is quite limited, especially when we factor in the significant resistance created by the rising red line (at about $28 - $28.5). Naturally, if it was certain that miners would move there, participating in the rally would be obvious, but it is associated with risk – especially that miners are after a major breakdown and have been underperforming gold for weeks (with yesterday’s session being an exception) and since it appears that the precious metals are now in a bigger downtrend.

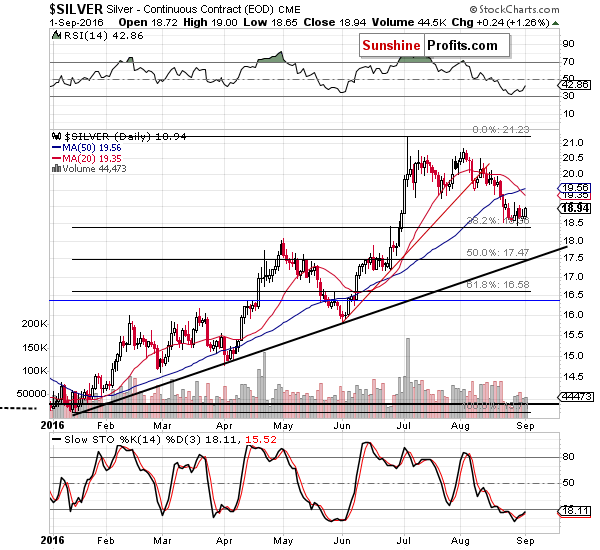
Silver moved higher, but it remains within the small trading range and the implications are next to nothing. Let’s keep in mind that silver tends to outperform on a very short-term basis right before local tops and at them, so this will be one of the confirmations that we will be looking for in the coming days.

In yesterday’s alert, we wrote the following:
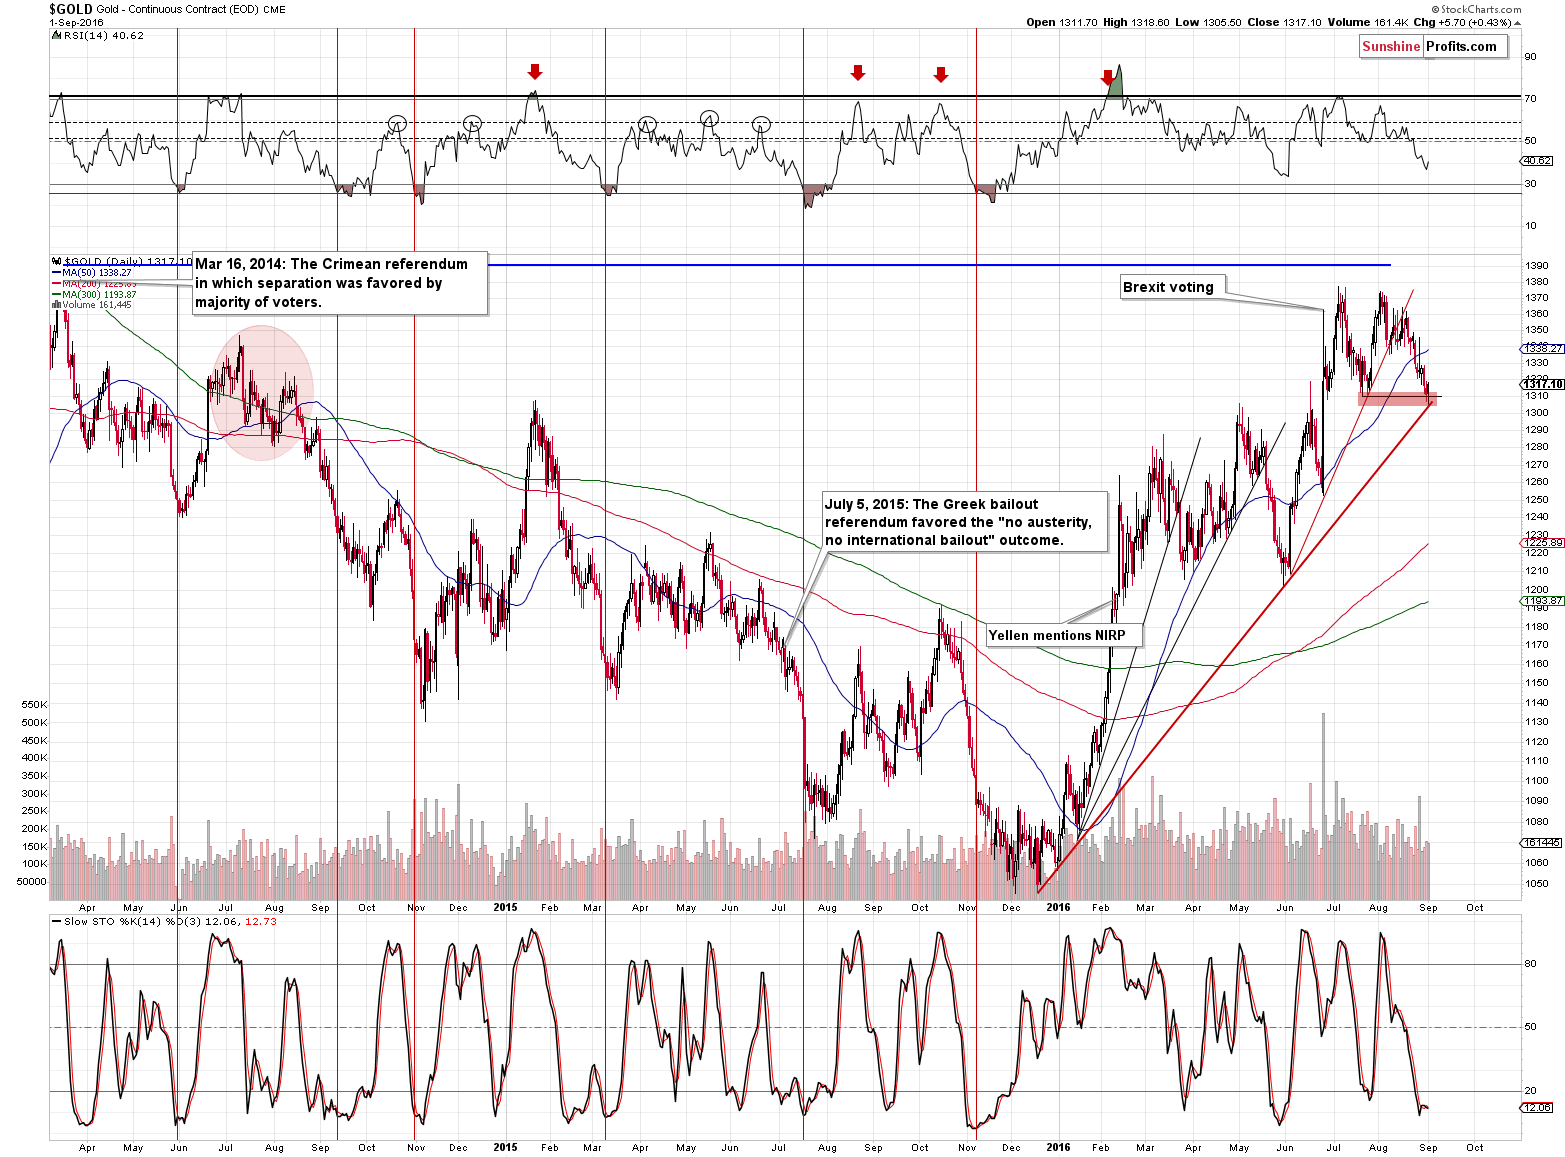
The downtrend still appears to be back, but let’s not forget that no market can move in a straight line. Gold has been moving lower for almost the entire month (with almost only intra-day upswings), so a breather would not be anything unusual or particularly bullish.
Yesterday, gold broke below the rising medium-term support line based on the daily closing prices, which is generally a bearish sign, but the move below the line was rather small and the analogous line based on intra-day lows was not broken so far. Consequently, the situation deteriorated only slightly and at the same time, the risk of a corrective upswing is still present.
The employment statistics will be released tomorrow, so we could see some fireworks in the gold market and in light of the support levels that are very close, a bigger (but not huge) rally could follow. It doesn’t seem likely that gold would move above $1,350 based on the above, but a move to $1,330 - $1,340 could be seen and it would not change the bearish trend.
The above remains up-to-date. Gold moved to the rising support line based on intra-day lows and rallied back up. The reversal was not accompanied by significant volume, so it’s not particularly bearish by itself, but the fact that the support was reached is.

As far as the USD Index is concerned, we wrote the following yesterday:
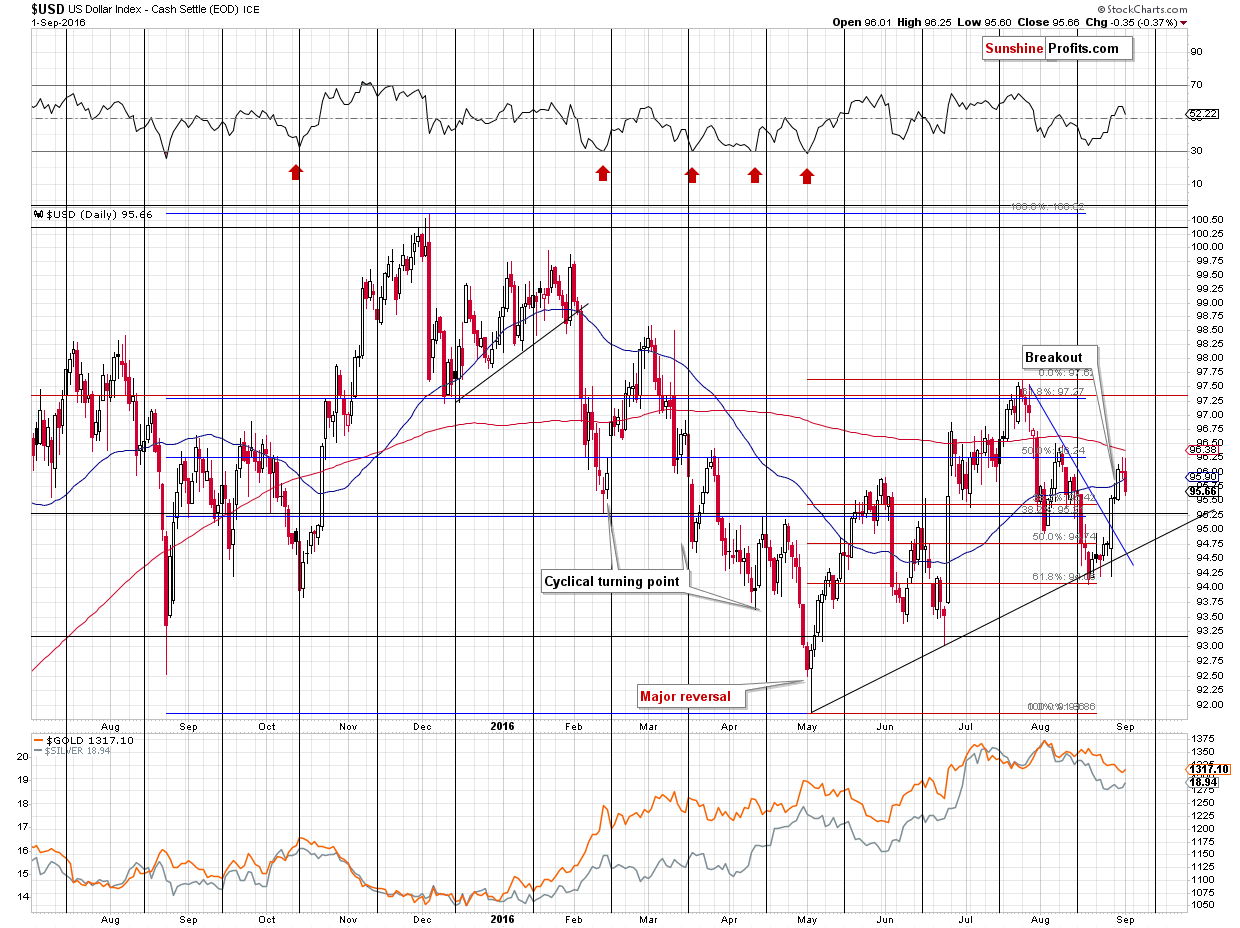
What about the USD Index? It's after a sharp rally and daily reversal, which suggests that a pause here is quite likely.
Moreover, it could be the case that the old turning point scheme is back – those, who have been following our analysis for years, know that there was a time when the USD Index’ turning points were not in the middle of the month, but at the beginning of each month. This changed some time ago, and the above chart reflects the new turning points, but based on how the USD performed in the past several months, it could be the case that the previous way of reversing direction is back.
Beginning of January marked a local top. Beginning of February marked a local top. The same with the beginning of March. We didn’t see the same effect in April, but at the beginning of May, we saw a major bottom. Beginning of June marked a local top, beginning of July marked a (small, but still) local bottom. Beginning of August marked a local bottom. In most cases, the first days of the month were accompanied by important turnarounds.
The USD Index is now after a rather sharp rally, it reversed yesterday on an intra-day basis and the major news announcement is just around the corner. Will we see a turnaround and a temporary decline (the main uptrend is likely to be upheld)? As always, there are no certainties in any market, but that does seem rather likely. More importantly, it is too likely and the USD Index is too important for metals and mining stocks to keep the speculative short positions in the precious metals sector intact.
The USD Index has indeed declined, just like it was likely to, but since no meaningful support was reached, it’s quite likely that the decline will continue for several more days. Moving close to the rising black support line before turning up again seems quite probable at this time. This is likely to have bullish consequences for the precious metals market. Still, if metals and miners fail to react to USD’s declines or the reaction is very weak, then it will serve as a bearish confirmation for PMs.
Summing up, another big decline in the precious metals sector is underway (which has been likely for weeks based i.a. on the 1983 analogy), but it does seem quite likely that a corrective upswing has just started. It seems that another trading opportunity is just around the corner (but not here just yet) and - as always – we will keep you – our subscribers – updated.
To summarize:
Trading capital (supplementary part of the portfolio; our opinion): No positions
Long-term capital (core part of the portfolio; our opinion): No positions
Insurance capital (core part of the portfolio; our opinion): Full position
Plus, you might want to read why our stop-loss orders are usually relatively far from the current price.
Please note that a full position doesn’t mean using all of the capital for a given trade. You will find details on our thoughts on gold portfolio structuring in the Key Insights section on our website.
As a reminder – “initial target price” means exactly that – an “initial” one, it’s not a price level at which we suggest closing positions. If this becomes the case (like it did in the previous trade) we will refer to these levels as levels of exit orders (exactly as we’ve done previously). Stop-loss levels, however, are naturally not “initial”, but something that, in our opinion, might be entered as an order.
Since it is impossible to synchronize target prices and stop-loss levels for all the ETFs and ETNs with the main markets that we provide these levels for (gold, silver and mining stocks – the GDX ETF), the stop-loss levels and target prices for other ETNs and ETF (among other: UGLD, DGLD, USLV, DSLV, NUGT, DUST, JNUG, JDST) are provided as supplementary, and not as “final”. This means that if a stop-loss or a target level is reached for any of the “additional instruments” (DGLD for instance), but not for the “main instrument” (gold in this case), we will view positions in both gold and DGLD as still open and the stop-loss for DGLD would have to be moved lower. On the other hand, if gold moves to a stop-loss level but DGLD doesn’t, then we will view both positions (in gold and DGLD) as closed. In other words, since it’s not possible to be 100% certain that each related instrument moves to a given level when the underlying instrument does, we can’t provide levels that would be binding. The levels that we do provide are our best estimate of the levels that will correspond to the levels in the underlying assets, but it will be the underlying assets that one will need to focus on regarding the signs pointing to closing a given position or keeping it open. We might adjust the levels in the “additional instruments” without adjusting the levels in the “main instruments”, which will simply mean that we have improved our estimation of these levels, not that we changed our outlook on the markets. We are already working on a tool that would update these levels on a daily basis for the most popular ETFs, ETNs and individual mining stocks.
Our preferred ways to invest in and to trade gold along with the reasoning can be found in the how to buy gold section. Additionally, our preferred ETFs and ETNs can be found in our Gold & Silver ETF Ranking.
As always, we'll keep you - our subscribers - updated should our views on the market change. We will continue to send out Gold & Silver Trading Alerts on each trading day and we will send additional Alerts whenever appropriate.
The trading position presented above is the netted version of positions based on subjective signals (opinion) from your Editor, and the Tools and Indicators.
As a reminder, Gold & Silver Trading Alerts are posted before or on each trading day (we usually post them before the opening bell, but we don't promise doing that each day). If there's anything urgent, we will send you an additional small alert before posting the main one.
=====
Latest Free Trading Alerts:
Today, the Bureau of Labor Statistics is due to release the report about the employment situation in August. What can we expect and how can it affect the gold market?
August Payrolls Preview and Gold
As the British referendum is behind us, the most important political risk is the outcome of the U.S. presidential election. We invite you to read our today’s article presenting the theory of political business cycle and find out what is the relationship between elections, financial markets and the precious metals market.
Political Business Cycle and Gold
=====
Hand-picked precious-metals-related links:
PRECIOUS-Gold slips on firm dollar ahead of U.S. jobs data
Gold Volatility Falls to Lowest This Year Before U.S. Jobs Data
LAWRIE WILLIAMS: Central bank gold buying – what the media reports don’t really tell you
US Mint gold coin sales down 42% on year to 1.8 mt in August
UPDATE: Xetra, Deutsche Bank, Gold Delivery Story
=====
In other news:
Global markets brace for U.S. jobs data, seeking Fed clues
Treasuries Fall as Dollar Gains in Payrolls Countdown; Oil Rises
Full Employment Without Wage Jump Tests Fed Pining for Inflation
Pound’s Winning Run Extends to Third Week as Outlook Brightens
Rajoy or Not, Spain Stocks Are Flying With Small Caps Up 19%
=====
Thank you.
Sincerely,
Przemyslaw Radomski, CFA
Founder, Editor-in-chief, Gold & Silver Fund Manager
Gold & Silver Trading Alerts
Forex Trading Alerts
Oil Investment Updates
Oil Trading Alerts


