In short:Gold moved higher (to $1,255) just before this alert was posted / sent, but since it remains below the declining resistance line, the outlook hasn't changed and the information below remains up-to-date.
No changes and no positions. The situation on gold and silver charts has become more bearish and it is even more bearish in case of mining stocks, but not bearish enough to justify opening short positions.
Yesterday, gold and silver took a pause, while mining stocks declined. It seems as if miners were late to the party and played catch up. Let’s see what actually happened (charts courtesy of http://stockcharts.com.)
There were no changes on the long-term chart, so let’s jump right to the medium-term one.
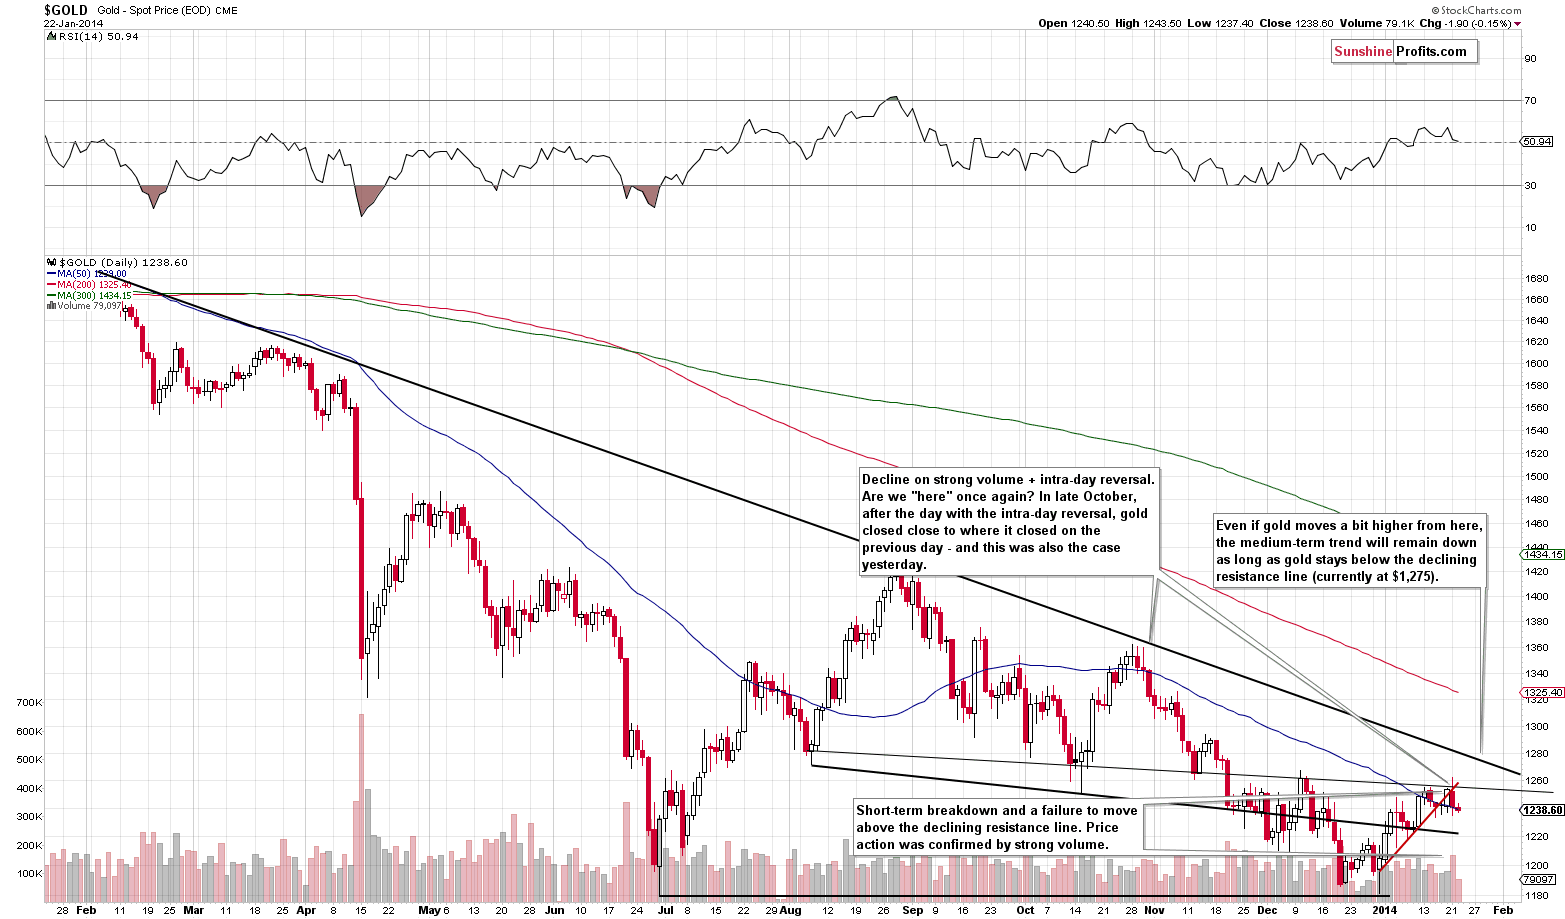
We have previously written that the current situation was similar to 2 cases from the past – one right at a local top and the second a few days before it. Yesterday’s session was similar to what we had previously seen when gold topped. This fits with the previous assumption about the self-similarity, and has bearish implications.
In particular, we saw a day without meaningful movement despite some intra-day action. This is what we have previously seen right after gold topped.
At the same time, gold closed below the rising short-term support/resistance line for the second day. One more close below it will mean that the breakdown has been confirmed.
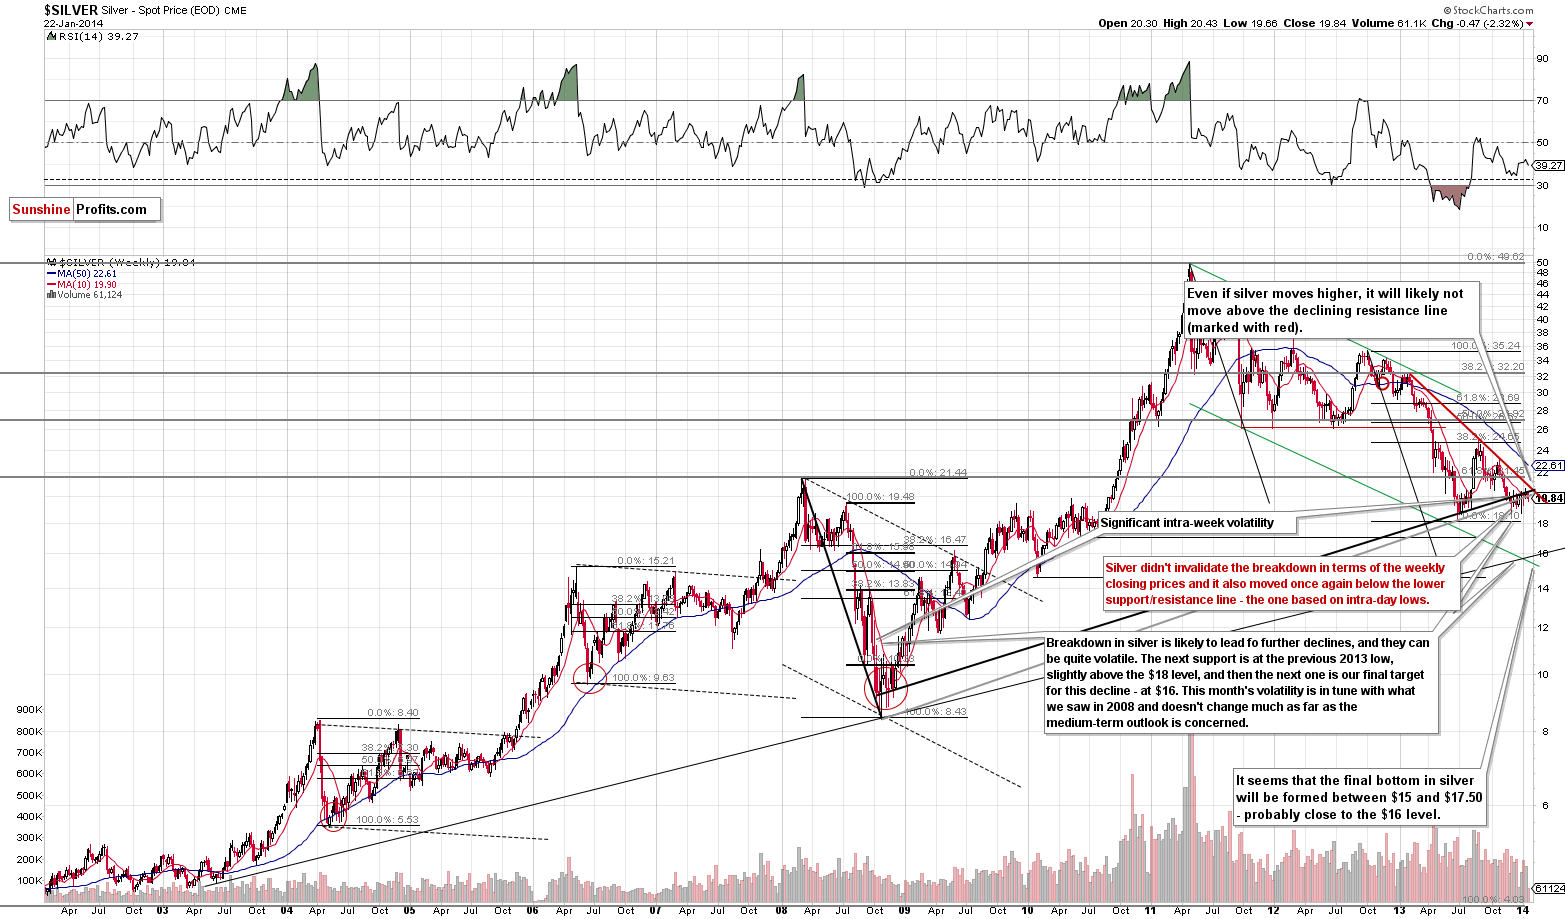
Silver moved significantly lower this week and the situation didn’t improve yesterday. The trend clearly remains down and the outlook deteriorated based on the breakdown below both rising long-term support/resistance lines.
Yesterday, we discussed in greater detail the relation between mining stocks and the underlying metals. Let’s check what these ratios did yesterday.
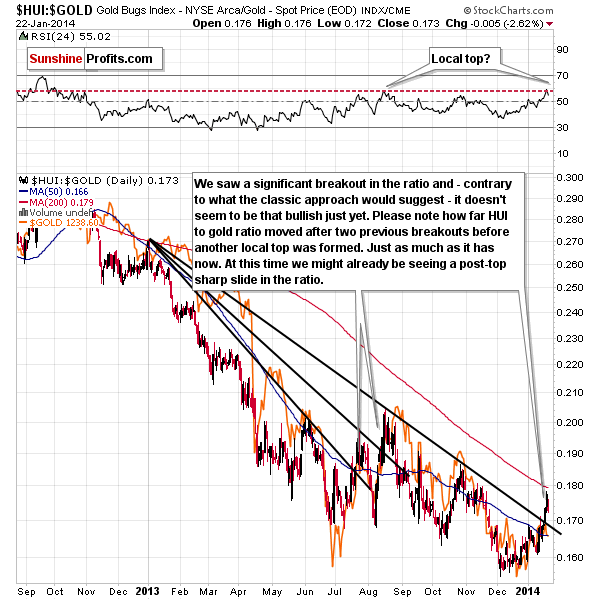
Miners corrected just as sharply as they rallied on Tuesday. The breakout has not been invalidated – at least not yet. We were expecting to see a price action that would be similar to what happened in July 2013 and August 2013 – a sharp pullback. This is exactly what we saw and at this time the situation remains in tune with both cases.
We already emphasized it yesterday, but it seems worth stressing one more time: a rally in miners relative to gold was a very bullish indication several years ago. However, for the last few years, this signal has not been working like it used to previously. In fact, we saw similarly encouraging strength in July and August 2013 – and this was when local tops were formed. There even were breakouts above declining resistance lines in both cases, just like what we’re seeing right now.
So, how bullish is it, really? "Mildly" is our best answer at this time.
What about silver stocks?
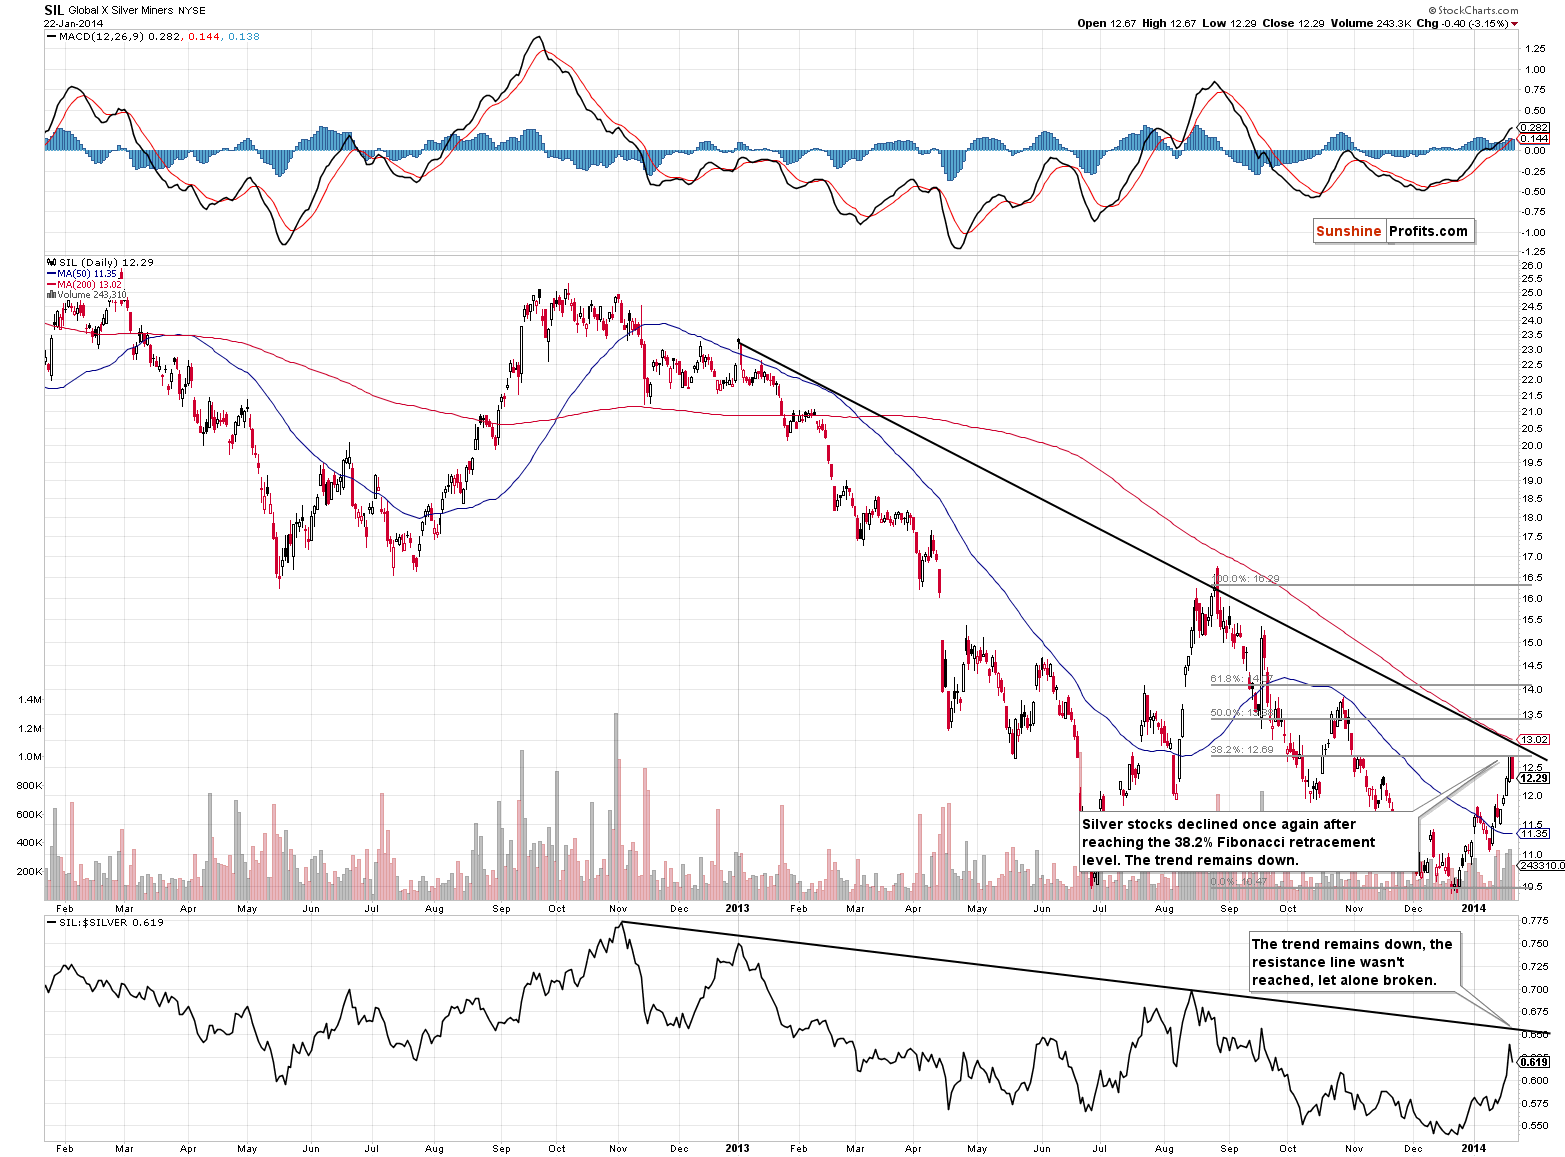
Silver stocks have corrected to the first of the classic Fibonacci retracement levels, the 38.2% retracement, and declined afterwards. This means that the trend remains down and all that what we saw was a correction.
The declining resistance lines (for silver stocks, and for their ratio to silver, which you can see in the lower part of the chart) were not broken and the trend remains down.
Let’s take a look at gold stocks themselves.
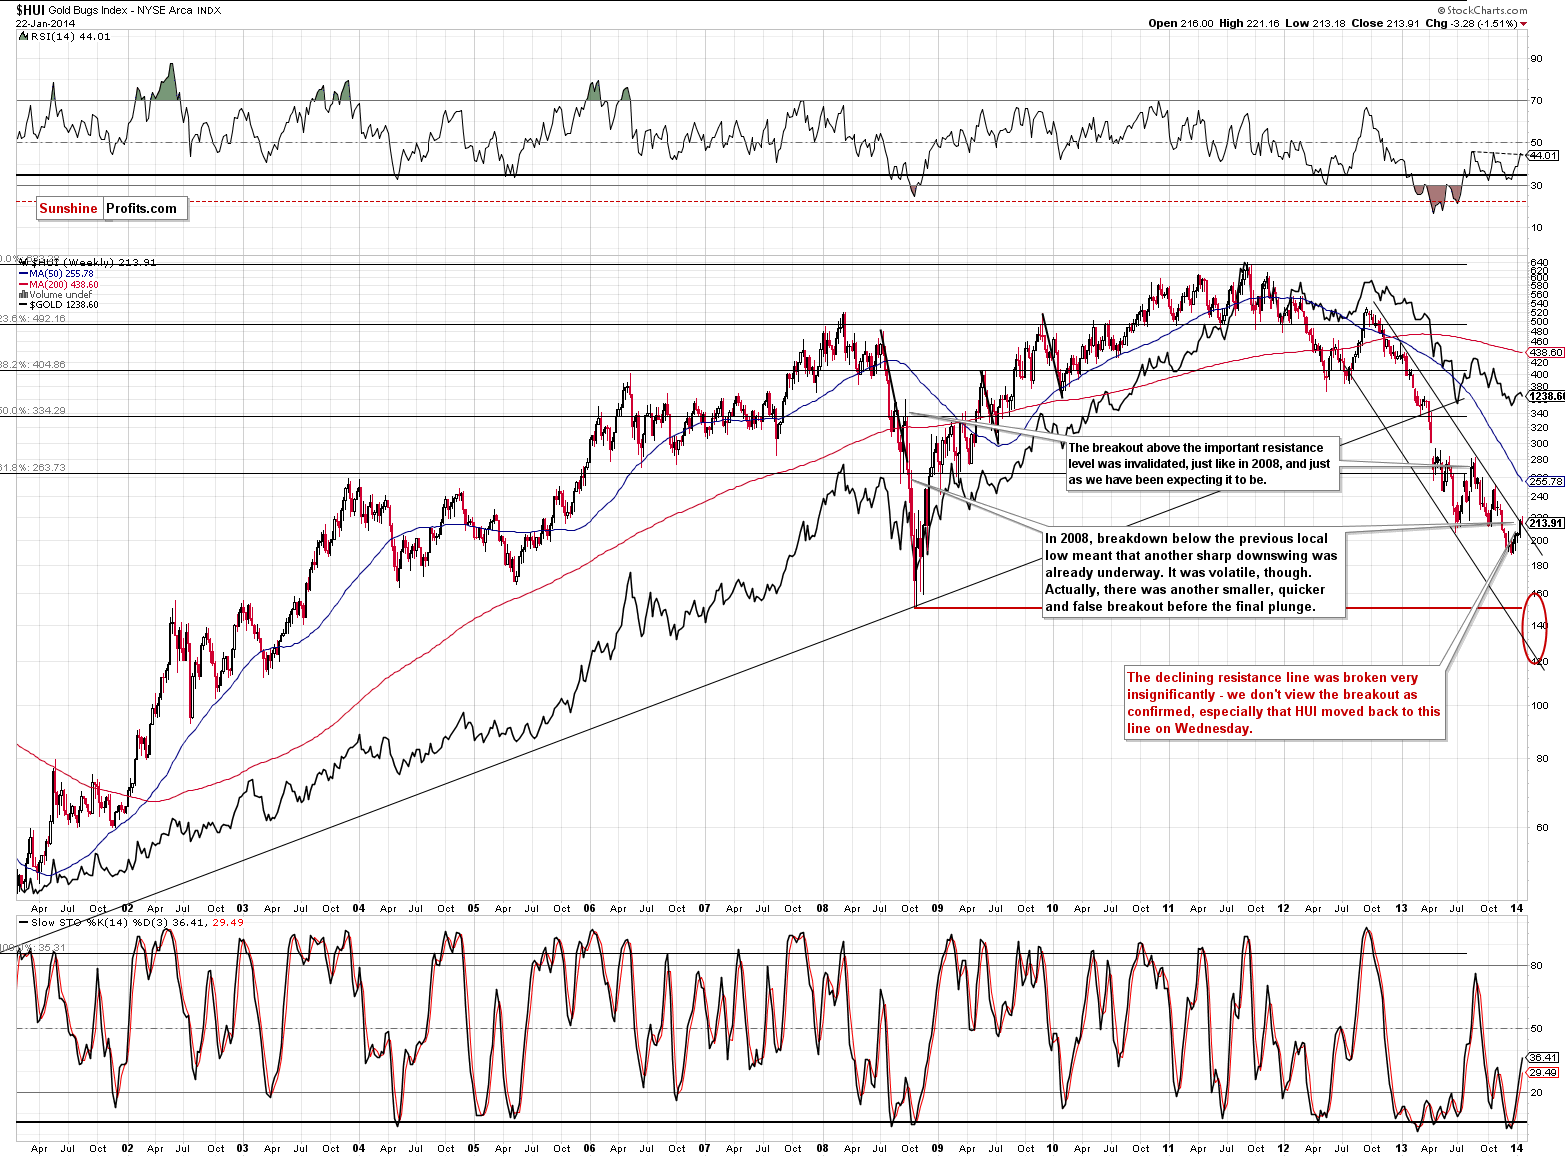
Gold miners moved sharply lower yesterday, after moving sharply higher on Tuesday. At this time they are right at the declining medium-term support line, and it’s unclear whether we saw a true breakout or one followed by its invalidation.
The situation was bullish yesterday, so it deteriorated based on the price action.
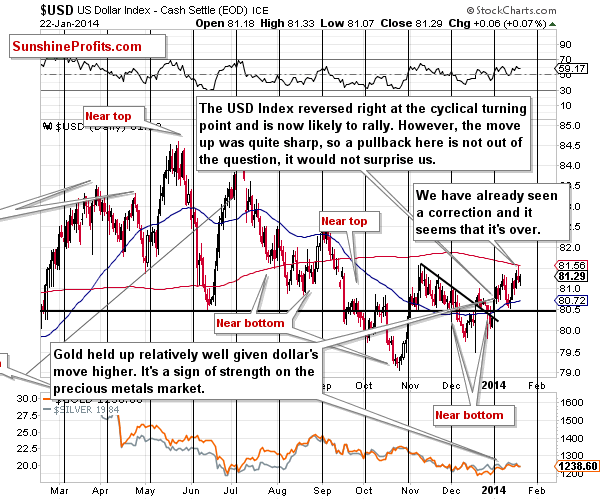
Meanwhile, the USD Index basically did nothing. Gold’s and silver’s reaction is very mildly bearish, and the miner’s reaction is bearish. However, they were very strong relative to what USD did, so at this time it just nullifies some of the previous bullishness. Overall, the analysis of the USD Index doesn’t imply much at this time. The USD Index is likely to rally, but at this time it’s unclear whether this will immediately translate into lower precious metals prices.
Taking all of the above into account, we get the same final result we got previously, even though the situation deteriorated slightly – the very short term (the next few days) is still rather unclear. If the HUI Index invalidates the breakout in terms of daily closing prices, we will quite likely suggest opening short positions.
To summarize:
- Trading capital: No positions.
- Long-term capital: No positions.
As always, we'll keep you - our subscribers - updated should our views on the market change. We will continue to send out Alerts on each trading day and we will send additional Gold & Silver Trading Alerts whenever appropriate.
The trading position presented above is the netted version of positions based on subjective signals from your Editor, and the automated tools (SP Indicators and the upcoming self-similarity-based tool).
As a reminder, Gold & Silver Trading Alerts are posted before or on each trading day (we usually post them before the opening bell, but we don't promise doing that each day). If there's anything urgent, we will send you an additional small alert before posting the main one.
Thank you.
Sincerely,
Przemyslaw Radomski, CFA


