Briefly: In our opinion, short (full) speculative positions in gold, silver and mining stocks are justified from the risk/reward point of view.
In yesterday’s second alert we wrote that the early rally was likely an overreaction based on the upcoming comments from the Fed. We emphasized that it’d been the case more than once that PMs moved initially higher before the FOMC meeting only to reverse and slide shortly thereafter. That’s exactly what happened. What’s next?
Basically, the outlook remains unchanged. The medium-term trend is down and the very short term remains unclear with several bearish signs pointing to lower prices in the near future.
Let’s take a look at the charts (charts courtesy of http://stockcharts.com).
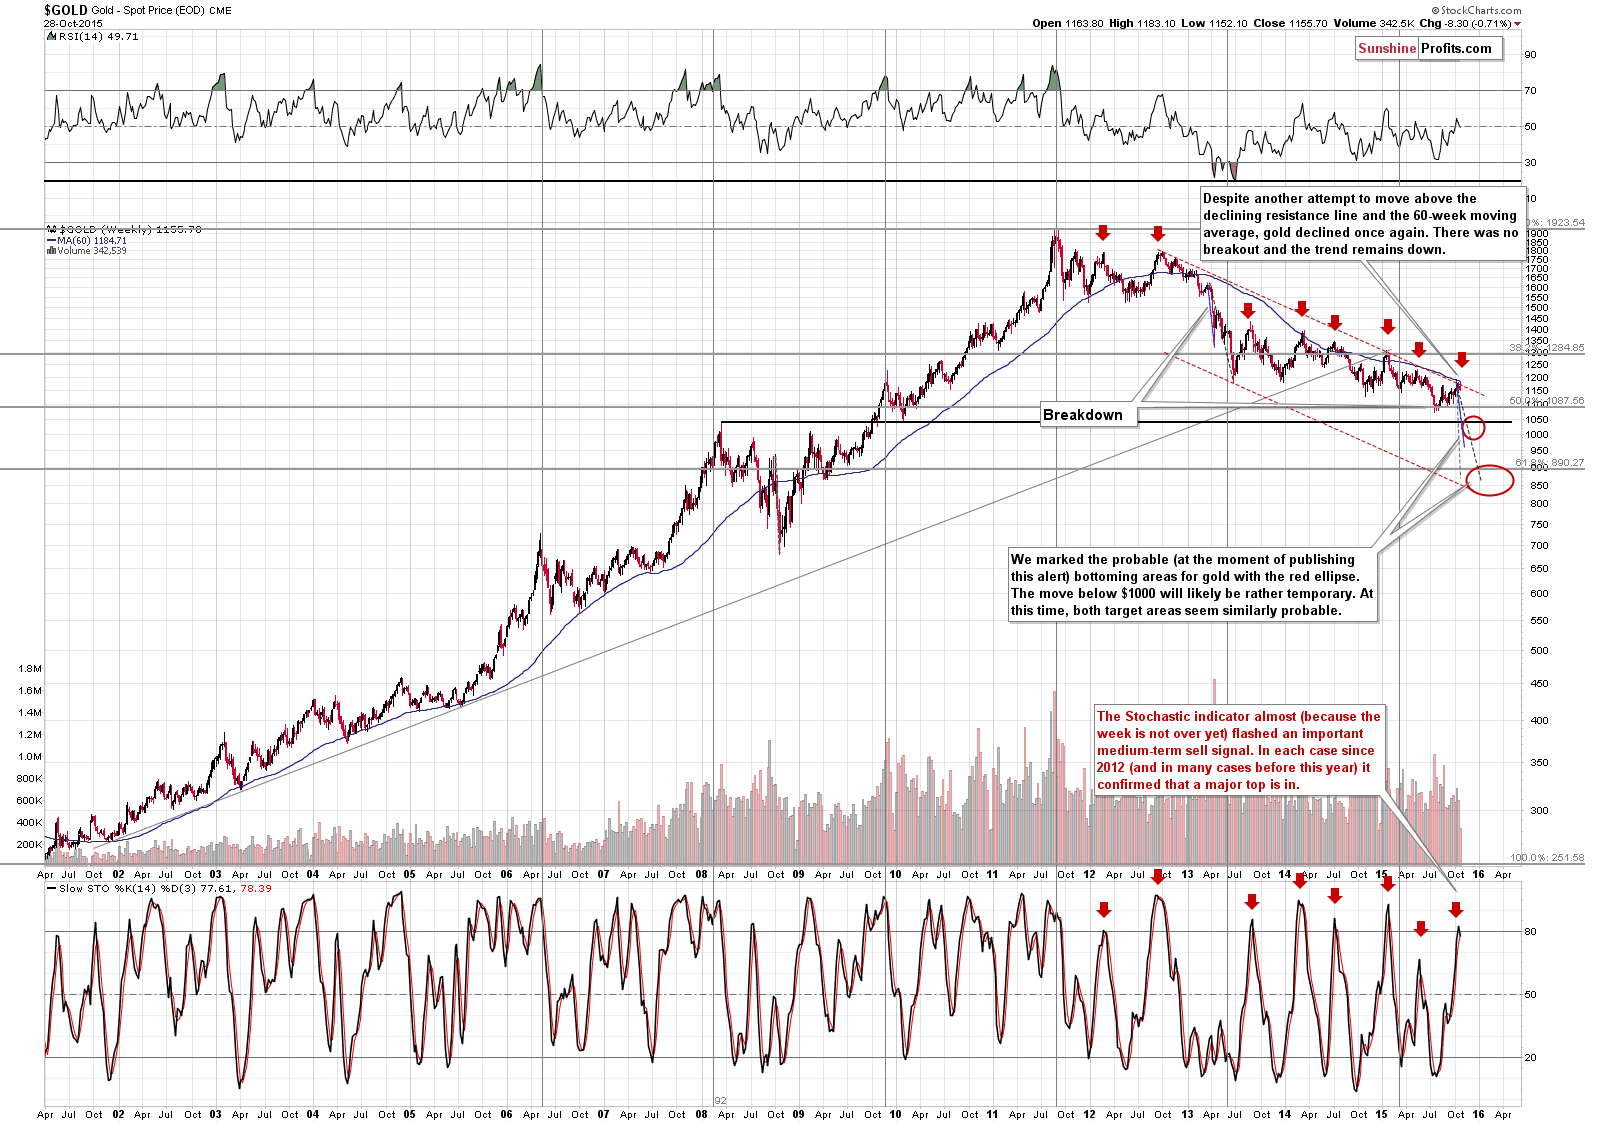
The key thing is that the medium-term trend remains down. Yesterday’s attempt to move above the 60-week moving average and the long-term declining resistance line were invalidated almost immediately. The invalidation on its own is a bearish sign.
The sell signal from the Stochastic indicator is almost in. The indicator is based on weekly closing prices, so since the week isn’t over yet, it’s difficult to say that this signal will indeed be flashed, but it’s likely as all gold has to do in order for the sell signal to materialize is to do nothing.
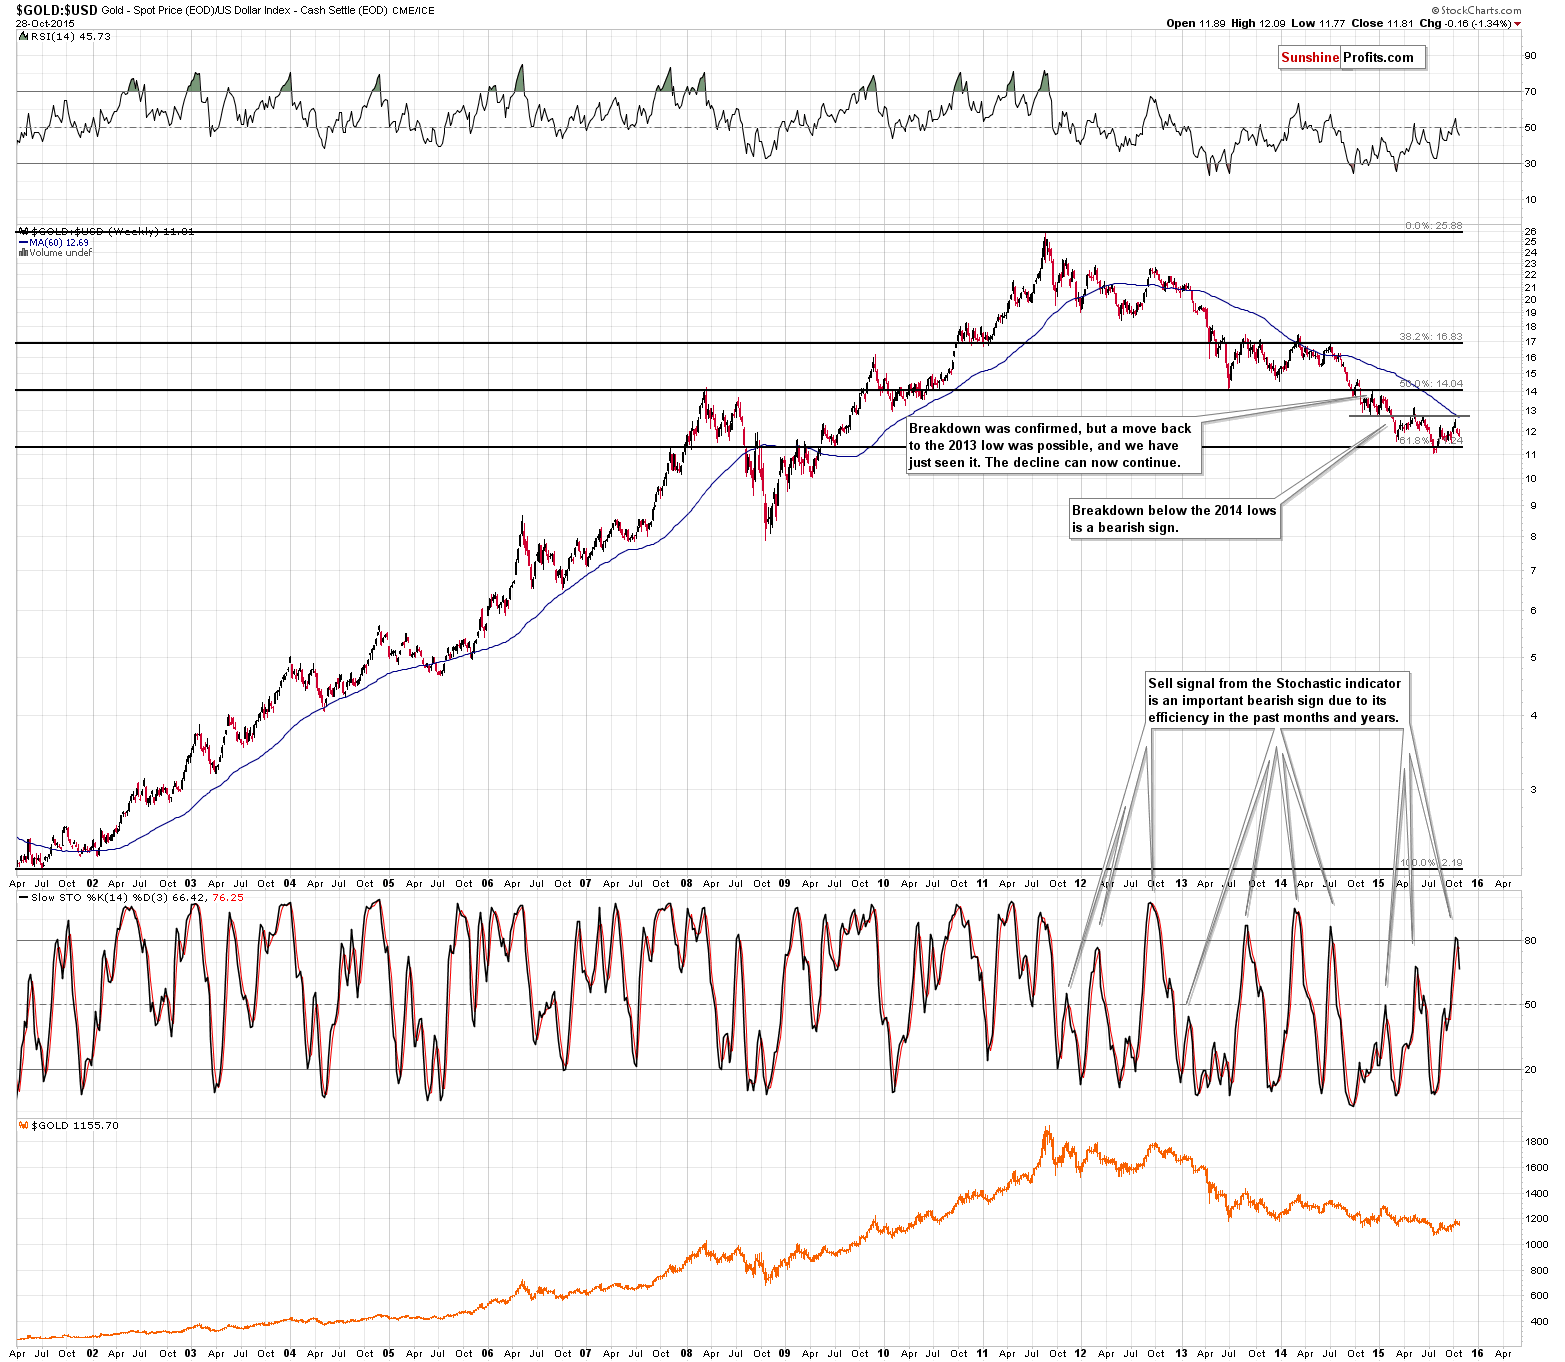
We can see this signal even more clearly in the case of the gold to USD Index ratio. This ratio has no clear economic interpretation, but it’s useful in technical terms – for confirming or invalidating other signals. At this time we clearly see the sell signal from the Stochastic indicator. Again, the week is not over, but still, it’s quite clearly visible, so it increases the odds that this signal will be seen in gold as well based on Friday’s closing price.
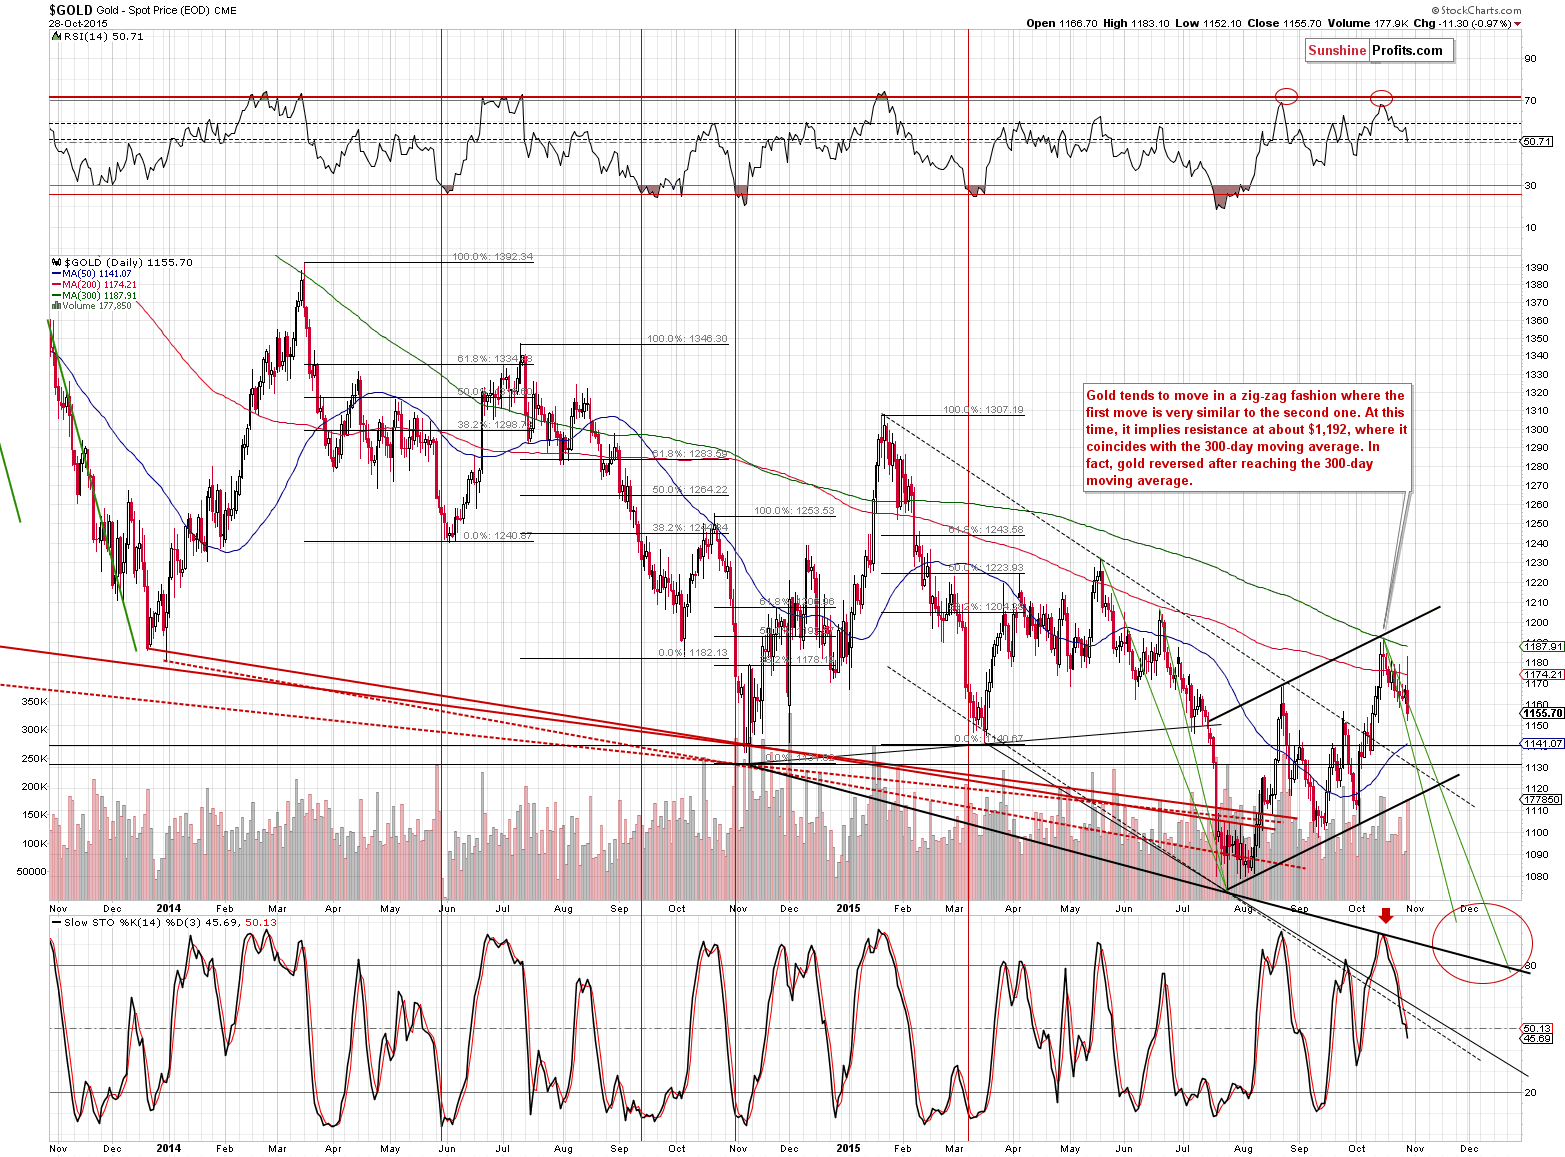
The short-term gold chart shows that gold is still declining at the pace it usually declines (note the green lines on the above chart), so it’s not odd or unexpected that it’s not plunging yet.
The interesting and important thing is that gold reversed on huge volume despite an early rally yesterday. This kind of action is something that we’ve seen many times in the past, before and after major announcements and that’s (plus based on more than a decade of daily analysis of the precious metals market and related ones) why we knew that acting upon the initial rally or viewing it as market’s true direction was improper to say the least.
Why did the market behave like this? In all likelihood (we can’t prove it), in our opinion, it was the case that some big players wanted to profit on the anxiety before the announcement. Likely someone who knew what would be announced. All it took to profit on it was to trigger an initial rally and wait a few hours for people to jump on the bandwagon and then – after a bigger rally – exit longs and enter shorts. The announcement did the rest. Those jumping on the bandwagon got burned and those who tricked them, profited.
Another theory is that people got way too emotional about what could have happened (and the number of questions that we received after this relatively small rally – because a $10-$15 move is a relatively small move – and the short-term outperformance of silver seem to confirm that) if the rates hadn’t been increased (eventually, they weren’t) or even had been lowered (they weren’t either) – the investors started buying before the actual announcement. This became a self-fulfilling prophecy and gold, silver and miners continued to rally – until the actual news was released. Since the trend is down and market had dovish expectations regarding the FOMC comments, it’s not surprising that the actual surprise was to the downside.
What really happened? Perhaps a mix of both of the above scenarios. The important thing is not what really happened but that it’s an inherent part of the market and we have to deal with it, instead of following emotions. Dealing with it in this case means making sure that the move that we are focusing on is indeed justified by what’s happening, looking at multiple other things than the price itself, and finally, waiting for a confirmation before acting upon something. It’s difficult to do, but in case of investing and trading, it’s usually the case that something is either easy to do or profitable. We’ll continue to focus on the latter while monitoring the markets and reporting to you accordingly.
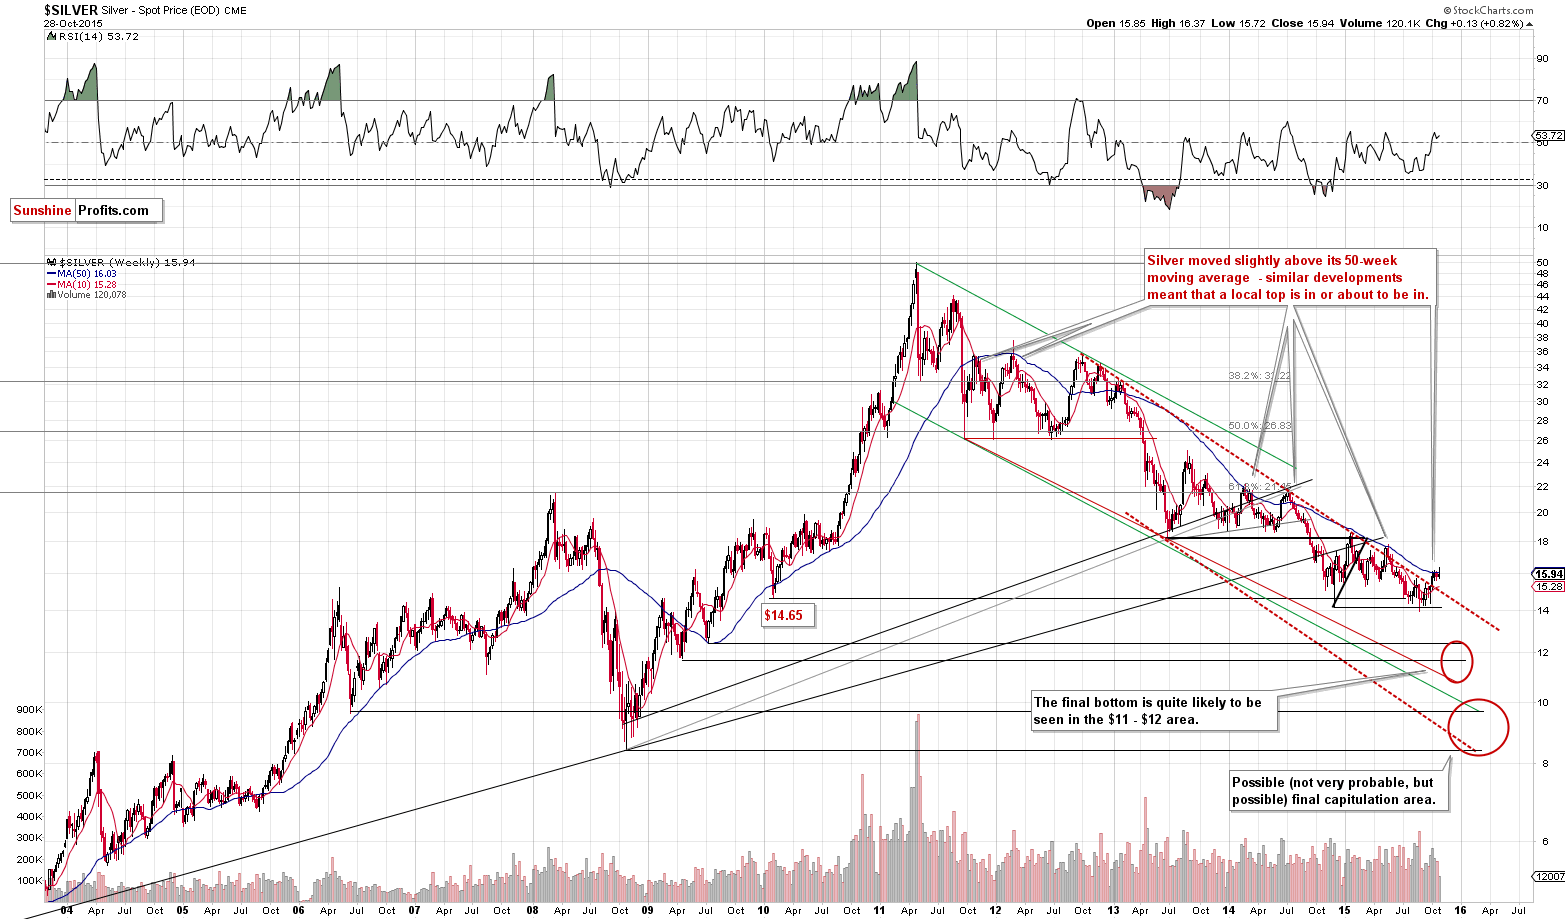
Silver moved temporarily higher yesterday, but closed back below the 50-week moving average. That’s something similar to what we saw at previous local tops and the implications are bearish.
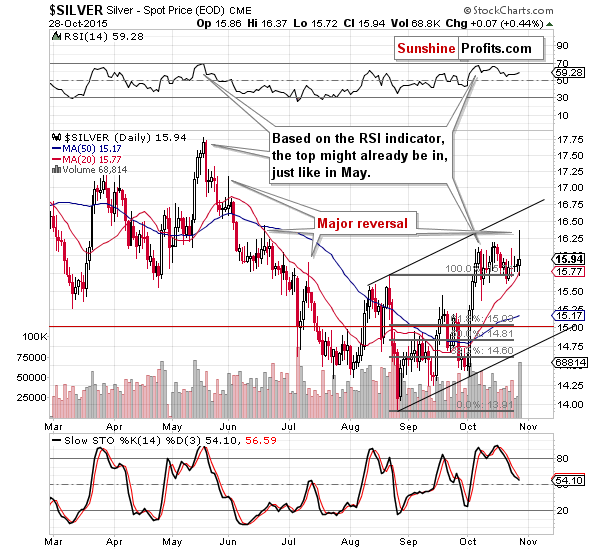
The interesting thing is that silver formed a daily reversal on huge volume. That’s a clear bearish sign for the short term – a one that we saw at previous local tops. Moreover, please note that on an intra-day basis, silver greatly outperformed gold, which is another bearish sign (such short-term outperformance periods very often preceded declines).
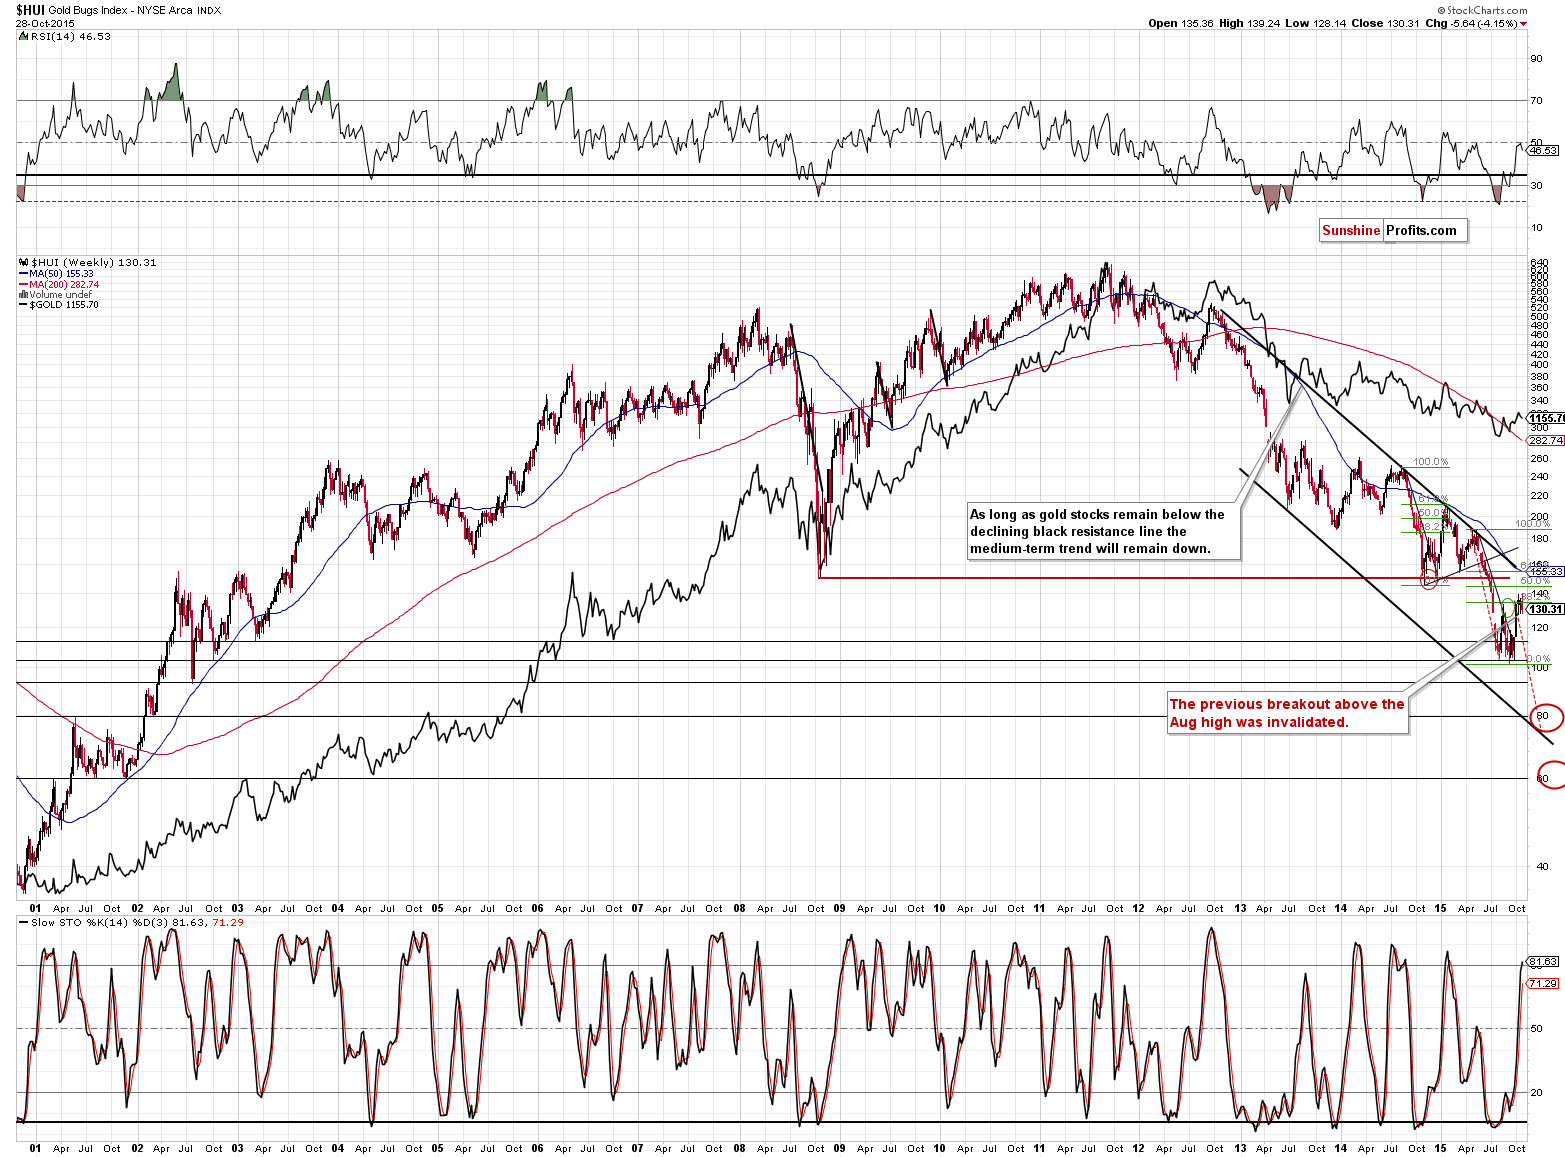
Gold stocks have moved lower this week and the breakout above the August high was once again invalidated. More importantly, please note that the Stochastic indicator moved above the 80 line. Each time (!) after 2011 (and many times before 2011) this (the sell signal served as a confirmation) meant that the local top was in or very close to being in and that short positions, not long ones, should’ve been strongly considered.
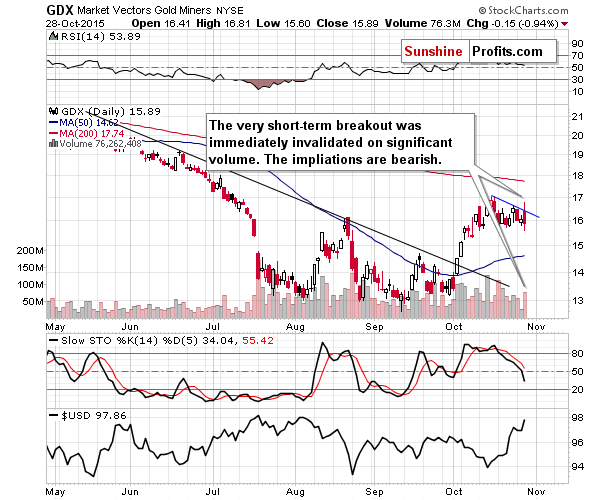
On a short-term basis, mining stocks tried to move above the very short-term declining resistance line, but failed to do so and closed lower. The reversal took place on significant volume and the implications are bearish.
Summing up, the pre-announcement rally that we saw yesterday was quickly invalidated and so were the corresponding breakouts. The key thing is that multiple bearish signals that we’ve described in the recent alerts remain in place and continue to have very bearish implications for the medium term. While the situation and outlook for the next few days are still rather unclear (although more bearish than not), the medium-term outlook remains clearly bearish. Again, based on multiple signals that we have right now, it seems that the next big move will be to the downside and being positioned to take advantage of it remains justified from the risk/reward point of view. The next big downswing in PMs may be triggered by a breakout in the USD Index, which seems to be just around the corner. It seems likely that the current short position will further increase our profitability.
As always, we will keep you – our subscribers – updated.
To summarize:
Trading capital (our opinion): Short position (full) position in gold, silver and mining stocks is justified from the risk/reward perspective with the following stop-loss orders and initial (! – this means that reaching them doesn’t automatically close the position) target prices:
- Gold: initial target price: $1,050; stop-loss: $1,223, initial target price for the DGLD ETN: $98.37; stop loss for the DGLD ETN $62.34
- Silver: initial target price: $12.60; stop-loss: $16.73, initial target price for the DSLV ETN: $96.67; stop loss for DSLV ETN $40.28
- Mining stocks (price levels for the GDX ETF): initial target price: $11.57; stop-loss: $18.13, initial target price for the DUST ETF: $26.61; stop loss for the DUST ETF $9.22
In case one wants to bet on junior mining stocks' prices (we do not suggest doing so – we think senior mining stocks are more predictable in the case of short-term trades – if one wants to do it anyway, we provide the details), here are the stop-loss details and initial target prices:
- GDXJ ETF: initial target price: $16.27; stop-loss: $25.23
- JDST ETF: initial target price: $46.47; stop-loss: $15.58
Long-term capital (our opinion): No positions
Insurance capital (our opinion): Full position
Please note that a full position doesn’t mean using all of the capital for a given trade. You will find details on our thoughts on gold portfolio structuring in the Key Insights section on our website.
As a reminder – “initial target price” means exactly that – an “initial” one, it’s not a price level at which we suggest closing positions. If this becomes the case (like it did in the previous trade) we will refer to these levels as levels of exit orders (exactly as we’ve done previously). Stop-loss levels, however, are naturally not “initial”, but something that, in our opinion, might be entered as an order.
Since it is impossible to synchronize target prices and stop-loss levels for all the ETFs and ETNs with the main markets that we provide these levels for (gold, silver and mining stocks – the GDX ETF), the stop-loss levels and target prices for other ETNs and ETF (among other: UGLD, DGLD, USLV, DSLV, NUGT, DUST, JNUG, JDST) are provided as supplementary, and not as “final”. This means that if a stop-loss or a target level is reached for any of the “additional instruments” (DGLD for instance), but not for the “main instrument” (gold in this case), we will view positions in both gold and DGLD as still open and the stop-loss for DGLD would have to be moved lower. On the other hand, if gold moves to a stop-loss level but DGLD doesn’t, then we will view both positions (in gold and DGLD) as closed. In other words, since it’s not possible to be 100% certain that each related instrument moves to a given level when the underlying instrument does, we can’t provide levels that would be binding. The levels that we do provide are our best estimate of the levels that will correspond to the levels in the underlying assets, but it will be the underlying assets that one will need to focus on regarding the sings pointing to closing a given position or keeping it open. We might adjust the levels in the “additional instruments” without adjusting the levels in the “main instruments”, which will simply mean that we have improved our estimation of these levels, not that we changed our outlook on the markets. We are already working on a tool that would update these levels on a daily basis for the most popular ETFs, ETNs and individual mining stocks.
Our preferred ways to invest in and to trade gold along with the reasoning can be found in the how to buy gold section. Additionally, our preferred ETFs and ETNs can be found in our Gold & Silver ETF Ranking.
As always, we'll keep you - our subscribers - updated should our views on the market change. We will continue to send out Gold & Silver Trading Alerts on each trading day and we will send additional Alerts whenever appropriate.
The trading position presented above is the netted version of positions based on subjective signals (opinion) from your Editor, and the Tools and Indicators.
As a reminder, Gold & Silver Trading Alerts are posted before or on each trading day (we usually post them before the opening bell, but we don't promise doing that each day). If there's anything urgent, we will send you an additional small alert before posting the main one.
=====
Latest Free Trading Alerts:
Yesterday, the Fed opened doors for an interest rate hike in December. What does it imply for the gold market?
Fed Surprisingly Hawkish in October
Although the U.S. Federal Reserve kept interest rates unchanged yesterday, the bank signalized that a December interest rate hike was still on the table. Thanks to this news, the USD Index rallied to its highest level since Aug 10 and hit an intraday high of 97.89. As a result, EUR/USD declined sharply and reached important support area. Will it withstand the selling pressure in the coming days?
Forex Trading Alert: EUR/USD – North or South?
=====
Hand-picked precious-metals-related links:
World’s biggest gold miners answer price slump with more output
Better prospects for gold on the horizon – GFMS
=====
In other news:
Deutsche Bank to shed 35,000 jobs, exit 10 countries
Is it up or down? America is a tale of 2 economies
GOP candidates slam Bernanke and the Fed
700 Years of Swedish Prices Contrast Plague With Globalization
Fed pushes euro to August low against dollar
Bank of China's Profit Slips for First Time Since '09 Crisis
China Abandons Three-Decade-Old One-Child Policy to Lift Growth
=====
Thank you.
Sincerely,
Przemyslaw Radomski, CFA
Founder, Editor-in-chief
Gold & Silver Trading Alerts
Forex Trading Alerts
Oil Investment Updates
Oil Trading Alerts


