Briefly: In our opinion, speculative short positions in gold and silver (half) and a speculative short position in mining stocks (full) are justified from the risk/reward point of view.
Gold soared last week, mainly on Yellen’s remarks on NIRP and we can say mostly the same about silver and mining stocks. However, the margins for gold futures contracts were increased at the end of the week (it was announced on Thursday) and gold gave away some of its previous gains. Was the decline anything more than just a small correction? Is the rally already over?
In short, we think it’s too early to say that the rally is certainly over, but it seems that the rally’s days are numbered.
Before commenting on the technical details, we would like to quote our previous comments on Yellen’s reply regarding NIRP as it’s very important and remains up-to-date.
Here’s what Janet Yellen said last week:
We had previously considered them and decided that they would not work well to foster accommodation back in 2010. In light of the experience of European countries and others that have gone to negative rates, we are taking a look at them again, because we would want to be prepared in the event that we needed to add accommodation. We haven’t finished that evaluation. We need to consider the U.S. institutional context and whether they would work well here. It’s not automatic. There are a number of things to consider. So I wouldn’t take those off the table, but we would have work to do to judge whether they would be workable.
Here’s how it looks at the first sight: not only are rates not going higher – they will be lowered, perhaps even to negative levels. Plus, the Fed has lost its credibility (if it had any in the first place) and the only sure bet now is gold.
The above is what the markets reacted to.
However… She said that they were considering whether NIRP would be efficient in the event it was needed – not that it is needed or likely to become needed anytime soon.
Again, she doesn’t say that they are considering implementing NIRP. She said that they are investigating its usefulness. The difference in implications is huge. If she didn’t say anything really dovish then yesterday’s large rally is just a misunderstanding and likely to be something temporary.
Moreover, what was the question again? If things go south, are you considering NIRP?
Whether Janet Yellen thinks NIRP is likely or not, justified or not, wise or not, whatever or not – she had to reply that she is considering them. Why? For multiple reasons. Saying that she doesn’t consider NIRP makes her look unprofessional – it’s not wise to ignore tools, options and things that might be done without giving it some thought. She can very well never introduce NIRP, but she has to consider it. Moreover, if things went south, she didn’t introduce NIRP but other monetary authorities did and the other economies performed better than the U.S., it would be very bad for her and it would appear to be her fault as she hadn’t even considered this option. Whether some legal action against her would then be possible is unknown, but it would definitely not be pleasant to be judged by history as the one that didn’t even want to think NIRP through before dismissing it.
If she had to reply that she was considering NIRP, what implications can really be drawn based on the fact that she said what she had to say? None. Did she say that negative rates were likely? No. Did she say that lower interest rates are likely? No. Did she say that the rates will not be increased again? No. She only said that she will consider NIRP if things go south – something that she is forced to consider given her profession. Whether she would introduce them is a different matter.
The investors’ reaction toward comments that were unpredictable themselves (as the questions weren’t predictable) might have been incorrect. (…) The important thing is that even relatively random events can have implications that last longer than one day if important support/resistance levels are broken – and they were broken [last week].
Having said the above, let’s take a look at the charts (charts courtesy of http://stockcharts.com).
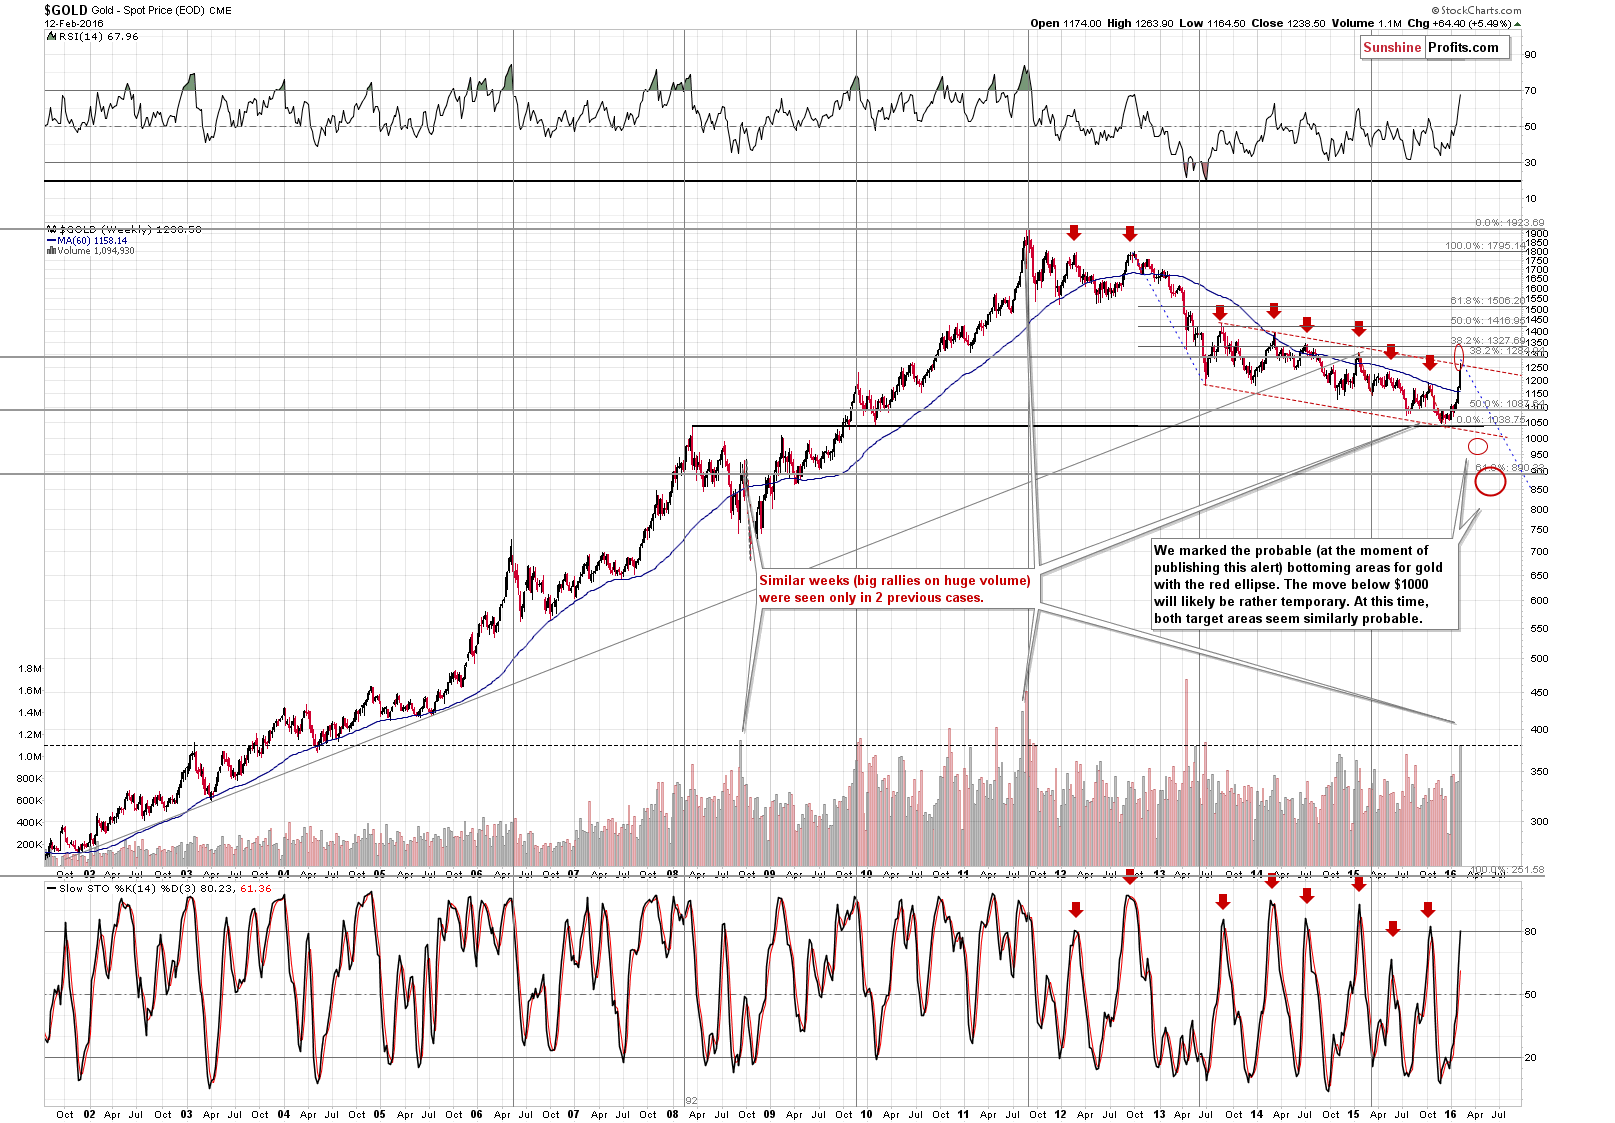
Our previous comments on the above chart remain up-to-date:
Gold moved to the upper part of the declining trend channel. The red dashed lines represent a very long flag pattern that has been in place since 2013. This could be enough to stop the rally, but it might be the case that gold moves even higher temporarily based on the breakout above the May 2015 high. The next resistance levels are the 2015 top ($1,308) and the 38.2% Fibonacci retracement level based on the entire 2011-2015 decline ($1,328).
The volume that we have already seen this week is big and the week is not over yet. It’s very likely that when we add Friday’s volume, we’ll have an amount not seen in more than a year. When did we see such high readings of weekly volume? At the 2011 top and at the 2008 top right before the final plunge (and right after a sharp corrective upswing). In case the volume does not end up as extremely high (but still very high) as in 2008 and 2011, the implications will still be bearish as several other local tops formed on similar volume in the past.
All in all, it still seems that we are seeing a big corrective upswing and it’s unclear whether this upswing is completely over at this time. Regardless of the very exaggerated reason to rally yesterday, gold broke higher sharply and it could need to rally even higher before it reverses. We plan to re-enter the short position after seeing additional confirmations.
Is it possible that gold will not move to new lows but instead keeps rallying? Yes, of course, it is possible, but we don’t think it’s likely. Are we considering getting back in the precious metals market with the long-term investment capital? Yes, we are considering it and we have been considering it previously, however, we continue to think that – after considering it – it’s not a good idea to do so, as the current move higher seems to be something temporary and if it hadn’t been for a combination of external factors gold would have already been much lower. We haven’t seen confirmations that the final bottom is in and we think that gold will most likely move lower in the coming months and weeks.
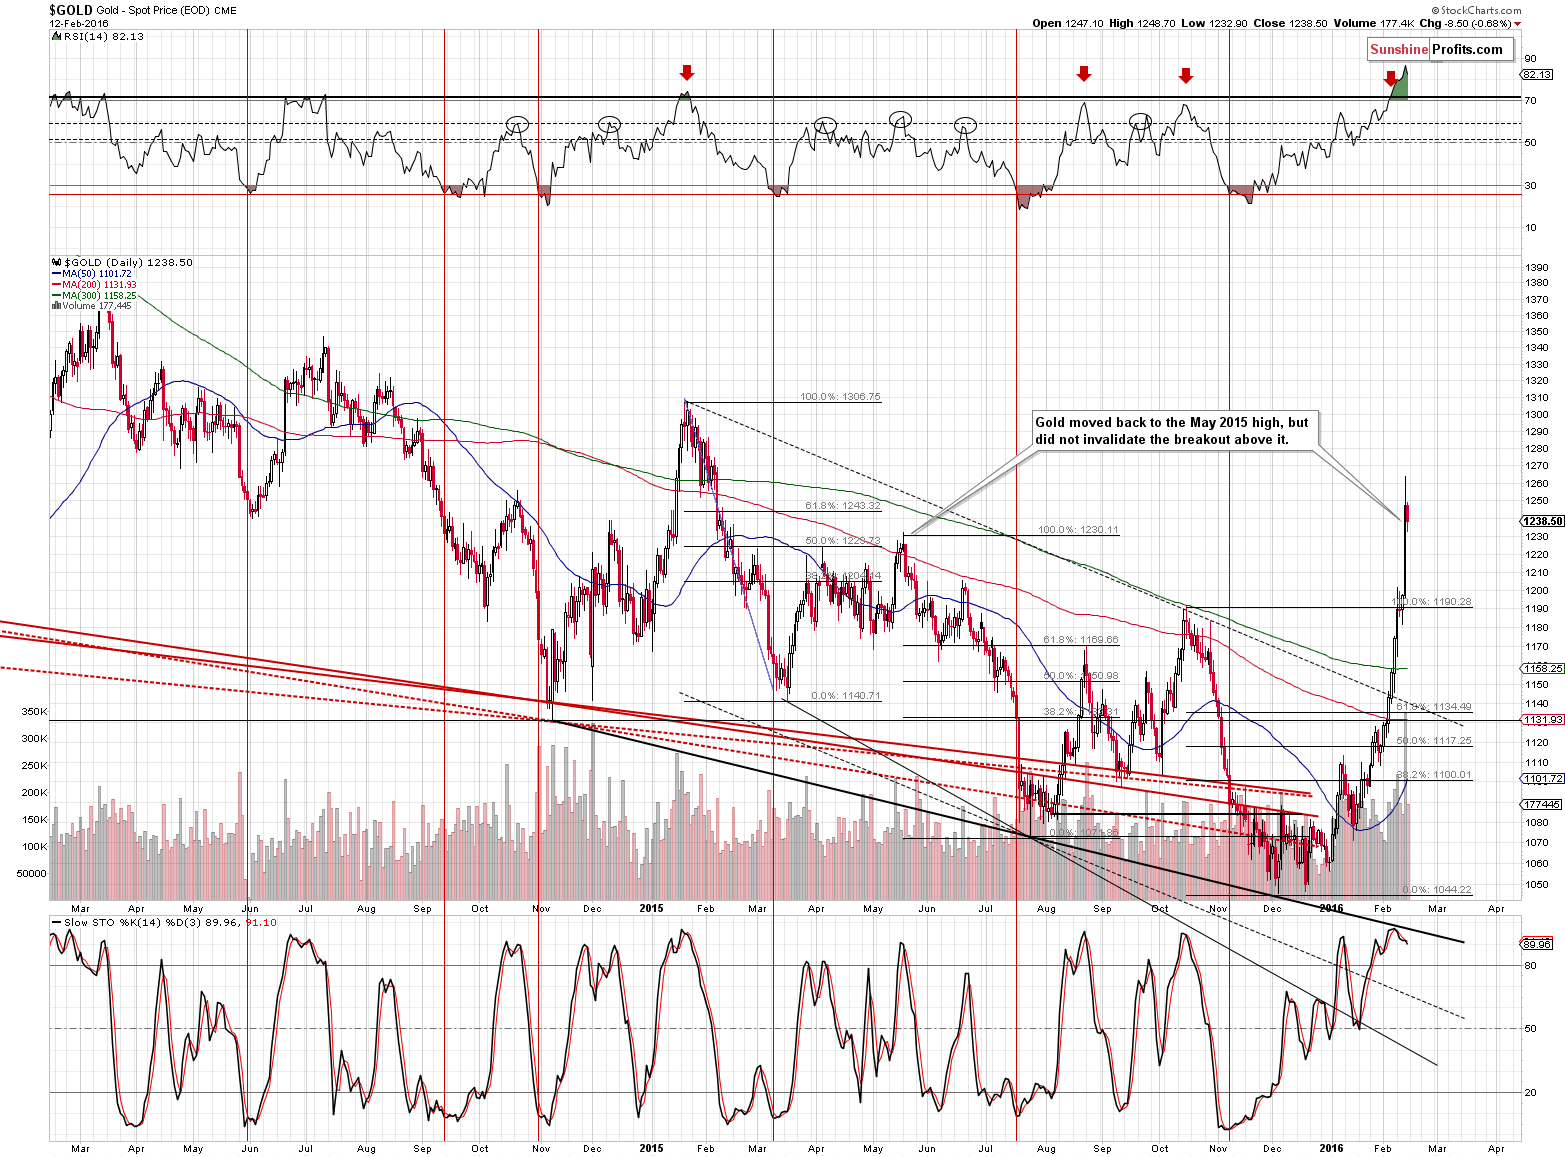
On a short-term basis, the announcement of increased margins on gold futures contracts seems to have triggered a move lower, but the important thing is that gold didn’t move below the previous high. Without an invalidation of the most recent breakout, we can’t say that we have seen a bearish confirmation.
However, the huge downswing that we are seeing in today´s pre-market trading is something that serves as an important bearish sign and given the recent volatility to the upside, we can also expect huge volatility to the downside. Consequently, it seems that re-opening short positions at this time is justified from the risk-reward point of view.
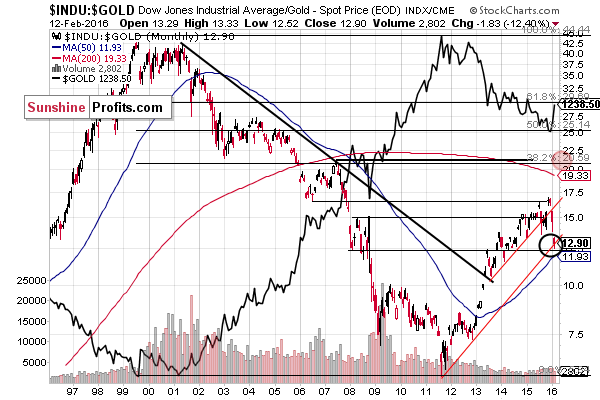
The Dow to gold ratio moved sharply lower as gold moved higher and the general stock market plunged. However, the ratio moved to its long-term rising support line and the trend in the ratio – and gold – is likely to reverse any day now, perhaps right away.
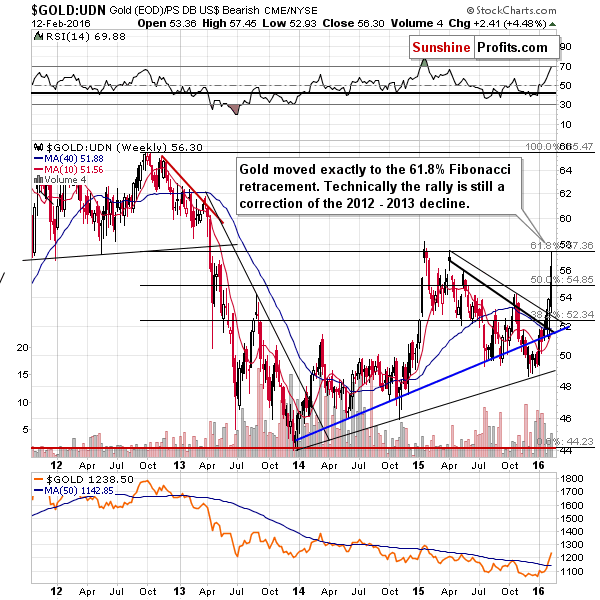
Gold seen from the non-USD perspective (the average of gold prices seen in currencies other than the US dollar) moved to its 61.8% Fibonacci retracement level, which is likely to stop the rally. However, we can’t rule out another small move higher, just like what we saw in early 2015. Still, both tops seen in the gold to UDN ratio close to the 61.8% Fibonacci retracement corresponded to important tops in gold as well. The odds are, therefore, that a top in gold is also at hand.
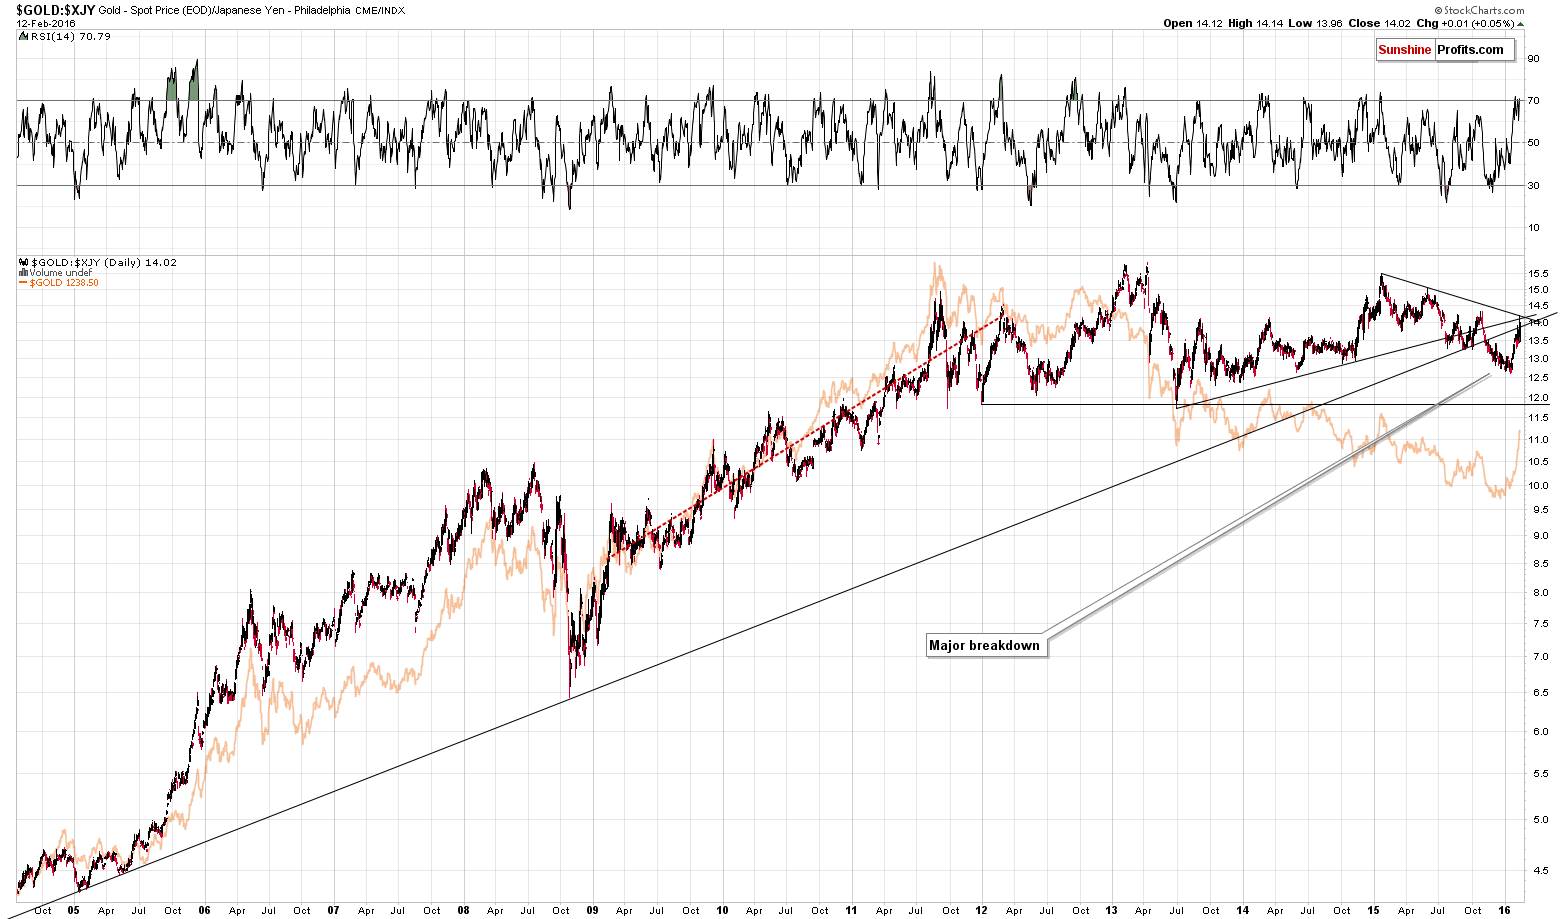
The above chart features to gold price seen from the Japanese yen perspective. As is the case for other ratios, the above chart can help us detect tops and bottoms in gold as they correspond to tops and bottoms that we can see above. At this time, we can see that gold priced in the Japanese yen moved to a combination of 2 important resistance levels and then declined once again without breaking above them. This suggests that further rallies in gold will likely be limited and that gold is likely to reverse relatively soon.
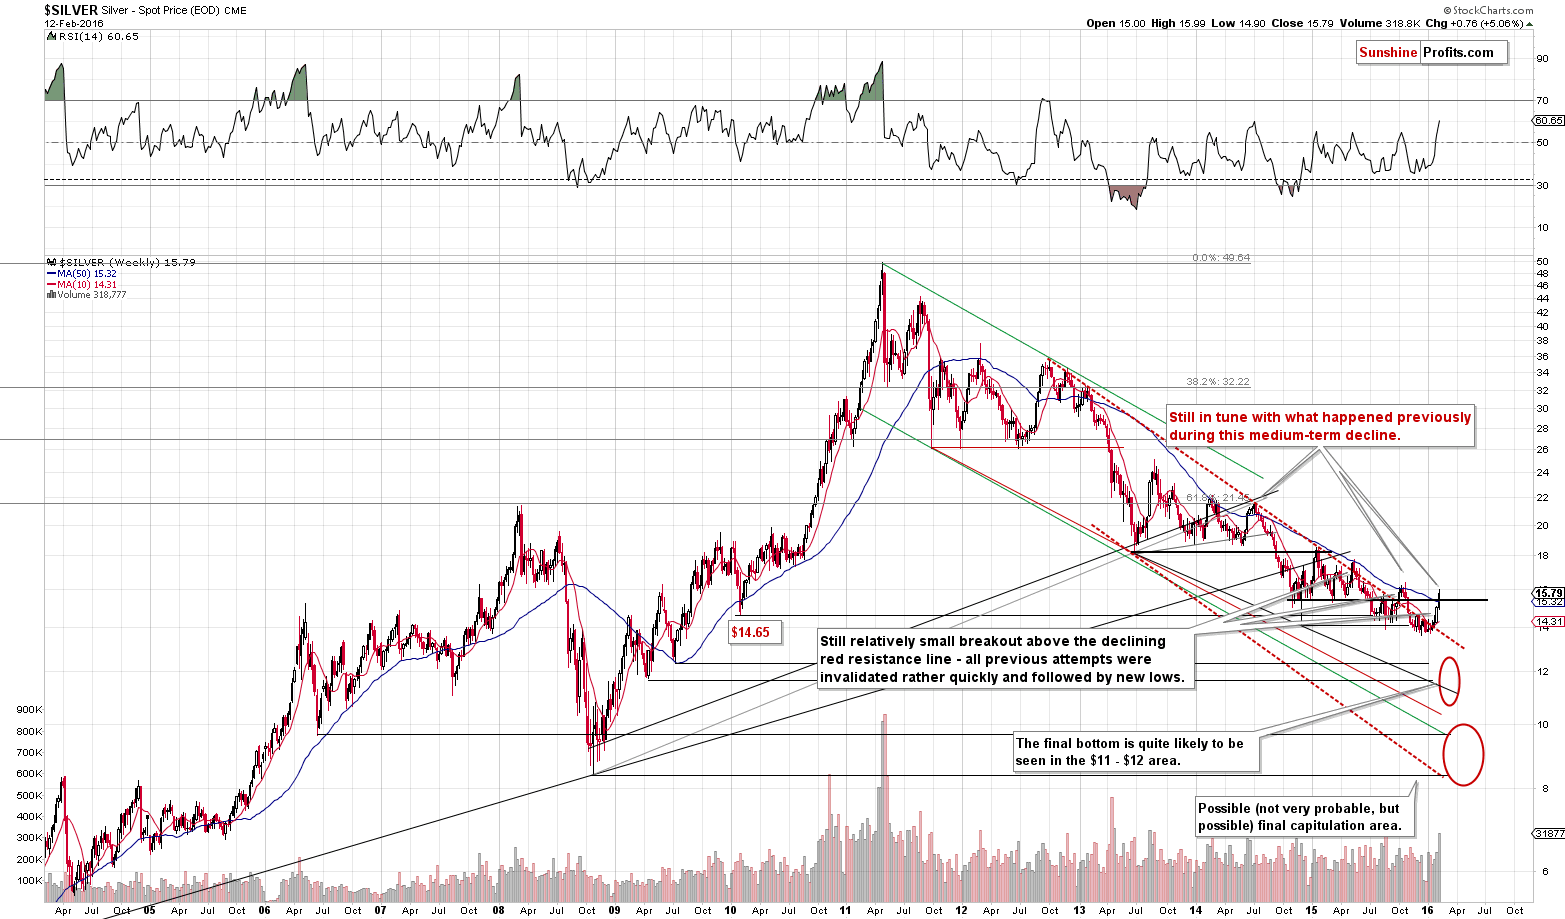
Our comments on the long-term silver chart also remain unchanged:
Silver moved higher, but the rally was not very huge, especially from the long-term perspective. Gold seems somewhat likely to move to its 2015 highs this or next week, but for silver the analogous level is very far (about $18). Overall, we think that nothing changed for silver as far as the outlook is concerned and the medium-term outlook remains bearish.
Silver indeed moved higher, but the move above the 50-week moving average is still similar to what we saw previously and what didn’t generate substantial rallies, but declines. In mid-2014 silver moved above the moving average and rallied almost to its previous local high before reversing and starting a $7+ decline. We saw something similar in mid-2012 as well and in this case the decline was even bigger. It seems that silver is topping here, but in case gold temporarily soars higher, silver might move higher as well, so we will wait for additional bearish confirmations before re-entering the short position.
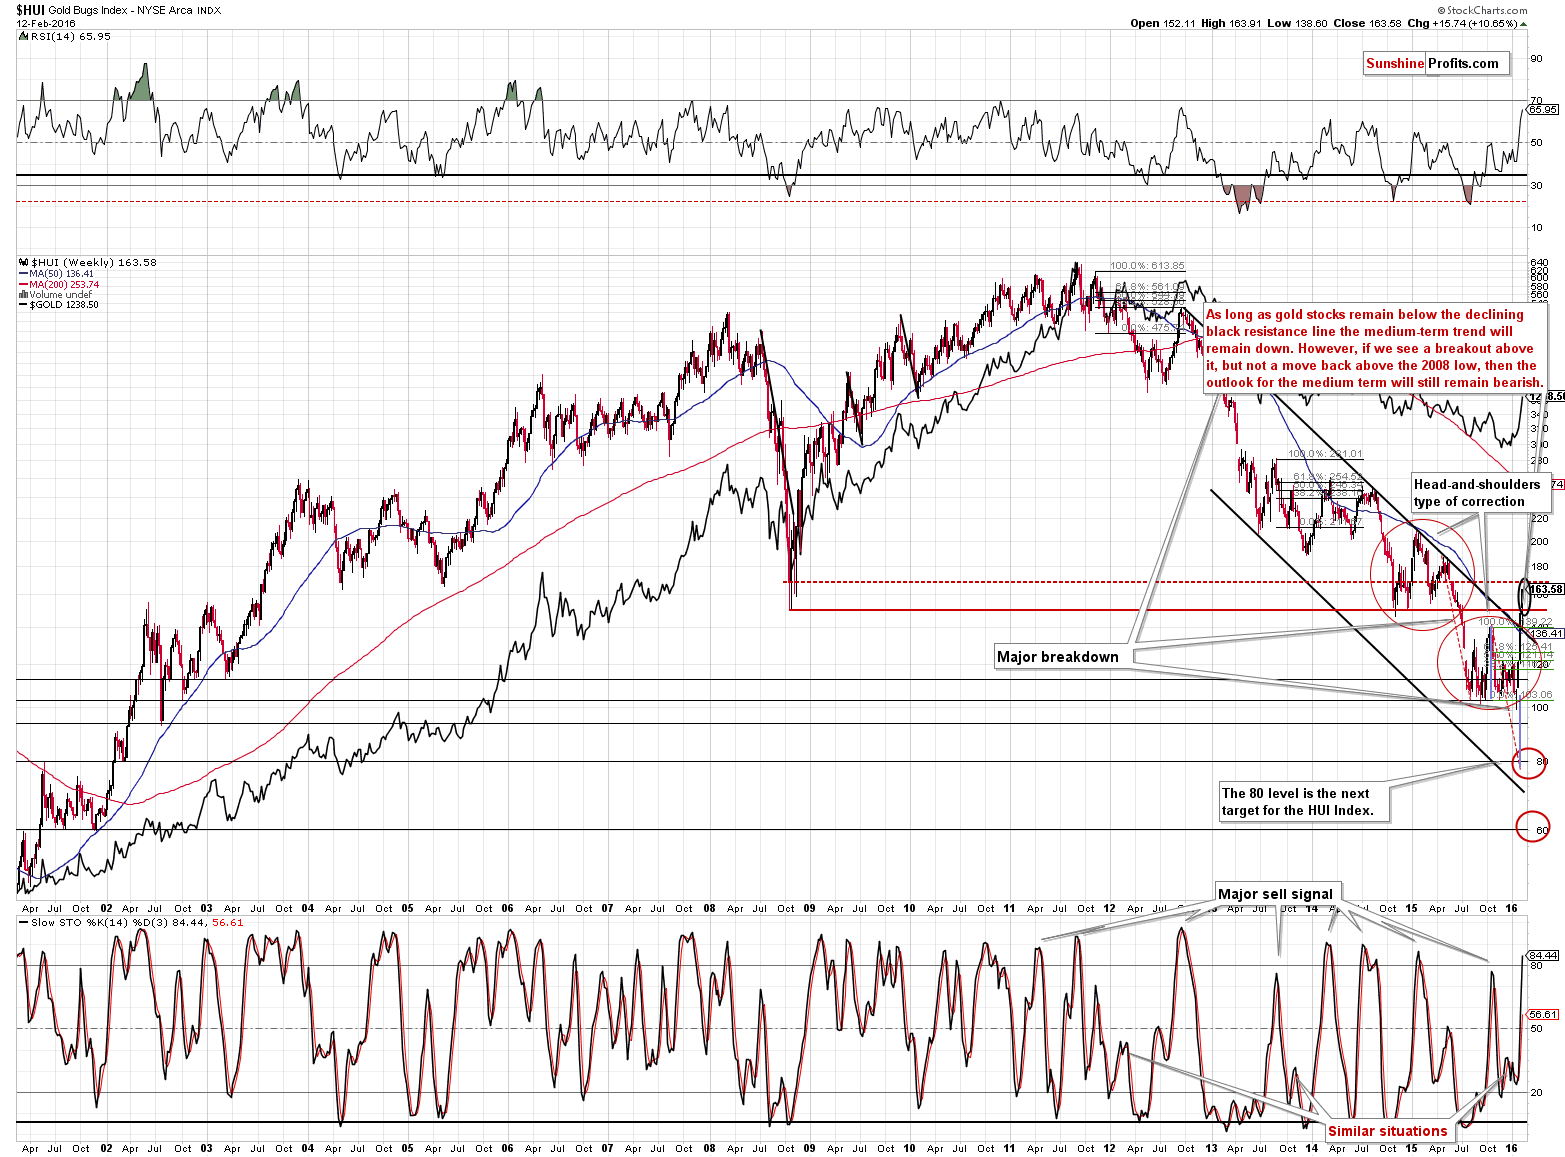
Gold stocks moved higher last week, but they moved only a little above their previous February high. We previously wrote that the resistance was between 150 and 170 and the HUI Index closed the week visibly below 170. Consequently, the outlook didn’t improve much based on last week’s rally.
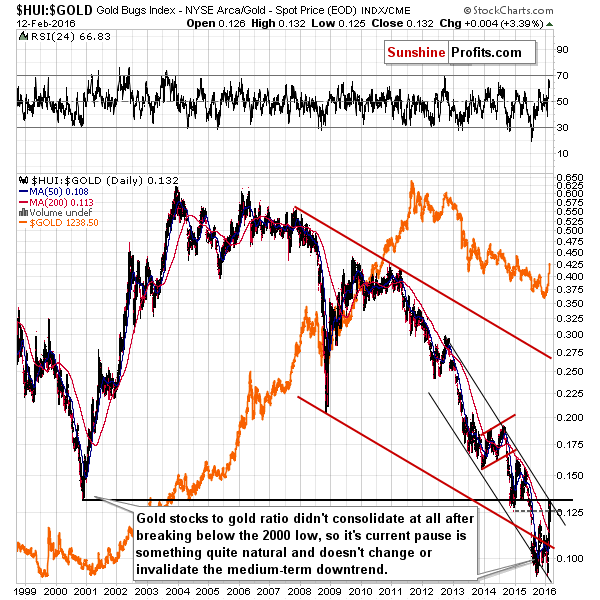
As you can see on the above gold stocks to gold ratio chart, the latter moved to its 2000 low once again, but there was no breakout. Consequently, the ratio is likely to move lower and gold stocks are likely to underperform gold.
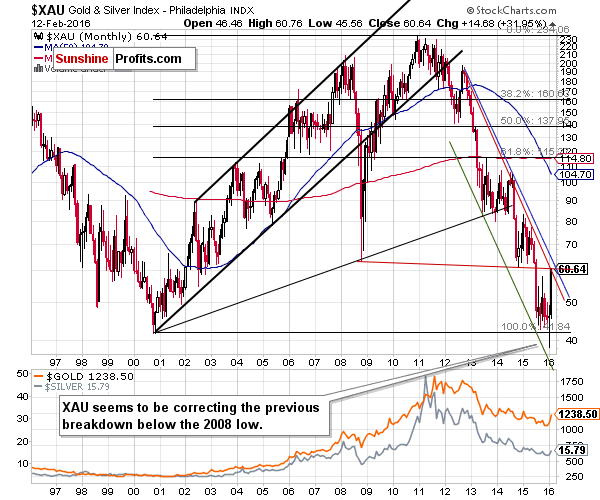
The XAU Index moved higher last week, however, it closed the week at the combination of 2 important resistance lines – the one created by the 2008 and 2014 lows and the second one based on the local highs (in terms of monthly closing prices). Both red lines are crossing more or less where XAU just closed. Consequently, we should be expecting a reversal shortly, if not right away.
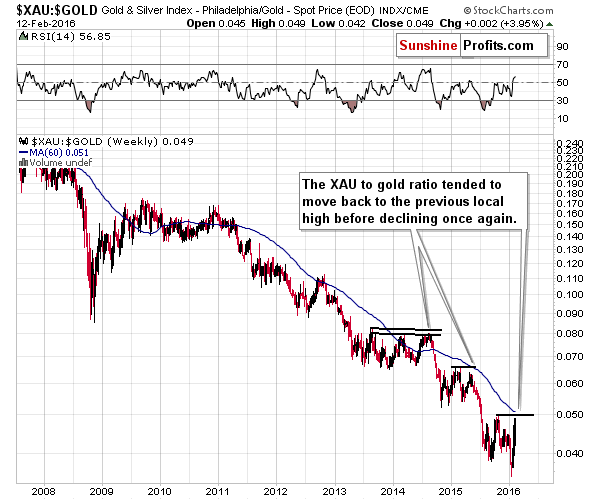
As far the XAU to gold ratio is concerned, we can also draw bearish, but not extremely precise conclusions. During previous consolidations the ratio moved more or less to its previous highs before sliding much further. We are seeing the same phenomenon once again. The ratio is now very close to the late 2015 high and based on the analogy to previous similar situations, we can expect a turnaround relatively soon.
Summing up, gold soared last week mostly based on Yellen´s reply to a question about NIRP, however, it seems that market´s unpredictable reaction was much overdone compared with what Janet Yellen really said and what she didn´t say. Gold could move higher from here due to the momentum that we saw last week, however, today´s pre-market downswing in gold and silver is something that changes a lot and currently the odds are that we are going to see a very sharp downswing shortly. Consequently, it seems that re-entering the short position in gold and silver (half of the regular position for now) is justified from the risk-reward perspective. The full short position in mining stocks remains in place as the stop-loss level for the GDX ETF was not reached (as a reminder, stop-loss levels and target prices for GDX are binding while the levels for leveraged ETNs are not binding and provided on a supplementary basis only).
As always, we will keep you – our subscribers – updated.
To summarize:
Trading capital (our opinion): Short positions in gold and silver (half) and a short position in mining stocks (full) are justified from the risk/reward perspective with the following stop-loss orders and initial target price levels:
- Gold: initial target price: $973; stop-loss: $1,274, initial target price for the DGLD ETN: $94.27; stop-loss for the DGLD ETN $52.44
- Silver: initial target price: $12.13; stop-loss: $16.14, initial target price for the DSLV ETN: $77.53; stop-loss for DSLV ETN $42.69
- Mining stocks (price levels for the GDX ETF): initial target price: $9.34; stop-loss: $18.91, initial target price for the DUST ETF: $17.31; stop-loss for the DUST ETF $5.05
In case one wants to bet on junior mining stocks' prices (we do not suggest doing so – we think senior mining stocks are more predictable in the case of short-term trades – if one wants to do it anyway, we provide the details), here are the stop-loss details and initial target prices:
- GDXJ ETF: initial target price: $14.13; stop-loss: $25.53
- JDST ETF: initial target price: $36.46; stop-loss: $10.28
Long-term capital (our opinion): No positions
Insurance capital (our opinion): Full position
Plus, you might want to read why our stop-loss orders are usually relatively far from the current price.
Please note that a full position doesn’t mean using all of the capital for a given trade. You will find details on our thoughts on gold portfolio structuring in the Key Insights section on our website.
As a reminder – “initial target price” means exactly that – an “initial” one, it’s not a price level at which we suggest closing positions. If this becomes the case (like it did in the previous trade) we will refer to these levels as levels of exit orders (exactly as we’ve done previously). Stop-loss levels, however, are naturally not “initial”, but something that, in our opinion, might be entered as an order.
Since it is impossible to synchronize target prices and stop-loss levels for all the ETFs and ETNs with the main markets that we provide these levels for (gold, silver and mining stocks – the GDX ETF), the stop-loss levels and target prices for other ETNs and ETF (among other: UGLD, DGLD, USLV, DSLV, NUGT, DUST, JNUG, JDST) are provided as supplementary, and not as “final”. This means that if a stop-loss or a target level is reached for any of the “additional instruments” (DGLD for instance), but not for the “main instrument” (gold in this case), we will view positions in both gold and DGLD as still open and the stop-loss for DGLD would have to be moved lower. On the other hand, if gold moves to a stop-loss level but DGLD doesn’t, then we will view both positions (in gold and DGLD) as closed. In other words, since it’s not possible to be 100% certain that each related instrument moves to a given level when the underlying instrument does, we can’t provide levels that would be binding. The levels that we do provide are our best estimate of the levels that will correspond to the levels in the underlying assets, but it will be the underlying assets that one will need to focus on regarding the sings pointing to closing a given position or keeping it open. We might adjust the levels in the “additional instruments” without adjusting the levels in the “main instruments”, which will simply mean that we have improved our estimation of these levels, not that we changed our outlook on the markets. We are already working on a tool that would update these levels on a daily basis for the most popular ETFs, ETNs and individual mining stocks.
Our preferred ways to invest in and to trade gold along with the reasoning can be found in the how to buy gold section. Additionally, our preferred ETFs and ETNs can be found in our Gold & Silver ETF Ranking.
As always, we'll keep you - our subscribers - updated should our views on the market change. We will continue to send out Gold & Silver Trading Alerts on each trading day and we will send additional Alerts whenever appropriate.
The trading position presented above is the netted version of positions based on subjective signals (opinion) from your Editor, and the Tools and Indicators.
As a reminder, Gold & Silver Trading Alerts are posted before or on each trading day (we usually post them before the opening bell, but we don't promise doing that each day). If there's anything urgent, we will send you an additional small alert before posting the main one.
=====
Latest Free Trading Alerts:
Negative interest rates are probably the hottest topic in monetary policy and financial markets right now. What do they mean for the gold market?
Is Gold the Beneficiary of NIRP?
=====
Hand-picked precious-metals-related links:
Gold Gets Thumped as Risk-On Mood, Surging Shares Erode Demand
Weekly Large Trader COT Report: Gold
Lack of Asian buyers may keep a lid on gold price
Examining the fate of platinum producers
=====
In other news:
Fed's 'dot plot' looks increasingly out of touch on rates
European Stocks Rally Following Surge in Japan
ECB in talks with Italy over buying bundles of bad loans
China shares resume with modest losses, yuan firms despite trade slump
Yuan hits 2016 high against USD after PBOC's Zhou speaks on FX strategy
Japan economy shrinks more than expected, highlights lack of policy options
Market mayhem: Central banks may be fueling the fire
Oil Resumes Drop as Iran Loads Europe Cargo, China Imports Fall
Brazil's 5,500 Bankruptcies in 2015 Signal Deeper Credit Crisis
=====
Thank you.
Sincerely,
Przemyslaw Radomski, CFA
Founder, Editor-in-chief
Gold & Silver Trading Alerts
Forex Trading Alerts
Oil Investment Updates
Oil Trading Alerts


