Briefly: in our opinion, full (250% of the regular size of the position) speculative short positions in gold, silver and mining stocks are justified from the risk/reward perspective at the moment of publishing this Alert.
More back and forth trading, more consolidation, and more boredom in general. And that’s exactly what makes the current situation so special. The boredom was similarly big only a few times in the past 2 decades and what followed was very, very important. And definitely not boring.
Let’s take a look at the gold chart for details.
Gold’s Extreme Boredom
We entitled our March 13th Gold & Silver Trading Alert “Declining Volatility in Gold & Silver and False Sense of Security” and what we wrote in the opening paragraph perfectly describes the current situation as well:
Gold, silver and mining stocks have been moving back and forth in the past few days and the overall volatility declined significantly. This may be viewed as an indication that the big price moves are nowhere close and that it’s pointless to be watching this market at all. The reality is exactly the opposite.
Gold was trading at about $1,320 at that time. What happened later? Gold moved back and forth for a few more weeks, but it then declined about $150 from the above-mentioned $1,320. The point is not that we are going to see the consolidation for a few more weeks, but that the lack of volatility is indeed something that precedes big moves, so it’s something that should make one stay alert. Or you can have someone to stay alert for you and we’ll be keeping you up-to-date as the situation develops.
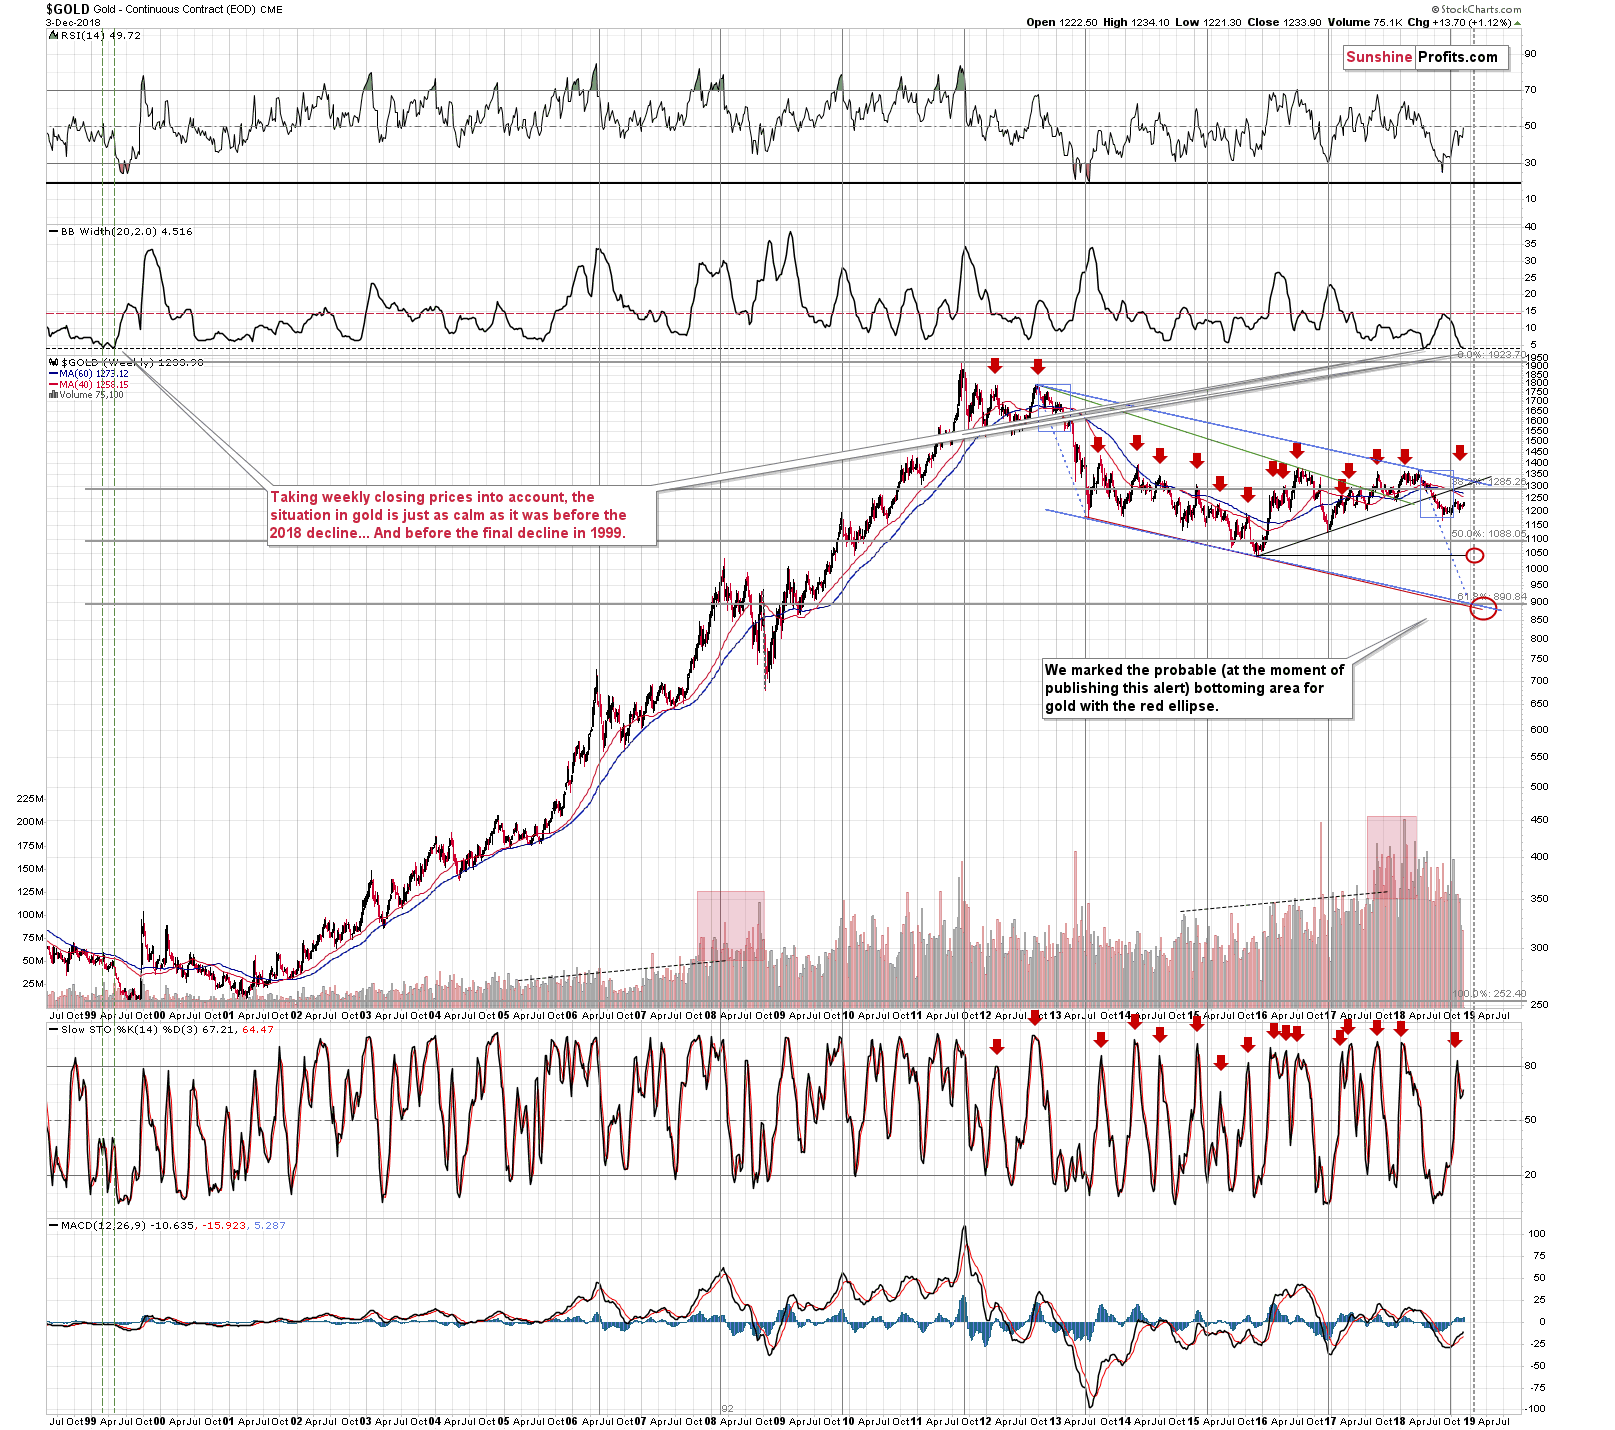
Moving on to the above chart, the volatility is described by the Bollinger Band’s width. Long story short, the bigger the volatility, the broader the bollband and the higher the value of the indicator that we plotted on the above chart (second from the top).
In the past 20 years, we saw similarly low readings only 3 times. Twice in 1999 and once in 2018. And in all these cases, the price of gold declined shortly thereafter.
The most interesting thing about these situations is that they make this year quite similar to 1999 in terms of what’s likely to happen to gold. Surely, the world is different than it was back then (it was 6 years before the Youtube was created and Google was just 1 year old), but people were just as prone to being greedy and scared as they are right now and thus, they are quite likely to react in a similar way to analogous situations. This means that the analogy in price to something that happened 20 years ago is really useful.
In 1999 the first case of extreme boredom triggered the initial decline which caused the volatility to move a bit higher. When the dust settled, and the situation was once again extremely boring, we saw another move to the record low in the indicator (dashed line) and it was after a small (from the long-term point of view) corrective upswing. That was the final top before the big slide to the final lows.
The first case of extreme boredom that we saw this year was followed by a decline that was quite sizable, when compared to the moves that preceded in the previous months, but it may be relatively small compared to what’s just ahead. The decline caused the volatility to move higher and now it moved to the record low once again – after a small (from the long-term point of view) corrective upswing. This is likely the final top (of very close to it) right before the big slide to the final lows.
All in all, 3 out of 3 previous cases were followed by substantial declines and there is an analogy between 1999 and 2018 that makes the bearish signal even stronger.
Naturally, that’s not the only analogy that remains in place right now. We previously elaborated on the similarity between this year and 2013 and the likelihood that the current consolidation will be followed by a huge decline.
However, the consolidation that follows the recent decline takes longer than the one that we saw in 2013 before the big slide. Does it invalidate the analogy?
Update on the 2013 – Now Link
Not necessarily – it appears that the moves are similar in terms of shape. The current consolidation takes more time, but it appears quite similar to what happened about 5.5 years ago.
In both cases, there was first an initial decline, then a corrective upswing (second half of August 2018), then another decline (took longer in 2018 than in 2013) and another upswing (it was sharper in 2018 than in 2013 but thanks to this, the local tops formed more similarly in both years). Then we saw another volatile decline (early April 2013 and early November 2018) and a corrective upswing (the move that happened in mid-April right before the plunge and the upswing that we’re seeing right now).
The current upswing is a bit bigger and it takes more time than the one in 2013, but the deviation is not very significant. It’s not bigger than the timing and shape of the rally that we saw in October, and back then the link returned to its normal shape relatively soon. Can a few days invalidate the analogy that’s been in place for months? Only if gold moved in a spectacular way. And yesterday’s move higher along with today’s upswing ($10 at the moment of writing these words) are definitely not enough.
Ok, so gold is moving back and forth, but are there any signs suggesting that it will reverse? Any triggers for the decline?
We have both.
The USD Index – the Direct Trigger
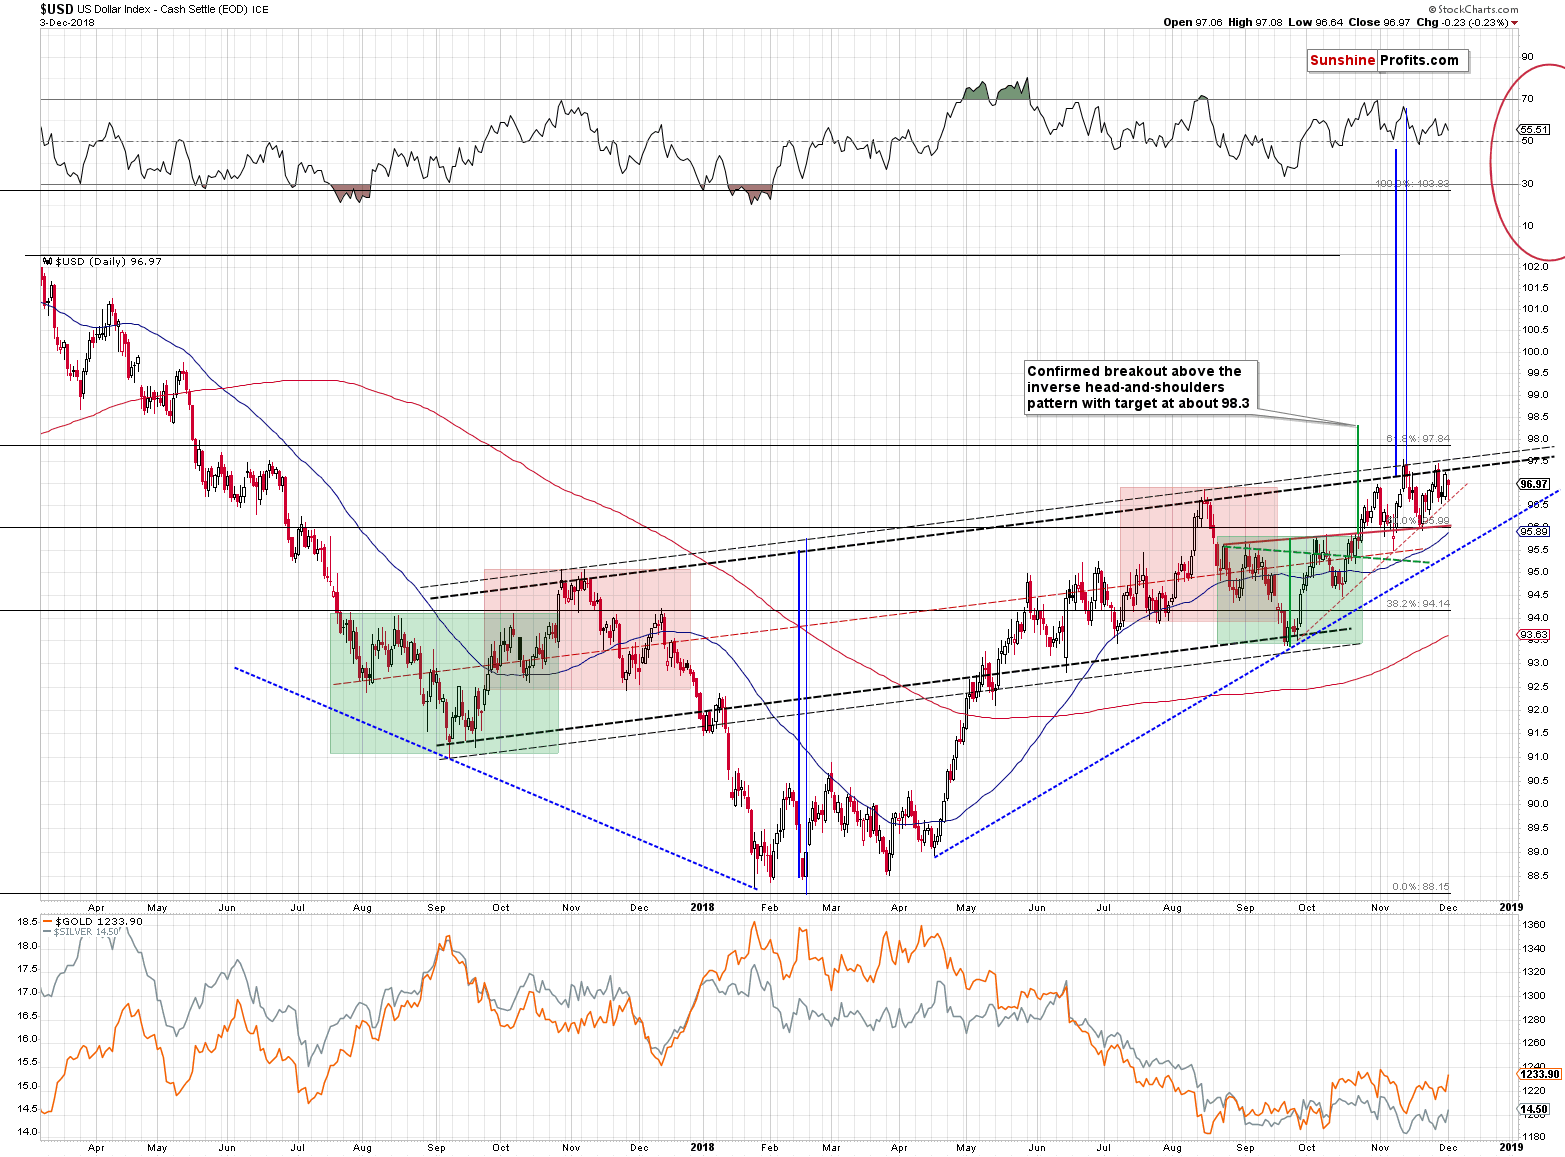
The USD Index is likely to be the direct trigger once it confirms its breakout above the rising neck level of the inverse head-and-shoulders pattern. The USDX just moved lower once again today (by about 0.5), but it remains above the key rising support line (the one marked with blue) and it seems that this prolonged consolidation will not continue for much longer.
The news that might have caused the move lower in the USD Index was the most recent development regarding Brexit. Quoting Bloomberg:
The U.K. should be allowed to reverse its Article 50 notice, which triggered the Brexit process, an adviser to the European Union’s top court said in an opinion that will boost the hopes of campaigners who want the country to stay in the EU.
“The possibility continues to exist” to revoke the Brexit notice “until such time as the withdrawal agreement is formally concluded,” Advocate General Manuel Campos Sanchez-Bordona of the EU Court of Justice said in a non-binding opinion on Tuesday. The pound jumped to a day high of $1.2787 after the news.
We don’t want to say the cliché “we told you so”, but, well, we did. We emphasized that the Powers That Be have many aces up their sleeves and the Brexit is unlikely to really take place. The above is yet another step in this direction. Now some protests and perhaps a second referendum that ends with “Bremain”, which this time would be binding.
Gold soared on the Brexit vote when it was announced, so it should decline when things start pointing to the Bremain scenario. However, the markets are emotional in the short run, not logical, so the easiest way for the market to react is to pay attention to the increase in the value of the British Pound and corresponding decline in the value of the USD, which in turns leads to higher gold prices. That’s very likely just temporary, and the same goes for the drop in the value of the USD Index.
The breakout and the subsequent rally in the USDX are extremely likely to trigger a decline in the PMs.
Having discussed the direct trigger, let’s move to the reversals.
Gold & Silver Reversals
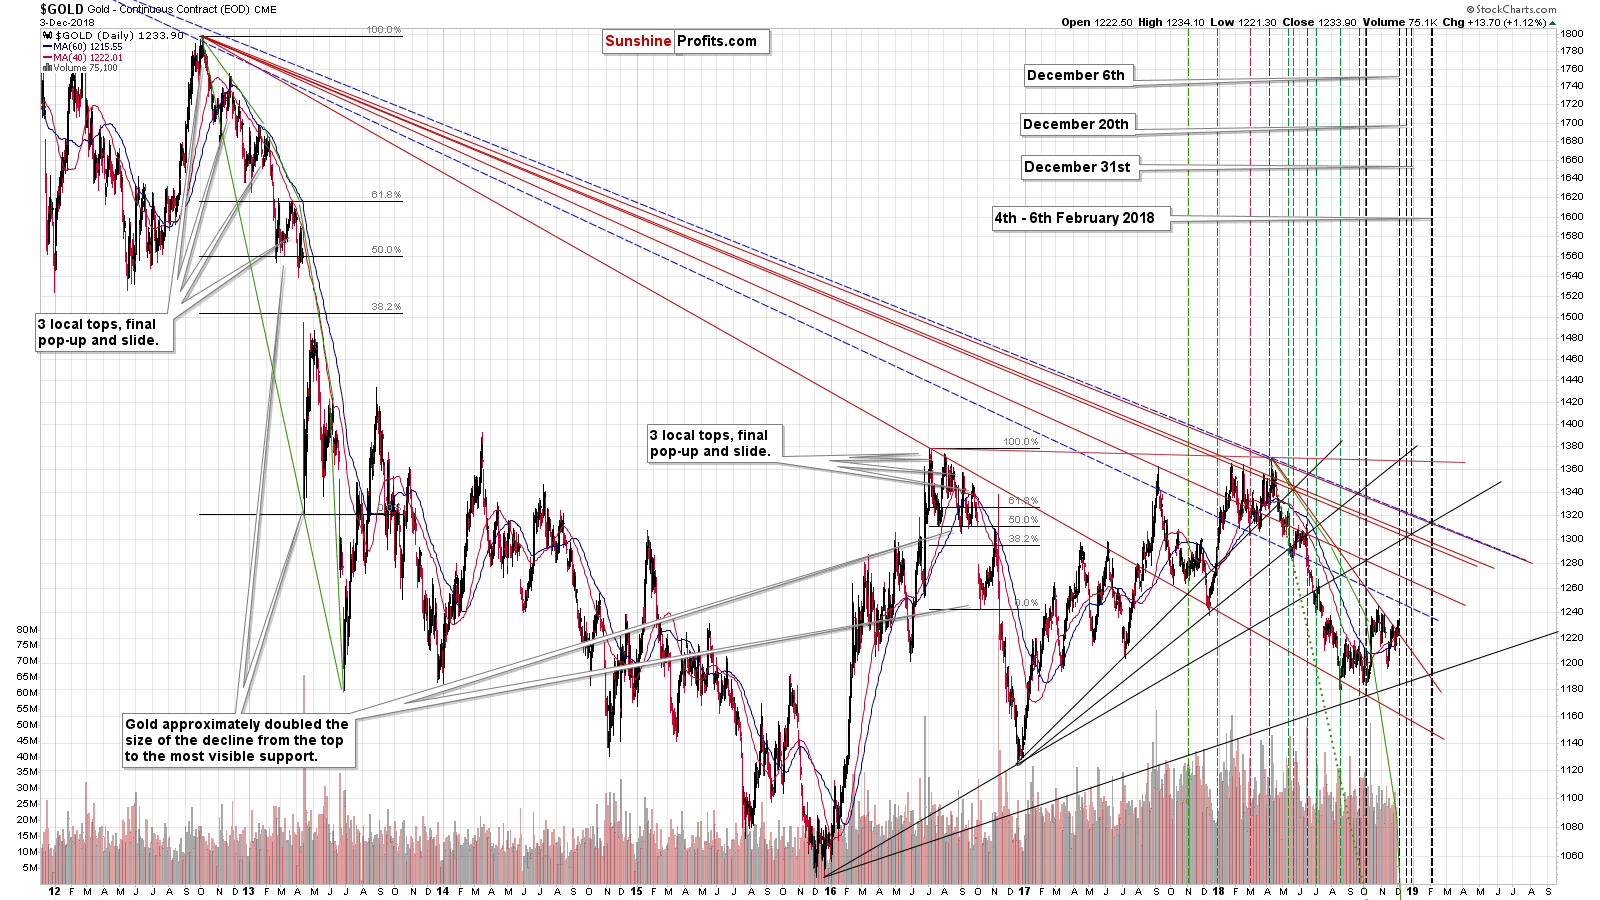
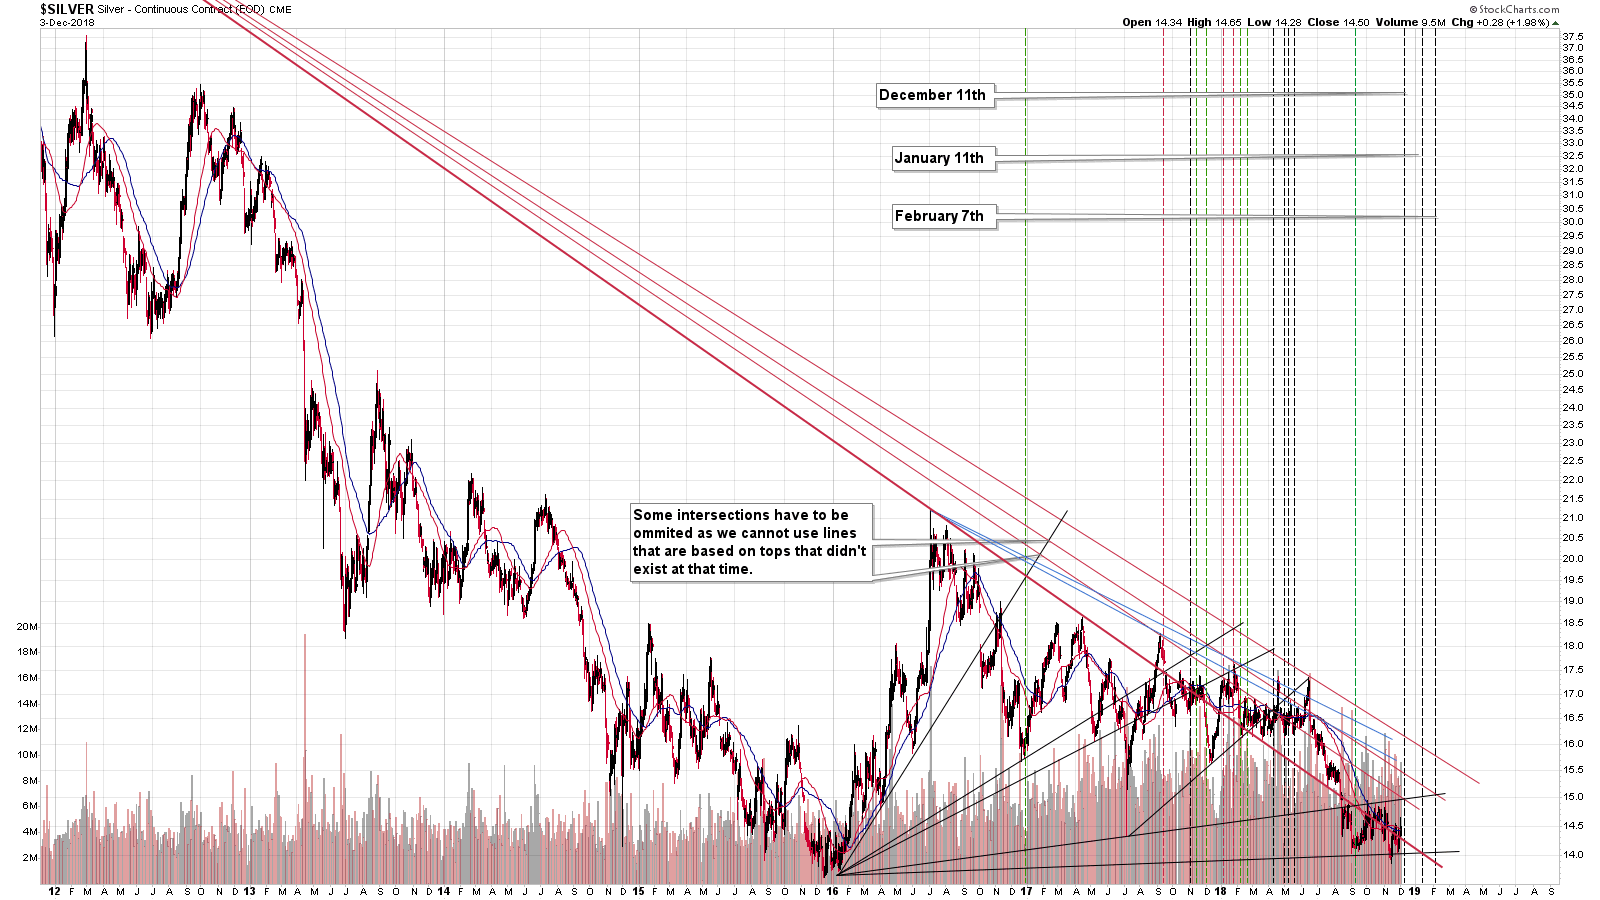
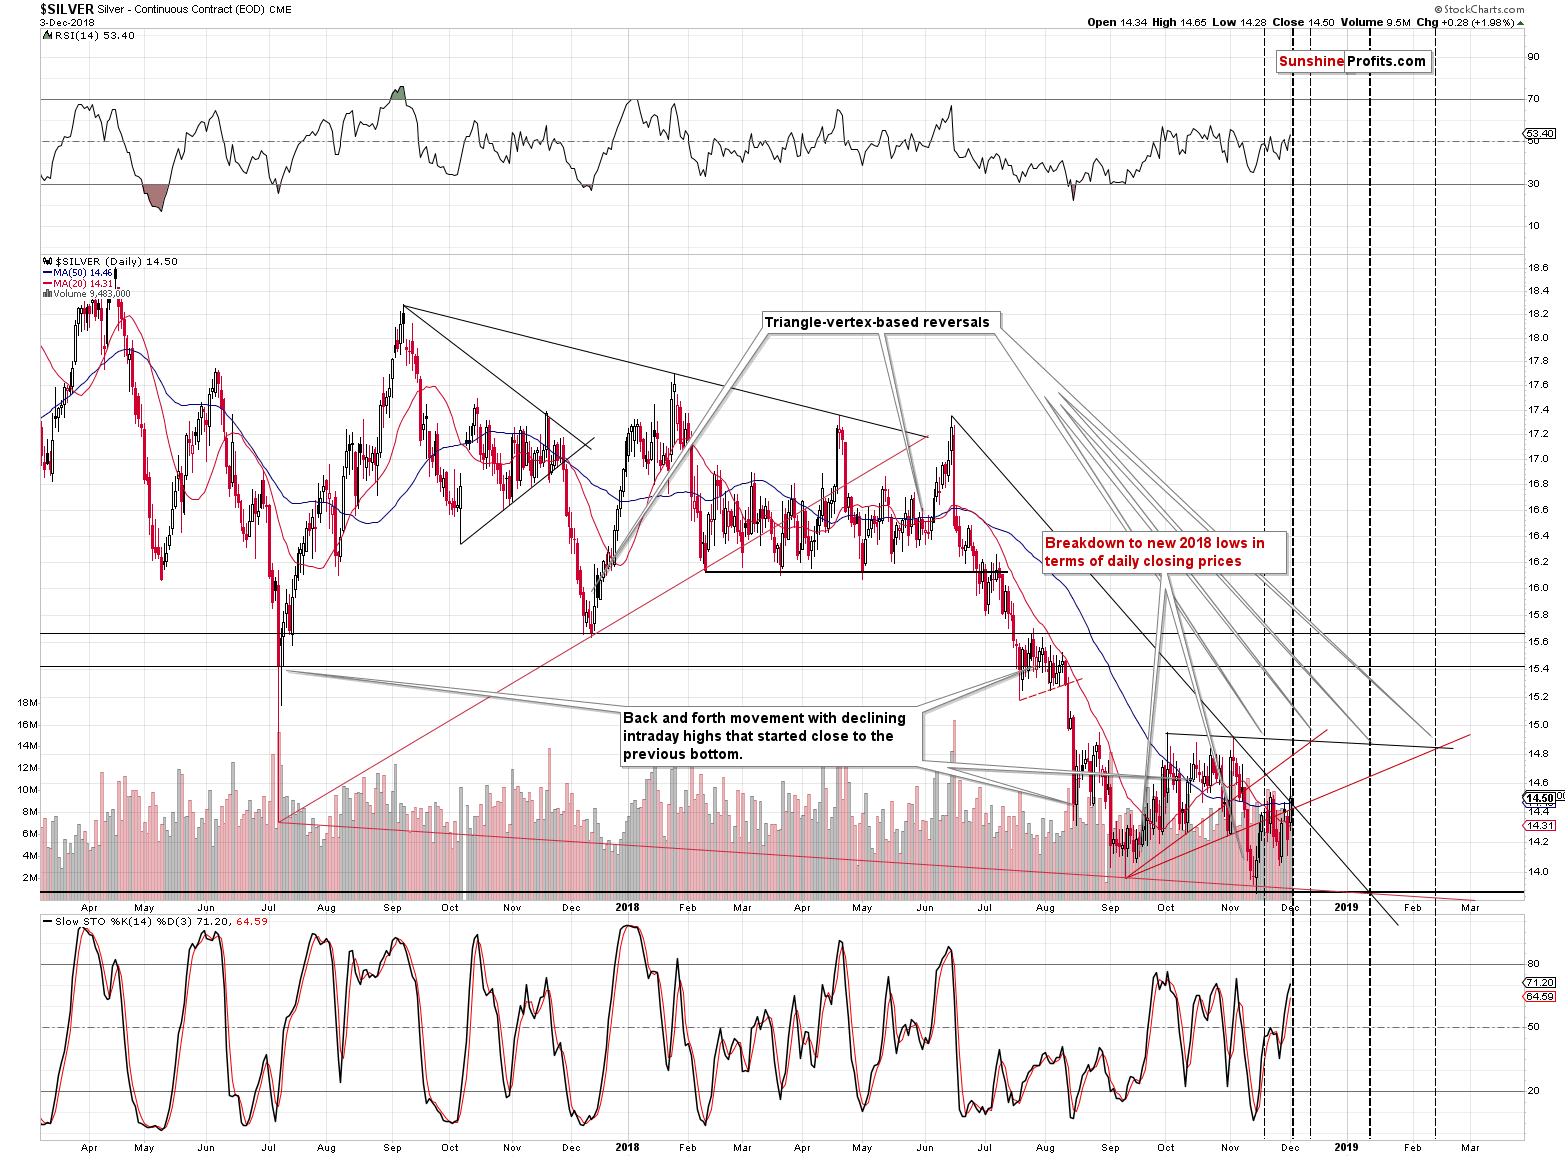
The triangle-vertex-based reversal for gold and silver are just around the corner. In case of silver, the above is based on reversals that are based on both: medium- and long-term triangles. The most recent move was to the upside, so the implications are clearly bearish.
We have some short-term signs as well.
Short-term Topping Signs
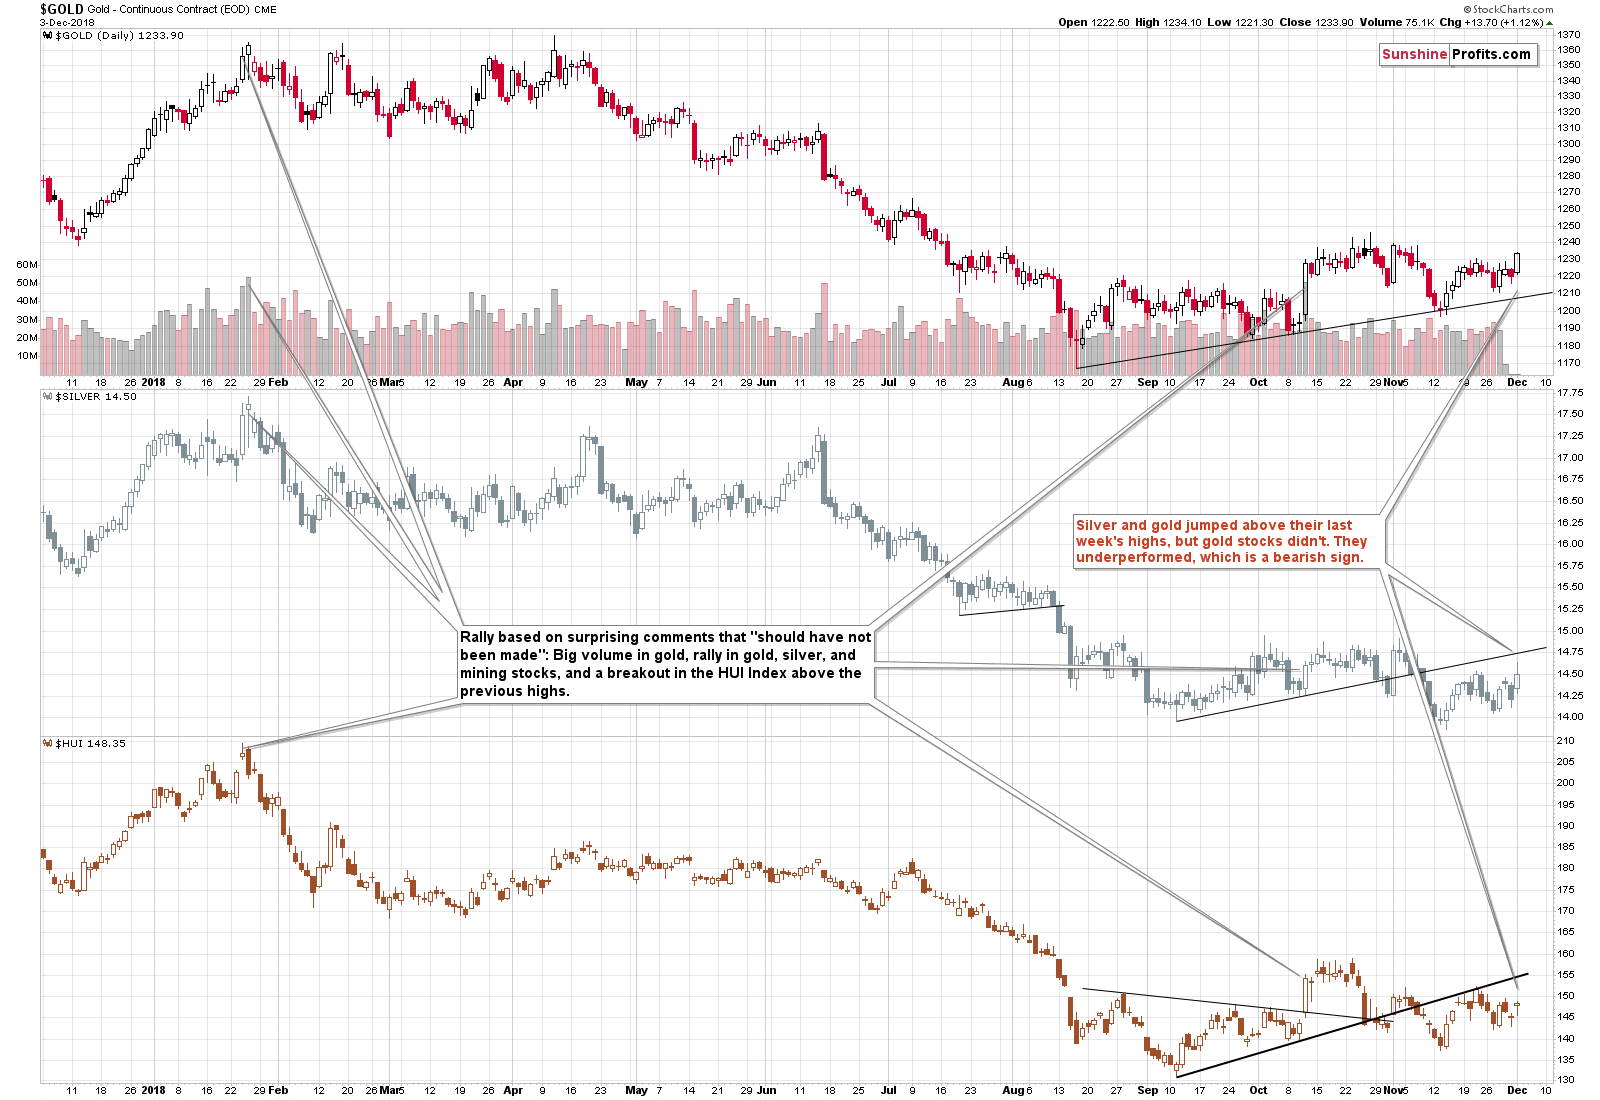
One is that mining stocks underperformed by not moving above even the most recent high, not to mention the mid-November high. That is a classic bearish sign for the precious metals sector.

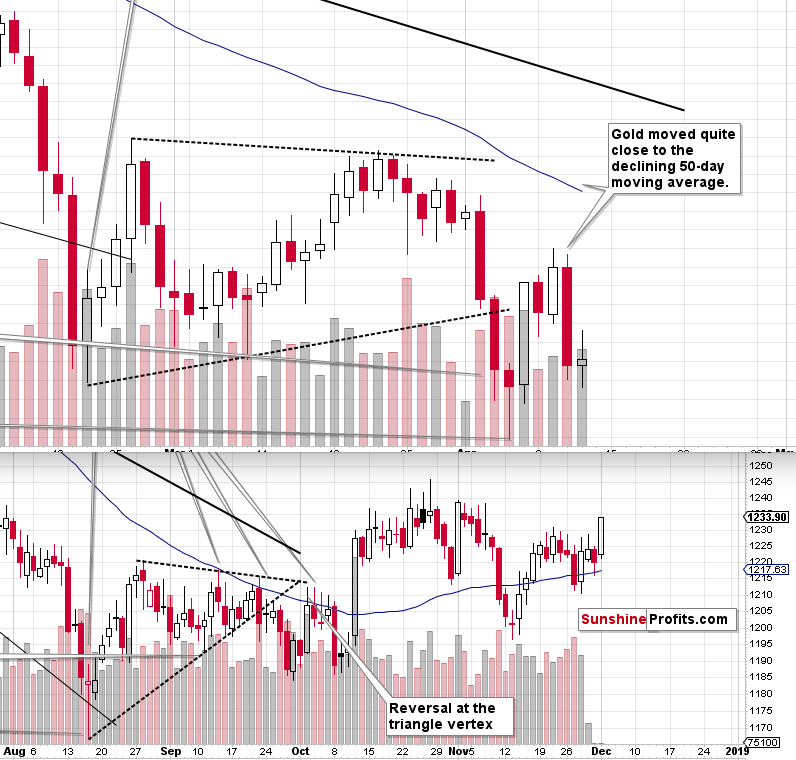
The other is a series of black candlesticks in the GLD ETF. It’s something that we see at the (prolonged, but still) tops and that we don’t see in the early parts of a rally. Please note how the December rally started. There was only one tiny black candlestick and all the other daily rallies took a regular form, when price rallied also during the US session.
On the other hand, the November 2017 top, the March-April 2018 top, the early June top, the October top were all created by a series of sessions that included several black candlesticks. The current price movement is also accompanied by several black candlesticks, suggesting that the current price action is not a beginning of a new rally, but rather a topping pattern.
Summing up, the outlook for the precious metals market remains very bearish for the following weeks and months and short position remains justified from the risk to reward point of view, even if we see a few extra days of back and forth trading or even a small brief upswing. There is a very high probability of a huge downswing that makes the short position justified, not the outlook for the next few days. The strongly bearish analogies to 2013 and 1999, miners’ underperformance, the number of intraday reversals in the GLD ETF, the triangle-based reversals in gold and silver as well as the outlook for the USD Index are only several of multiple reasons pointing to much lower precious metals’ prices in the near future.
As always, we’ll keep you – our subscribers – informed.
To summarize:
Trading capital (supplementary part of the portfolio; our opinion): Full short positions (250% of the full position) in gold, silver and mining stocks are justified from the risk/reward perspective with the following stop-loss orders and exit profit-take price levels:
- Gold: profit-take exit price: $1,062; stop-loss: $1,257; initial target price for the DGLD ETN: $82.96; stop-loss for the DGLD ETN $49.27
- Silver: profit-take exit price: $12.32; stop-loss: $15.11; initial target price for the DSLV ETN: $47.67; stop-loss for the DSLV ETN $28.37
- Mining stocks (price levels for the GDX ETF): profit-take exit price: $13.12; stop-loss: $20.83; initial target price for the DUST ETF: $80.97; stop-loss for the DUST ETF $27.67
Note: the above is a specific preparation for a possible sudden price drop, it does not reflect the most likely outcome. You will find a more detailed explanation in our August 1 Alert. In case one wants to bet on junior mining stocks’ prices (we do not suggest doing so – we think senior mining stocks are more predictable in the case of short-term trades – if one wants to do it anyway, we provide the details), here are the stop-loss details and target prices:
- GDXJ ETF: profit-take exit price: $17.52; stop-loss: $31.23
- JDST ETF: initial target price: $154.97 stop-loss: $51.78
Long-term capital (core part of the portfolio; our opinion): No positions (in other words: cash)
Insurance capital (core part of the portfolio; our opinion): Full position
Important Details for New Subscribers
Whether you already subscribed or not, we encourage you to find out how to make the most of our alerts and read our replies to the most common alert-and-gold-trading-related-questions.
Please note that the in the trading section we describe the situation for the day that the alert is posted. In other words, it we are writing about a speculative position, it means that it is up-to-date on the day it was posted. We are also featuring the initial target prices, so that you can decide whether keeping a position on a given day is something that is in tune with your approach (some moves are too small for medium-term traders and some might appear too big for day-traders).
Plus, you might want to read why our stop-loss orders are usually relatively far from the current price.
Please note that a full position doesn’t mean using all of the capital for a given trade. You will find details on our thoughts on gold portfolio structuring in the Key Insights section on our website.
As a reminder – “initial target price” means exactly that – an “initial” one, it’s not a price level at which we suggest closing positions. If this becomes the case (like it did in the previous trade) we will refer to these levels as levels of exit orders (exactly as we’ve done previously). Stop-loss levels, however, are naturally not “initial”, but something that, in our opinion, might be entered as an order.
Since it is impossible to synchronize target prices and stop-loss levels for all the ETFs and ETNs with the main markets that we provide these levels for (gold, silver and mining stocks – the GDX ETF), the stop-loss levels and target prices for other ETNs and ETF (among other: UGLD, DGLD, USLV, DSLV, NUGT, DUST, JNUG, JDST) are provided as supplementary, and not as “final”. This means that if a stop-loss or a target level is reached for any of the “additional instruments” (DGLD for instance), but not for the “main instrument” (gold in this case), we will view positions in both gold and DGLD as still open and the stop-loss for DGLD would have to be moved lower. On the other hand, if gold moves to a stop-loss level but DGLD doesn’t, then we will view both positions (in gold and DGLD) as closed. In other words, since it’s not possible to be 100% certain that each related instrument moves to a given level when the underlying instrument does, we can’t provide levels that would be binding. The levels that we do provide are our best estimate of the levels that will correspond to the levels in the underlying assets, but it will be the underlying assets that one will need to focus on regarding the signs pointing to closing a given position or keeping it open. We might adjust the levels in the “additional instruments” without adjusting the levels in the “main instruments”, which will simply mean that we have improved our estimation of these levels, not that we changed our outlook on the markets. We are already working on a tool that would update these levels on a daily basis for the most popular ETFs, ETNs and individual mining stocks.
Our preferred ways to invest in and to trade gold along with the reasoning can be found in the how to buy gold section. Additionally, our preferred ETFs and ETNs can be found in our Gold & Silver ETF Ranking.
As a reminder, Gold & Silver Trading Alerts are posted before or on each trading day (we usually post them before the opening bell, but we don't promise doing that each day). If there's anything urgent, we will send you an additional small alert before posting the main one.
=====
Latest Free Trading Alerts:
President Trump and President Xi Jinping agreed to halt escalation in their trade conflict. At the same time, the Fed officials became more cautious about the pace of future interest rate hikes. How will the softening of the US trade and monetary policies affect the gold market?
Trump and Powell More Dovish. Will Gold Fly Away?
November was the worst month for oil bulls since July 2016. Over the past few weeks, the price of black gold has dived deeply, sometimes dropping even under the barrier of $50. What impact did this price action have on the long-, medium- and short-term picture of the commodity?
Crude Oil After November’s Declines
=====
Thank you.
Sincerely,
Przemyslaw Radomski, CFA
Editor-in-chief, Gold & Silver Fund Manager
Gold & Silver Trading Alerts
Forex Trading Alerts
Oil Investment Updates
Oil Trading Alerts


