Briefly: in our opinion, full (300% of the regular position size) speculative short positions in junior mining stocks are justified from the risk/reward point of view at the moment of publishing this Alert.
Gold stocks quite often lead gold, both higher and lower. And currently, they are no longer whispering – they provide “loud” indications.
Remember when gold, silver, and miners shot up right after Powell spoke? Investors heard “disinflation,” and they probably thought that the “inflation problem” is over, and that it’s all sunshine and rainbows from here, as the rates can now be cut and the economy will get another powerful boost shortly.
Long live the bull market!
Right?
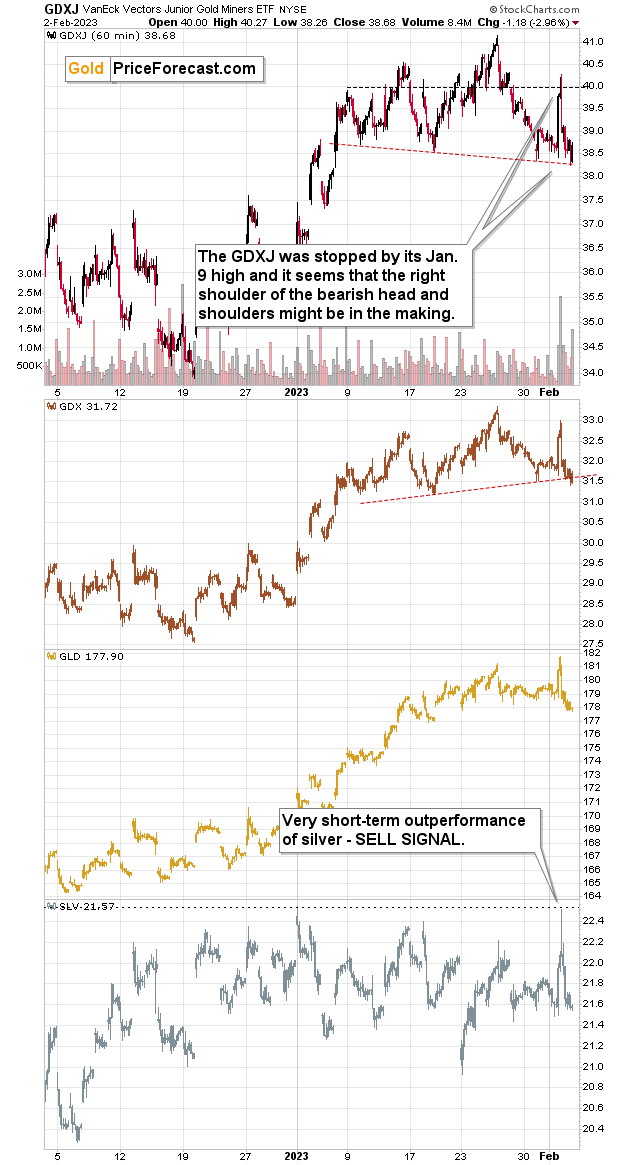
Well, that’s what the initial reaction seems to have been. Here’s the chart that I included in my yesterday’s premium analysis.
I wrote the following:
- Gold (the GLD ETF) moved slightly above its recent high.
- Silver (the SLV ETF) moved higher, but didn’t manage to match even its most recent short-term high – we saw a lower high.
- Junior mining stocks (the GDXJ ETF) moved higher, but didn’t manage to hold above their Jan. 9 high.
Consequently, while we don’t see any indication from the gold-silver dynamics, we see that mining stocks underperform gold, and we also see that junior miners are weaker than senior miners.
The underperformance of gold miners is bearish—it's really that simple.
The fact that miners failed to move above their Jan. 9 high is also telling.
Now, let’s see how fast investors became disillusioned, at least with regard to the part about Powell’s speech.
“Nope, nope, nope” was the name of the game yesterday.
It took gold (GLD) just a few hours to move from a monthly (Feb) high to a monthly low.
We saw the same thing in the case of mining stocks, both senior (GDX) and junior (GDXJ).
This is very bearish. It shows just how unfounded Wednesday’s rally was. This also revealed a specific weakness of the precious metals market – a technical one.
Technical analysis is a tool that helps put recent price movements into context. One of its key tools are price formations.
How do formations work? Simply put, whenever the price creates a certain shape through its movement, something specific tends to happen.
In the current case, the GDX and GDXJ prices formed a so-called “head and shoulders” pattern. That’s one of the types of top formations. As the name suggests, the price is likely to fall after the formation is completed. The completion of the formation depends on whether the price is able to break the “neck” of the pattern – I marked them with red, dashed lines.
Mining stock prices are currently trading at those levels, but if they move lower - which is likely due to the multiple reasons I discussed yesterday - this formation will be completed (technically, we need to see 2-3 closes below the neckline to say that the move was confirmed) and the move lower will continue.
The silver price’s sudden intra-day outperformance is also a great reason to think that the next big move is to the downside. The silver price tends to fake breakouts and its strength right before a move in the opposite direction. Some might say that silver is one of the most difficult markets out there for beginning traders because of its counterintuitive specifics – and they wouldn’t be wrong.
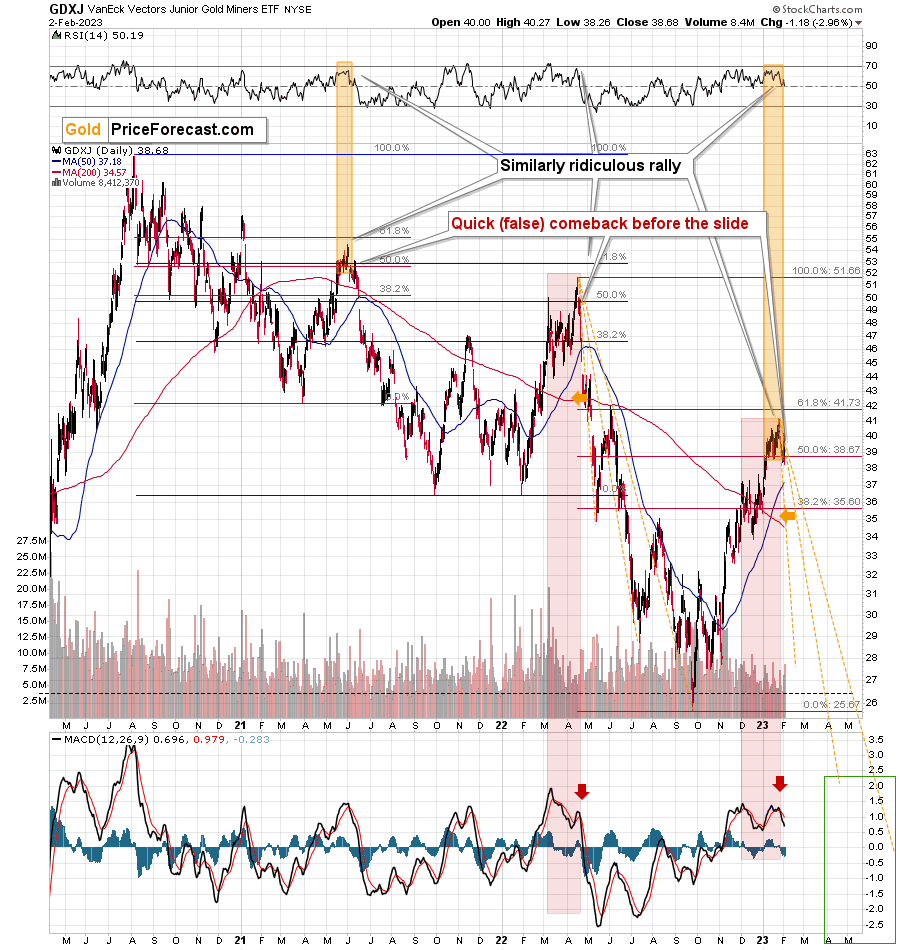
Moreover, focusing on mining stocks reveals that they are once again repeating their previous pattern, which – while lacking a fancy name – has very important implications.
Namely, the link between the current situation and what we saw in June 2021 and April 2022 (right after the tops!) remains intact. History tends to rhyme, and it seems that we’re about to see a very bearish verse.
In both previous cases, there was a small – but sharp – daily upswing before the decline continued – and we just saw that after Powell spoke. In the case of the 2021 analogy, we can see the similarity even in the RSI indicator, where it moved slightly up from about 50.
Consequently, the bearish implications remain intact, as does the sell signal from the MACD indicator that is already bearish on its own (this indicator flashes a sell signal when it – black line – moves below its signal line, which is marked in red), but it has an additional bearish meaning because it shows how the current situation is indeed similar to what happened at the 2022 top.
All in all, there are reasons to think that the next big move in mining stocks (and the rest of the precious metals sector) will be to the downside. And – while I can’t promise any kind of performance – that a lot of money could be made thanks to this upcoming slide.
Having said that, let’s take a look at the markets from a more fundamental point of view.
Has Gold Peaked?
Despite rallying sharply intraday on Feb. 2, gold reversed its gains and closed lower, while the USD Index reversed its losses and closed higher. As a result, while the recent gambit of ‘dollar down, gold up’ has helped uplift the PMs, a reversal of fortunes could be on the horizon.
Furthermore, while the crowd assumes that inflation will decline smoothly to 2%, its propensity to jump around should collapse this narrative and enhance volatility. Again, it’s not that inflation will hit new highs; it’s that it won’t return to 2% without immense demand destruction; and since that demand destruction is not present now, interest rates need to rise to suppress consumption and rebalance the U.S. labor market.
To that point, while supply-chain disruptions are a thing of the past, S&P 500 companies still maintain pricing power, which highlights the resiliency of demand; and with corporations poised to continue their hiking spree until demand dissipates, the medium-term outlooks are bullish for the U.S. federal funds rate (FFR), the USD Index, and real yields.
For example, even Waste Management – North America’s largest recycling and garbage collector – plans to raise its fees in 2023. COO John Morris said during the Q4 conference call on Feb. 1:
“As we move into 2023, our disciplined pricing programs combined with the strong momentum from 2022 and are expected to deliver core price of between 6.5% and 7% with yield approaching 5.5%. Our expectation is for strong rollover of 2022 price performance.”
Likewise, Mondelez – one of the largest confectionary companies in the U.S. – released its fourth-quarter earnings on Jan. 31; and with pricing the main driver of its performance, it’s naïve to assume that the Consumer Price Index (CPI) will return to 2% when major corporations are still posting higher figures.
Please see below:
 To explain, the blue box above shows that Mondelez recorded 19.5% year-over-year (YoY) organic revenue growth in North America in Q4. For context, the metric excludes the impact of acquisitions, divestitures and currency fluctuations. More importantly, the red box above shows that a 15.3% YoY increase in pricing was the main driver of the top-line strength. Consequently, the realities on the ground contrast with the narrative on Wall Street.
To that point, Mondelez CFO Luca Zaramella said during the Q4 conference call:
“As far as assumptions grow, we are planning for another year of double-digit inflation with dollars higher than in 2022. This inflation is driven by the continued elevated cost in packaging, energy, ingredients and labor.”
So, while we’ve warned repeatedly that corporations will continue to increase their prices until their costs normalize (which requires higher interest rates to suppress demand), Mondelez expects 2023 to look a lot like 2022.
Please see below:
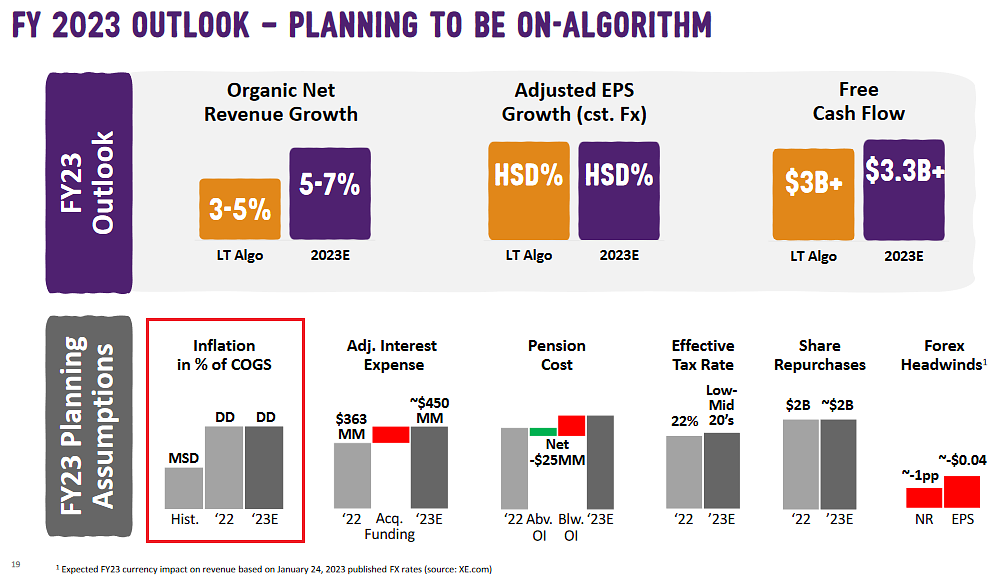 To explain, the red box above shows that Mondelez expects its 2023 inflation as a percentage of its cost of goods sold (COGS) to match 2022. More importantly, notice how the realized 2022 and estimated 2023 figures are roughly double their historical norm (labeled Hist.)?
Again, it’s not that we expect the CPI to run to 10%, but investors are kidding themselves if they think it will return to 2% when real economy companies are raising their prices by much more.
As further evidence, Hershey – another confectionary giant – released its fourth-quarter earnings on Feb. 2; and like Mondelez, the company also increased its prices materially.
Please see below:
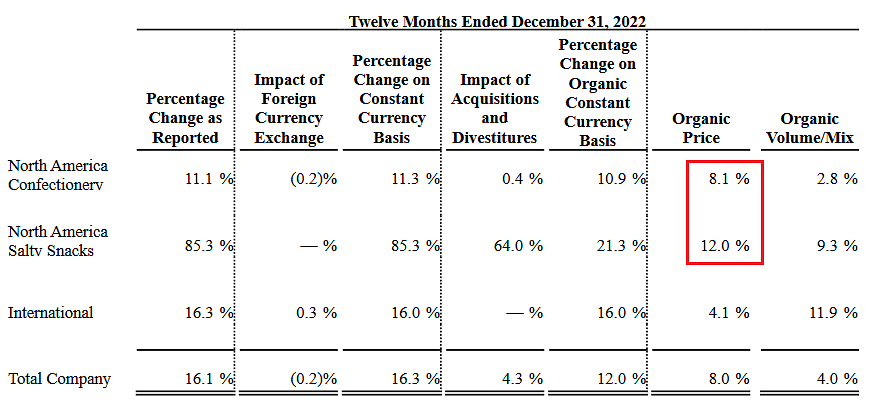 To explain, organic price increases across North America Confectionary and Salty Snacks were 8.1% YoY and 12% YoY, respectively, in Q4. Therefore, like the Sticky CPIs imply, inflation is much more prevalent than the narrative proclaims.
Furthermore, to normalize inflation, demand needs to decline to the point where companies stop raising prices; and as that occurs, they will reduce their headcount, which further decreases demand as the unemployment rate rises and consumers have less money to spend. But, the labor market remains resilient.
Please see below:
 To explain, initial and continuing jobless claims outperformed expectations on Feb. 2; and the performance of the former highlights why the Fed has not done enough.
Please see below:
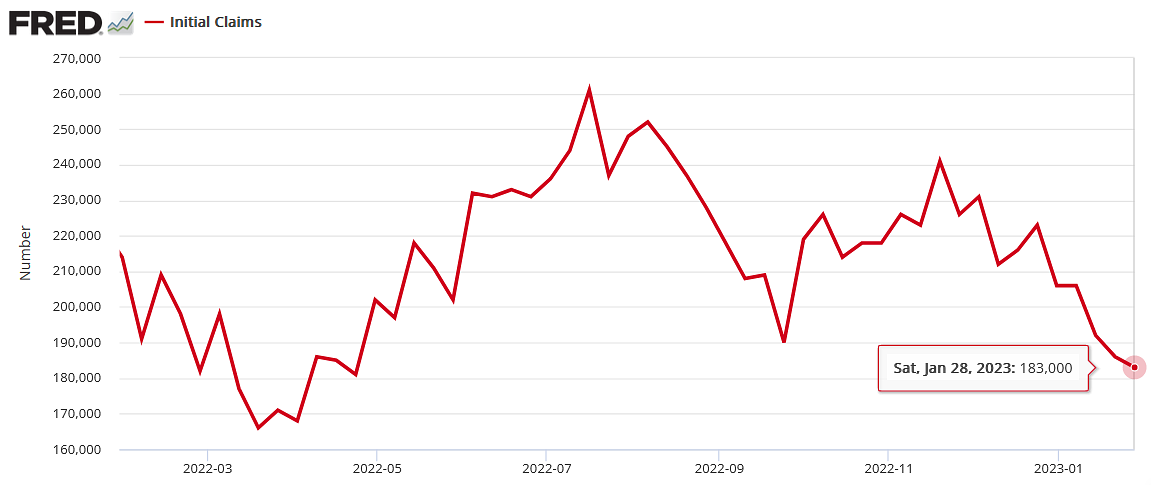 To explain, initial jobless claims track the number of Americans applying for unemployment benefits for the first time. If you analyze the movement, you can see that initial claims have been in a downtrend since mid-July, demonstrating how the Fed’s 18 rate hikes (25 basis point increments) have not collapsed the U.S. labor market.
The important point is that without rising unemployment, the persistent supply/demand imbalance is bullish for wage inflation, the FFR, real yields and the USD Index.
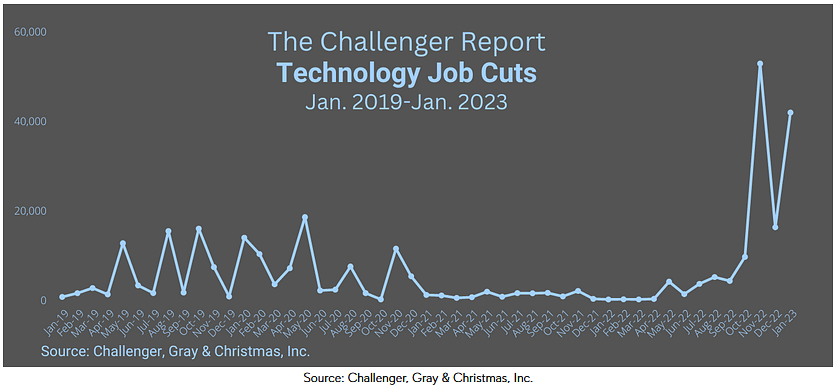
Finally, Challenger, Gray & Chirstmas Inc. released its job cuts report on Feb. 2. An excerpt read:
“U.S.-based employers announced 102,943 cuts in January, a 136% increase from the 43,651 cuts announced in December. It is 440% higher than the 19,064 cuts announced in the same month in 2022.”
However:
“The Technology sector announced the most cuts with 41,829, 41% of all cuts announced in January…. Since November 2022, which saw the highest monthly total for the sector since Challenger began tracking in 1993 with 52,771, Technology companies have announced 110,793 job cuts. January’s total is the second-highest for the sector on record.”
As a result, with the work-from-home bubble deflating, technology companies that over-hired during the pandemic are now slashing their headcount. Thus, it skews the consolidated metric upward and makes the headline number look worse. In other words, industries outside technology and real estate (pandemic and QE beneficiaries) remain resilient.
Please see below:
 Overall, the fundamentals continue to unfold as expected, and the crowd underestimates the resiliency of inflation. Moreover, with nine of the last 10 bouts of rising inflation ending with recessions, it’s likely a matter of when, not if, the next rendition occurs; and with the USD Index showcasing immense resiliency in recent days despite the misguided narratives, the days of ‘USD Index up, PMs down’ should return sooner rather than later.
How likely is a USD Index comeback over the next few months? Will a resilient labor market push the FFR higher, or will demand collapse and allow the Fed to pivot? What do you make of the inflation results from the recent earnings reports?
Inflation Hit Silver First. Will a Recession Be Next?
While we warned throughout 2021 and 2022 that unanchored inflation was counterintuitively bearish for the PMs – due to its propensity to wake up the bond market and the Fed – the prediction proved prescient as the QE beneficiaries declined sharply from their pandemic peaks.
Yet, only one-half of our fundamental thesis has played out, and a recession should help push silver to new lows. We’ve noted how nearly all rate-hike cycles and inflation fights end with recessions, and since liquidations confront the financial markets when panic erupts, all risk assets suffer.
Sure, gold may outperform the S&P 500 in a recessionary sell-off, but mining stocks and silver often suffer mightily. Therefore, with silver unable to hold $24 and its 50-day moving average rising each day, a short-term breakdown should be the first step along the road to a new nadir.
For example, while Goldilocks has been priced into risk assets – meaning rate cuts, low inflation and high corporate earnings – the consensus outcome is highly unrealistic. Conversely, it’s much more likely that this cycle ends with rate increases, low inflation and low corporate earnings.
Please see below:
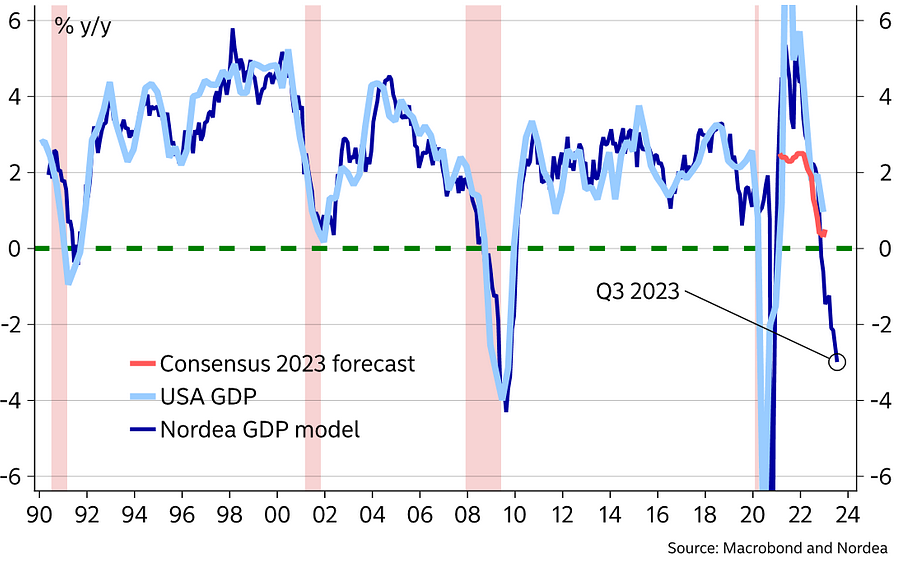 To explain, the light blue line above tracks the YoY percentage change in U.S. GDP, while the dark blue line above tracks the implied value in Q3 2023 from Nordea’s GDP model. If you analyze the relationship, you can see that it’s a tight fit.
More importantly, the dark blue line’s deceleration on the right side of the chart signals a material recession in the back half of 2023. As such, our fundamental thesis should have plenty of room to run.
As further evidence, the slowdown in industrial production is a recessionary canary in the coal mine.
Please see below:
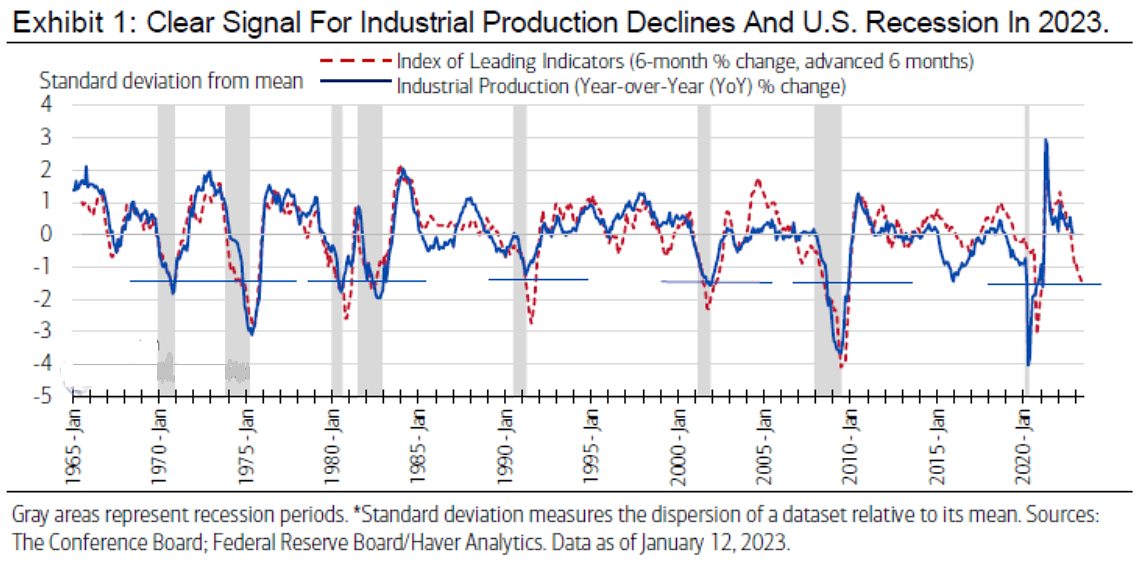 To explain, the blue line above tracks the z-score (ZS) of the YoY percentage change in industrial production, while the red dashed line above tracks the ZS of the six-month percentage change in the index of leading indicators (advanced by six months).
If you analyze the horizontal blue lines, you can see that whenever the leading index ZS has been ~1.5 standard deviations below the long-term average, a recession has occurred. Therefore, while industrial production remains supported for now, the leading index reading on the right side of the chart makes the medium-term implications profoundly bearish.
From another angle, the spread between the 3-month U.S. T-Bill yield (3M) and the U.S. 10-Year Treasury yield (10Y) is another recession omen.
Please see below:
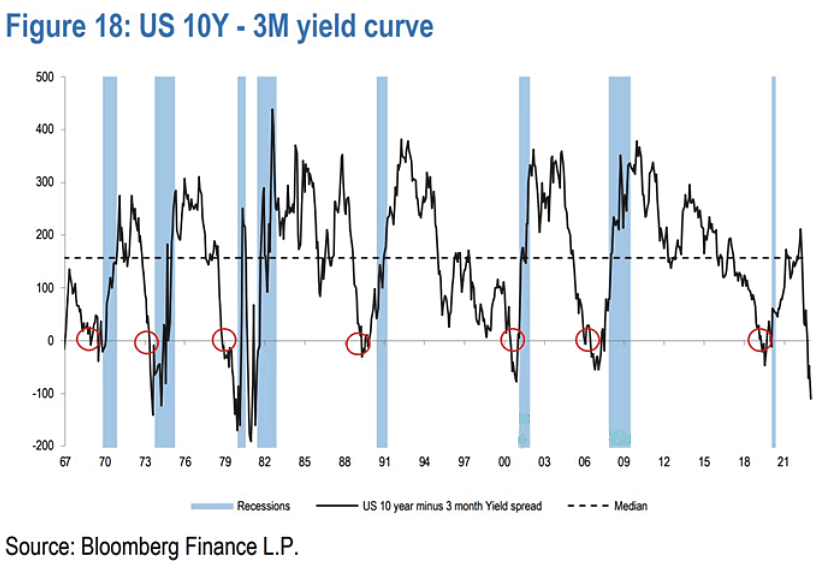 To explain, the black line above subtracts the 3M from the 10Y, and when the spread turns negative, the bond market is pricing in a higher FFR (hawkish Fed) and a potential recession (lower long-term yields).
Moreover, it also has a flawless track record, and the major inversion on the right side of the chart rivals the 1970s/1980s. So, again, it’s likely a matter of when, not if, the next recession occurs.
To that point, we’ve long warned that a pivot amid high inflation is bearish, not bullish. In a nutshell: when inflation is high and yield curves invert, the eventual recession overpowers the jubilation of rate cuts.
Please see below:
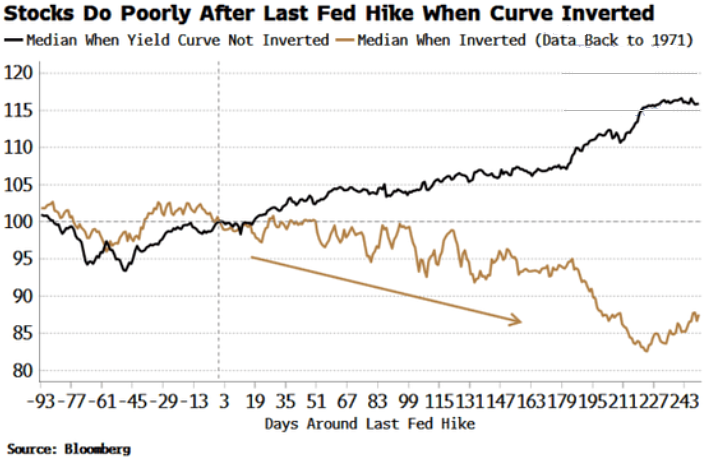 To explain, the black and brown lines above track the median performance of stocks when the yield curve isn’t and is inverted. As you can see, the brown line heads materially lower when the recessionary impact of inverted curves becomes apparent.
Furthermore, the vertical gray dotted line near the left side of the chart represents the Fed’s last rate hike (dating back to 1971). As you can see, pivots, pauses or whatever you want to call them, are bearish when inflation is high and yield curves are inverted.
As it stands, our recurring message holds true: the fundamentals guide the Fed, not the other way around. Therefore, regardless of what Fed Chairman Jerome Powell says or does, he can’t change the ramifications of what’s already occurred. Inflation is too high, and the bond market is telling you that Powell can’t win this war without a recession.
In addition, the 1970s showed that rate cuts amid high inflation didn’t work either, as the FFR reversed higher, and recessions followed. Consequently, whether he hikes, pauses or cuts, the cycle should end the same, and the crowd is ignoring these historical lessons at their own peril.
Overall, the silver price is hanging on by a thread, and the second part of our fundamental thesis likely lies ahead; and while a resilient U.S. labor market has delayed the drama, the strength won’t last forever. Thus, with the USD Index a major beneficiary when recessionary panic unfolds, the months ahead should be bullish for the greenback and bearish for the PMs.
How soon could a recession occur? Or, do you believe this cycle will end with a soft landing? Why does the crowd think rate cuts amid high inflation are bullish, despite the contrasting historical record?
The Bottom Line
Gold suffered a profound reversal, and the GDXJ ETF gave back all of its FOMC-induced gains. Moreover, when we combine mining stocks’ recent relative weakness with silver’s inability to rise, gold is the only PM showcasing resiliency; and with the USD Index gearing up for another strong run, we believe the PMs’ risk-reward propositions are heavily skewed to the downside.
Overall, the PMs declined on Feb. 2, as major intraday swings confronted gold and the USD Index. Likewise, with the former’s momentum waning, and the technicals and fundamentals still profoundly bearish, the PMs’ likely plunges have been delayed, not derailed. As such, a significant shift could be on the horizon.
Overview of the Upcoming Part of the Decline
- It seems to me that the corrective upswing is over (or about to be over) and that the next big move lower is already underway (or that it’s about to start).
- If we see a situation where miners slide in a meaningful and volatile way while silver doesn’t (it just declines moderately), I plan to – once again – switch from short positions in miners to short positions in silver. At this time, it’s too early to say at what price levels this could take place and if we get this kind of opportunity at all – perhaps with gold prices close to $1,500 - $1,550.
- I plan to switch from the short positions in junior mining stocks or silver (whichever I’ll have at that moment) to long positions in junior mining stocks when gold / mining stocks move to their 2020 lows (approximately). While I’m probably not going to write about it at this stage yet, this is when some investors might consider getting back in with their long-term investing capital (or perhaps 1/3 or 1/2 thereof).
- I plan to return to short positions in junior mining stocks after a rebound – and the rebound could take gold from about $1,450 to about $1,550, and it could take the GDXJ from about $20 to about $24. In other words, I’m currently planning to go long when GDXJ is close to $20 (which might take place when gold is close to $1,450), and I’m planning to exit this long position and re-enter the short position once we see a corrective rally to $24 in the GDXJ (which might take place when gold is close to $1,550).
- I plan to exit all remaining short positions once gold shows substantial strength relative to the USD Index while the latter is still rallying. This may be the case with gold prices close to $1,400 and GDXJ close to $15 . This moment (when gold performs very strongly against the rallying USD and miners are strong relative to gold after its substantial decline) is likely to be the best entry point for long-term investments, in my view. This can also happen with gold close to $1,400, but at the moment it’s too early to say with certainty.
- The above is based on the information available today, and it might change in the following days/weeks.
You will find my general overview of the outlook for gold on the chart below:
Please note that the above timing details are relatively broad and “for general overview only” – so that you know more or less what I think and how volatile I think the moves are likely to be – on an approximate basis. These time targets are not binding nor clear enough for me to think that they should be used for purchasing options, warrants, or similar instruments.
Letters to the Editor
We received a few messages over e-mail, but as we are moving to our new platform, we will be transferring them below the articles as comments – and that’s where we’ll be replying to them.
Asking your questions below the articles or in the spaces called “Ask the Community” or “Position Sizes” directly will help us deliver a reply sooner. In some cases, someone from the community might reply and help even before we do.
Please remember about the Pillars of our Community, especially about the Kindness of Speech Pillar.
Also, if there’s anything that you’re unhappy with, it’s best to send us a message at [email protected].
Please note that this section is going to go away within the next 1-8 weeks, as you can add comments/questions below the article on Golden Meadow – the platform that we’re using to provide our analyses. Your notification e-mails include an invitation link that allows you to access the “Gold Trading Alerts” space.
Also, if you haven’t had the chance to see the video, in which I’m talking about the new platform and why we essentially moved from Sunshine Profits to Golden Meadow, I strongly encourage you to do so:
Summary
Summing up, it seems that the major bottom in the USD Index is in (or at hand), while the correction in stocks, gold, silver, and mining stocks is over – or very close to being over.
Gold and silver correct about 61.8% of their 2022 decline, while junior miners corrected a bit more than 50% of the decline, but not more than 61.8% thereof. This is exactly how the big 2021 and 2022 declines in junior miners started.
Given the above, gold’s very long-term resistance (the 2011 high!) and the situation in the USD Index, it seems that the next big move lower in the precious metals sector is about to start.
Now, as more investors realize that interest rates will have to rise sooner than expected, the prices of precious metals and mining stocks (as well as other stocks) are likely to fall. In my opinion, the current trading position is going to become profitable in the following weeks, and quite possibly in the following days. And while I can’t promise any kind of performance, I fully expect it to become very profitable before it’s over and to prolong our 2022 winning streak.
After the final sell-off (that takes gold to about $1,350-$1,500), I expect the precious metals to rally significantly. The final part of the decline might take as little as 1-5 weeks, so it's important to stay alert to any changes.
As always, we'll keep you – our subscribers – informed.
To summarize:
Trading capital (supplementary part of the portfolio; our opinion): Full speculative short positions (300% of the full position) in junior mining stocks are justified from the risk to reward point of view with the following binding exit profit-take price levels:
Mining stocks (price levels for the GDXJ ETF): binding profit-take exit price: $20.32; stop-loss: none (the volatility is too big to justify a stop-loss order in case of this particular trade)
Alternatively, if one seeks leverage, we’re providing the binding profit-take levels for the JDST (2x leveraged). The binding profit-take level for the JDST: $22.87; stop-loss for the JDST: none (the volatility is too big to justify a SL order in case of this particular trade).
For-your-information targets (our opinion; we continue to think that mining stocks are the preferred way of taking advantage of the upcoming price move, but if for whatever reason one wants / has to use silver or gold for this trade, we are providing the details anyway.):
Silver futures downside profit-take exit price: $14.32
SLV profit-take exit price: $13.42
ZSL profit-take exit price: $48.87
Gold futures downside profit-take exit price: $1,504
HGD.TO – alternative (Canadian) 2x inverse leveraged gold stocks ETF – the upside profit-take exit price: $16.47
HZD.TO – alternative (Canadian) 2x inverse leveraged silver ETF – the upside profit-take exit price: $36.87
Long-term capital (core part of the portfolio; our opinion): No positions (in other words: cash)
Insurance capital (core part of the portfolio; our opinion): Full position
Whether you’ve already subscribed or not, we encourage you to find out how to make the most of our alerts and read our replies to the most common alert-and-gold-trading-related-questions.
Please note that we describe the situation for the day that the alert is posted in the trading section. In other words, if we are writing about a speculative position, it means that it is up-to-date on the day it was posted. We are also featuring the initial target prices to decide whether keeping a position on a given day is in tune with your approach (some moves are too small for medium-term traders, and some might appear too big for day-traders).
Additionally, you might want to read why our stop-loss orders are usually relatively far from the current price.
Please note that a full position doesn't mean using all of the capital for a given trade. You will find details on our thoughts on gold portfolio structuring in the Key Insights section on our website.
As a reminder - "initial target price" means exactly that - an "initial" one. It's not a price level at which we suggest closing positions. If this becomes the case (as it did in the previous trade), we will refer to these levels as levels of exit orders (exactly as we've done previously). Stop-loss levels, however, are naturally not "initial", but something that, in our opinion, might be entered as an order.
Since it is impossible to synchronize target prices and stop-loss levels for all the ETFs and ETNs with the main markets that we provide these levels for (gold, silver and mining stocks - the GDX ETF), the stop-loss levels and target prices for other ETNs and ETF (among other: UGL, GLL, AGQ, ZSL, NUGT, DUST, JNUG, JDST) are provided as supplementary, and not as "final". This means that if a stop-loss or a target level is reached for any of the "additional instruments" (GLL for instance), but not for the "main instrument" (gold in this case), we will view positions in both gold and GLL as still open and the stop-loss for GLL would have to be moved lower. On the other hand, if gold moves to a stop-loss level but GLL doesn't, then we will view both positions (in gold and GLL) as closed. In other words, since it's not possible to be 100% certain that each related instrument moves to a given level when the underlying instrument does, we can't provide levels that would be binding. The levels that we do provide are our best estimate of the levels that will correspond to the levels in the underlying assets, but it will be the underlying assets that one will need to focus on regarding the signs pointing to closing a given position or keeping it open. We might adjust the levels in the "additional instruments" without adjusting the levels in the "main instruments", which will simply mean that we have improved our estimation of these levels, not that we changed our outlook on the markets. We are already working on a tool that would update these levels daily for the most popular ETFs, ETNs and individual mining stocks.
Our preferred ways to invest in and to trade gold along with the reasoning can be found in the how to buy gold section. Furthermore, our preferred ETFs and ETNs can be found in our Gold & Silver ETF Ranking.
As a reminder, Gold & Silver Trading Alerts are posted before or on each trading day (we usually post them before the opening bell, but we don't promise doing that each day). If there's anything urgent, we will send you an additional small alert before posting the main one.
Thank you.
Przemyslaw K. Radomski, CFA
Founder, Editor-in-chief


