Briefly: in our opinion, full (300% of the regular position size) speculative short positions in junior mining stocks are justified from the risk/reward point of view at the moment of publishing this Alert.
Before starting today’s analysis, I would like to emphasize that we might see some erratic price movements with regard to the USD Index – gold link. The reason is that today is the day when the news from Europe hits the market. The ECB President spoke, and the account of the monetary policy meeting will be released as well.
This can move the value of the USD Index because the EUR/USD is the largest (with over 50% weight) component of the index. So, if the value of the euro moves higher, both gold and the USD might move lower. And if the value of the euro moves lower, both gold and the USD might move higher – at least relative to the euro.
This might make one think that gold is either showing strength or weakness relative to the U.S. dollar, but it would actually be reacting to what’s happening in the Eurozone. So, while it’s usually a good idea to monitor the gold-USDX link, today it’s better not to focus on it too much.
Having said that, let’s check what gold did yesterday and what’s going on in today’s pre-market trading in gold futures.
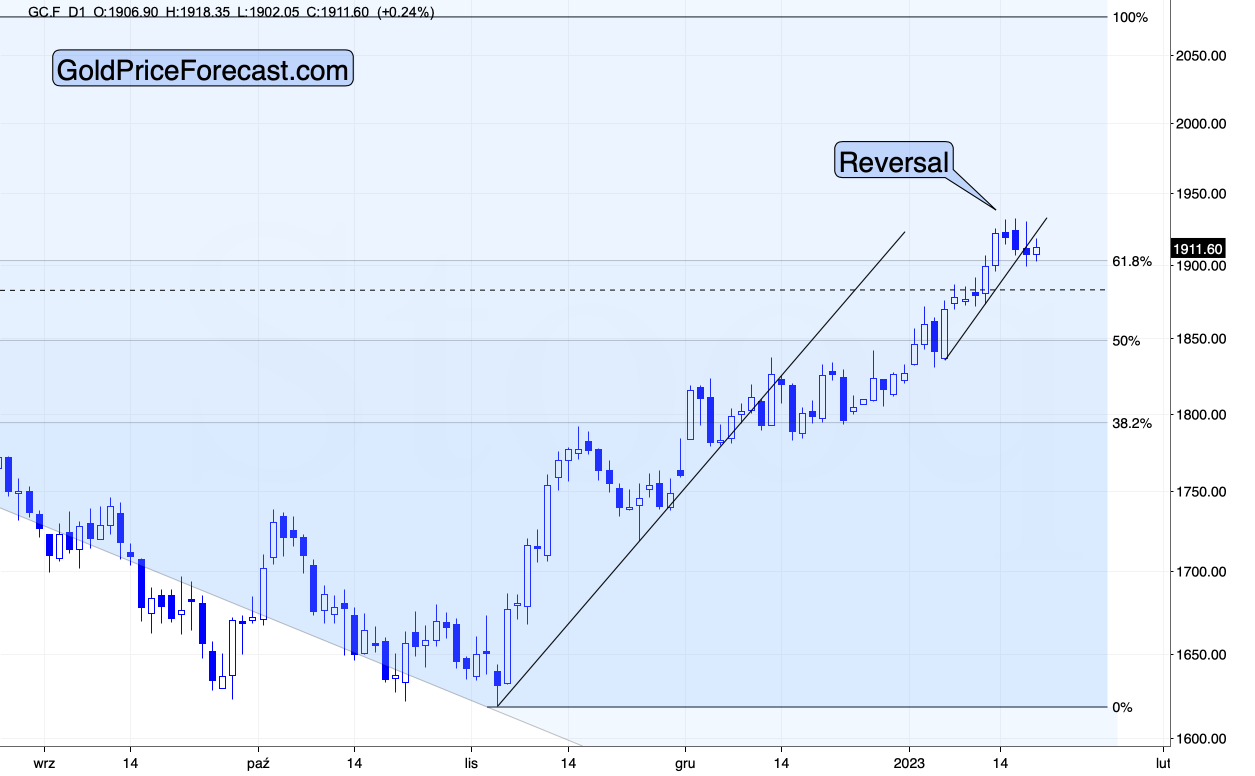
Yesterday, gold moved slightly below the $1,900 level, the 61.8% Fibonacci retracement, and the rising support line.
Later, the gold price moved back up and ended the day slightly above the $1,900 level and the 61.8% Fibonacci retracement, but below the rising support line.
So, we had an invalidation of the breakouts above the $1,900 and 61.8% retracement levels in intraday terms and a breakdown below the rising support line in terms of both intraday prices and daily closing prices.
In today’s trading, gold is trading sideways, and it didn’t invalidate the breakdown below the rising support line. In fact, it seems to have worked as intraday resistance.
So, is the top in? That’s quite possible given how mining stocks are performing.
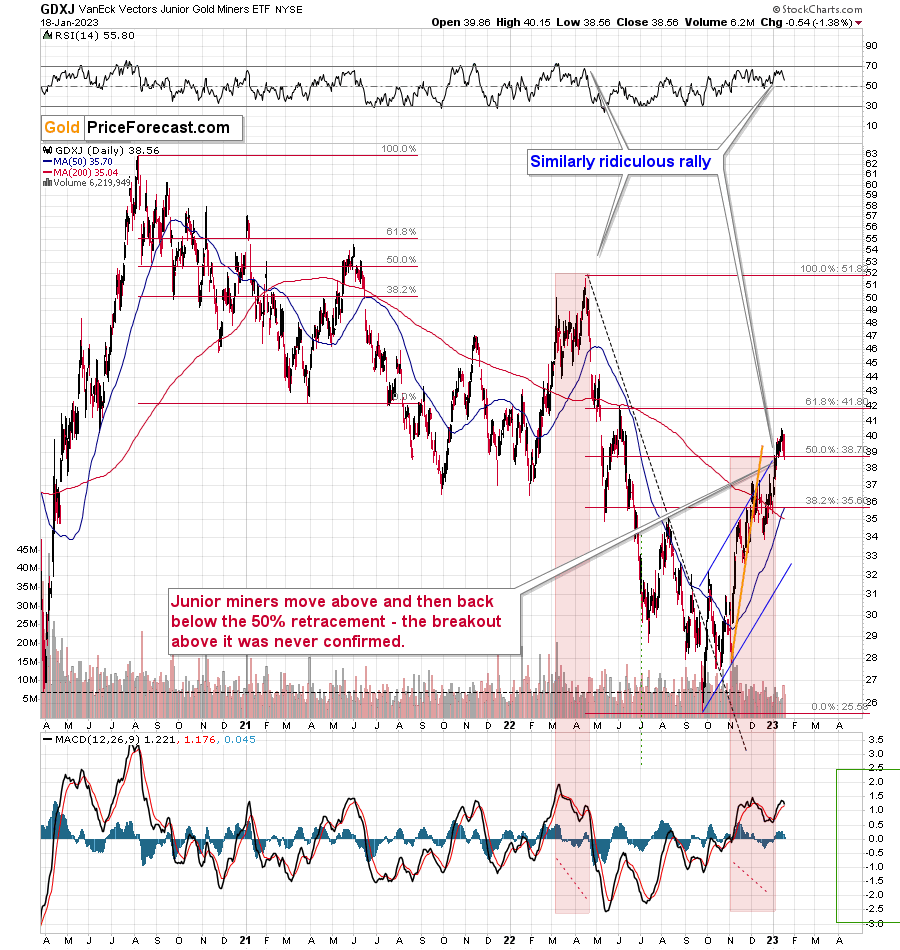
The GDXJ – proxy for junior mining stocks – just invalidated its breakout above the 50% Fibonacci retracement level, which is a very bearish sign. That’s the case on its own, but let’s not forget that the entire recent rally is similar to what we saw in early 2022. Once the GDXJ slides below its initial top, the key confirmation will be in.
As you can see on the above chart – the 2022 top was followed by a very sharp slide. The entire rally was quickly erased, and then the juniors declined much more.
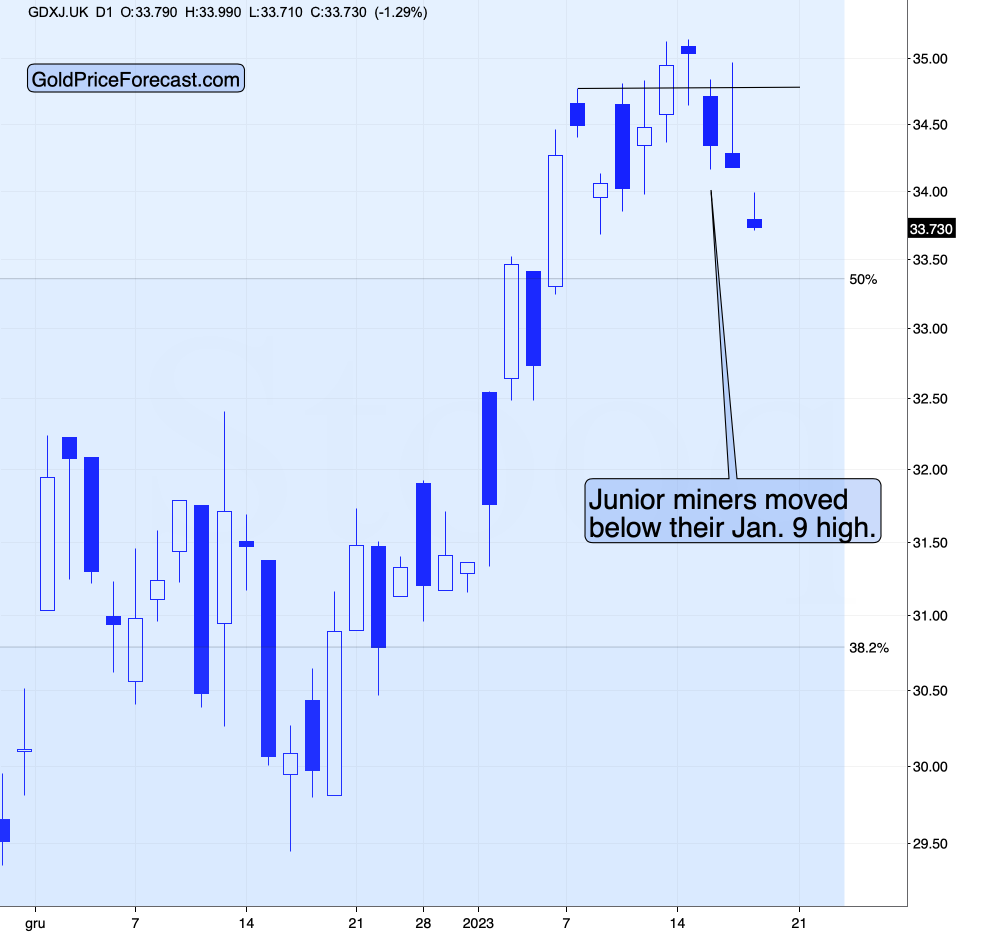
Interestingly, in today’s London trading, the GDXJ is already down significantly, even though gold futures are hesitating.
Since miners tend to lead gold, this is a very bearish indication for the short term.
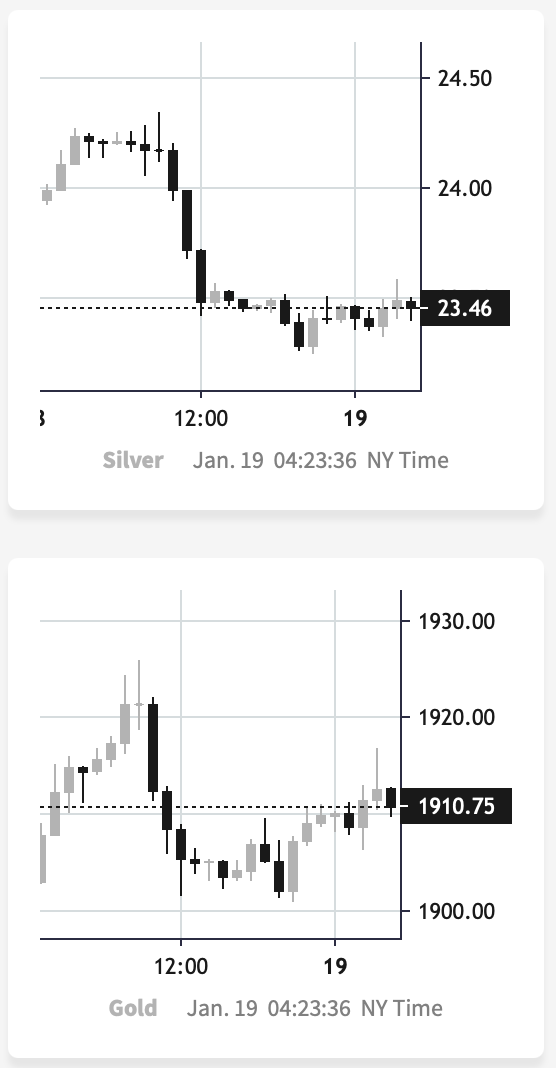
Meanwhile, silver (chart courtesy of https://www.silverpriceforecast.com) once again failed to hold above the $24 level.
That’s yet another reason to think that the top is already in. Whatever happens, the white metal is unable to rally more.
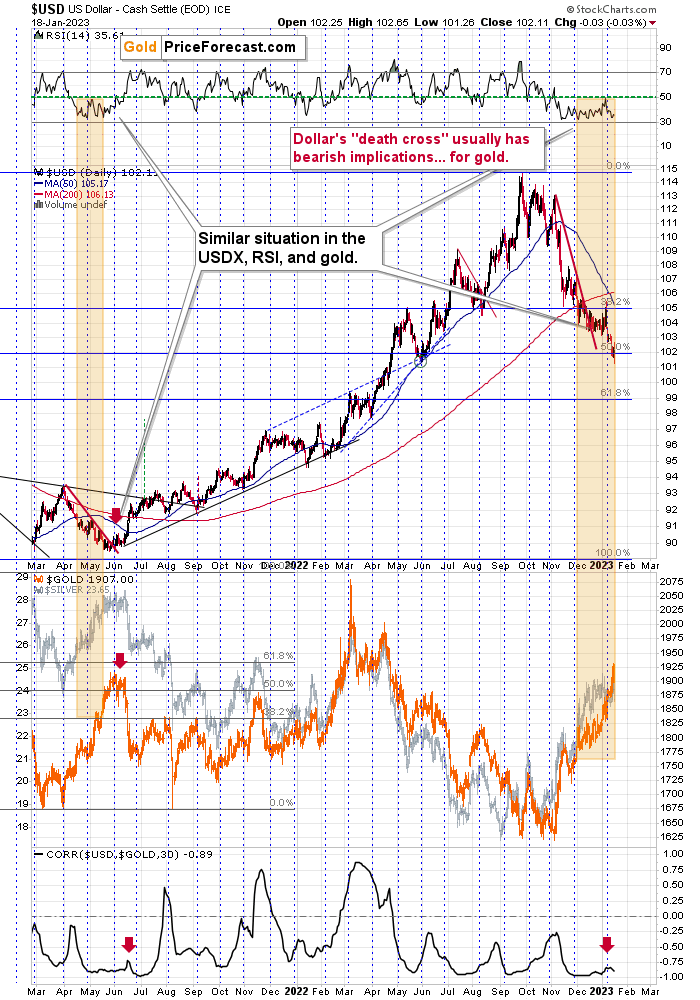
As always, context is critical. This time, we saw a major reversal in the key part of the context – in the USD Index.
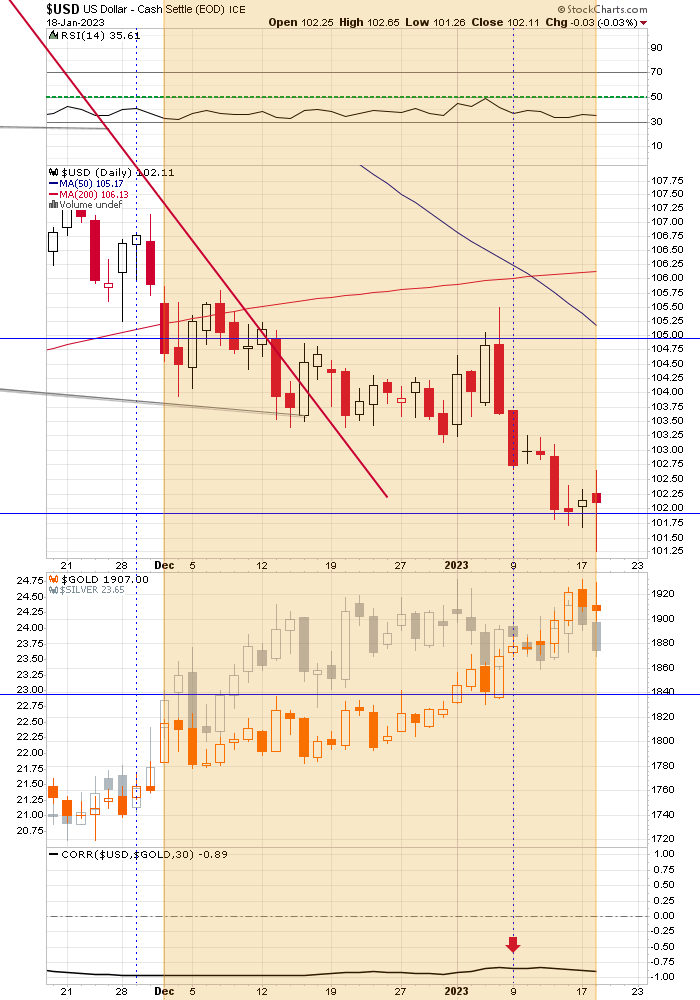
The USDX moved below and then rallied back above its 50% Fibonacci retracement level (reversing from more or less its mid-2022 low). It might not be clearly visible on the above chart, so let’s zoom in.
Now it’s clear that the move below 102 (and even 101.5!) was invalidated, and we saw a major reversal. At the moment of writing these words, the USDX futures are trading at about 102 – above the above-mentioned 50% retracement.
This means that the USD Index is likely to rally, and this – given the strongly negative correlation between the two – is likely to trigger declines in gold.
Of course, correlation doesn’t imply causation, but this actually is the case, as gold price is, well, priced in terms of the U.S. dollar.
All in all, the outlook for the precious metals market looks bearish, especially for junior mining stocks.
Having said that, let’s take a look at the markets from a more fundamental point of view.
Stocks Sink and Gold Sputters
With the S&P 500 reversing sharply intraday on Jan. 18, we warned before the open that seasonality made the short-term outlook highly unattractive. We wrote:
S&P 500 seasonality often turns in mid-January, and the negativity persists until the end of the month (…).. Overall, while the fundamental backdrop has always been bearish, the sentiment setup also supports lower precious metals prices. Consequently, we view the risks as heavily skewed to the downside, especially for silver and mining stocks.
Thus, with silver and mining stocks suffering the brunt of investors’ wrath, the January blues arrived on cue. But, with gold only down modestly on the day, the yellow metal demonstrated relative strength. However, with the crowd misjudging the fundamental backdrop and assuming that rate cuts will commence in the months ahead, Fed officials continue to maintain their hawkish stance.
For example, Richmond Fed President Thomas Barkin said on Jan. 17:
“You just can’t declare victory too soon (…). I want to see inflation, and median and trimmed mean, compellingly headed back to our target. As long as inflation stays elevated, we need to continue to move the needle, to tighten if you will, ever more.”
Likewise, Philadelphia Fed President Patrick Harker said on Jan. 18:
“High inflation is a scourge, leading to economic inefficiencies and hurting Americans of limited means disproportionately.” The Fed's “goal is to slow the economy modestly and to bring demand more in line with supply.”
He added:
“Hikes of 25 basis points will be appropriate going forward (…). I expect that we will raise rates a few more times this year.”
In addition, Cleveland Fed President Loretta Mester said on Jan. 18:
“We’re beginning to see the kind of actions that we need to see,” but “I still see the larger risk coming from tightening too little.”
As a result, she reiterated her commitment to a 5%+ U.S. federal funds rate (FFR).
Please see below:
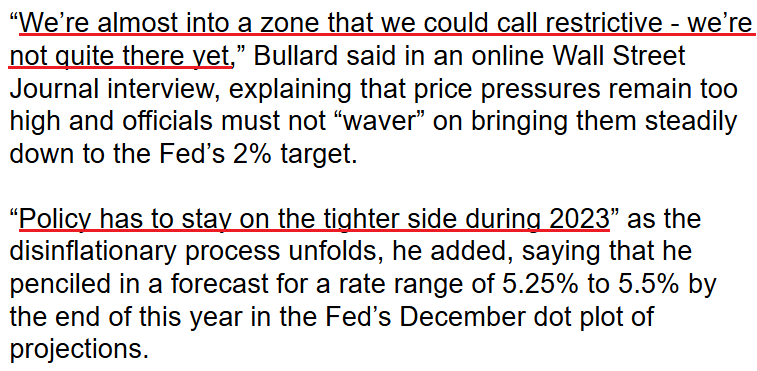
Continuing the theme, St. Louis Fed President James Bullard said on Jan. 18:
“Why not go to where we're supposed to go? Why stall…? Let's move the policy rate to the right level” and “see how 2023 unfolds.”
Therefore, he prefers “frontloading” rate hikes so that the FFR can reach the 5.25% to 5.5% range sooner rather than later.
Please see below:
Adding her voice, Dallas Fed President Lorie Logan said on Jan. 18:
“I see elevated services inflation as a symptom of an overheated economy, particularly a tight labor market, which will have to be brought into better balance for the overall inflation rate to return sustainably to 2%.”
Furthermore, she advocated for continued quantitative tightening (QT):
“With the [standing repo facility] as a backstop and the power of market incentives to redistribute liquidity, I am confident that we have room to continue running off our assets for quite some time,” Logan said. “We’ll need to watch the outlook and adjust our balance-sheet strategy appropriately so that liquidity levels don’t fall too low.”
Consequently, while Fed officials remain aligned in their hawkish expectations, investors are pricing in rate cuts in mid-2023. Moreover, not only does the crowd expect a dovish 180, but they don’t even expect the peak FFR to reach 5%. As it stands, an epic battle is underway, and investors have called the Fed’s bluff.
However, we warned on Dec. 16, 2021, that Chairman Jerome Powell’s deputies are often leading indicators of future Fed policy. We wrote:
As one of the most important quotes of the [post-FOMC] press conference, [Powell] admitted:
“My colleagues were out talking about a faster taper and that doesn’t happen by accident. They were out talking about a faster taper before the president made his decision. So it’s a decision that effectively was more than entrained.”
And while Powell sounded a little rattled during the exchange, his slip highlights the importance of Fed officials’ hawkish rhetoric. Essentially, when Clarida, Waller, Bostic, Bullard, etc., are making the hawkish rounds, “that doesn’t happen by accident.” As such, it’s an admission that his understudies serve as messengers for pre-determined policy decisions.
More importantly, the fundamentals support the Fed’s view, and the crowd likely has it wrong. In 2021, when investors and the Fed were aligned in their “transitory” beliefs, we warned that stubborn inflation would lead to a material increase in interest rates; and now, we’re aligned with the Fed, and the crowd is the lone wolf.
But, not only does history show that interest rates are too low to win this inflation fight, but near record wage growth (according to the Atlanta Fed) and a ~50-year low unemployment rate are not indicative of demand destruction. Therefore, when investors overreact to soft economic data, they miss the forest through the trees.
Please see below:
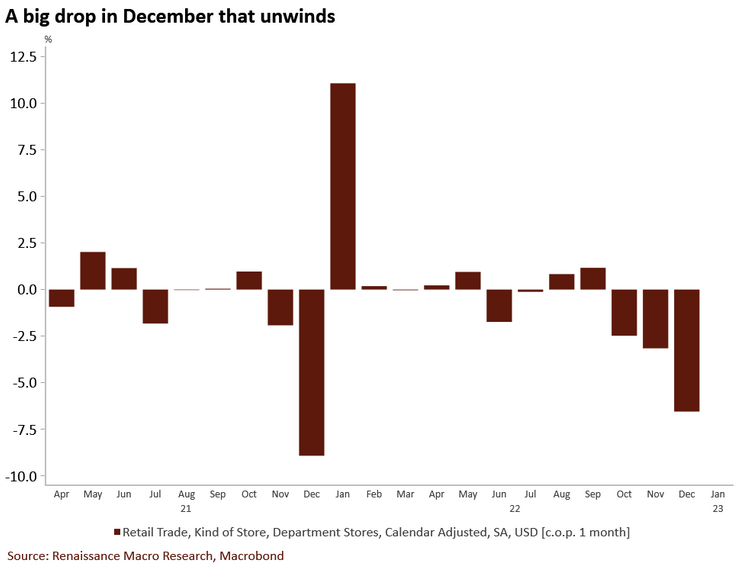
To explain, U.S. retail sales came in weaker than expected on Jan. 18, and the brown bars on the right side of the chart above show a sharp month-over-month (MoM) deceleration in department store retail sales
Yet, if you analyze the middle of the chart, you can see that while sharp pullbacks were present in November and December 2021 (combined), the weakness reversed materially in January 2022; and while seasonal adjustments often skew the data, the current weakness should show a bullish reversal in the months ahead.
Also noteworthy, when the Fed hiked the FFR rapidly in 2022, the U.S. housing market was the most affected, as higher long-term interest rates increased mortgage rates; and while the crowd opined that a crisis was on the horizon, the sector weathered the interest rates storm.
Furthermore, now that long-term Treasury yields have declined, the housing dip buyers are back, and it's another indicator of why demand destruction has not reached the levels necessary to win this inflation battle.
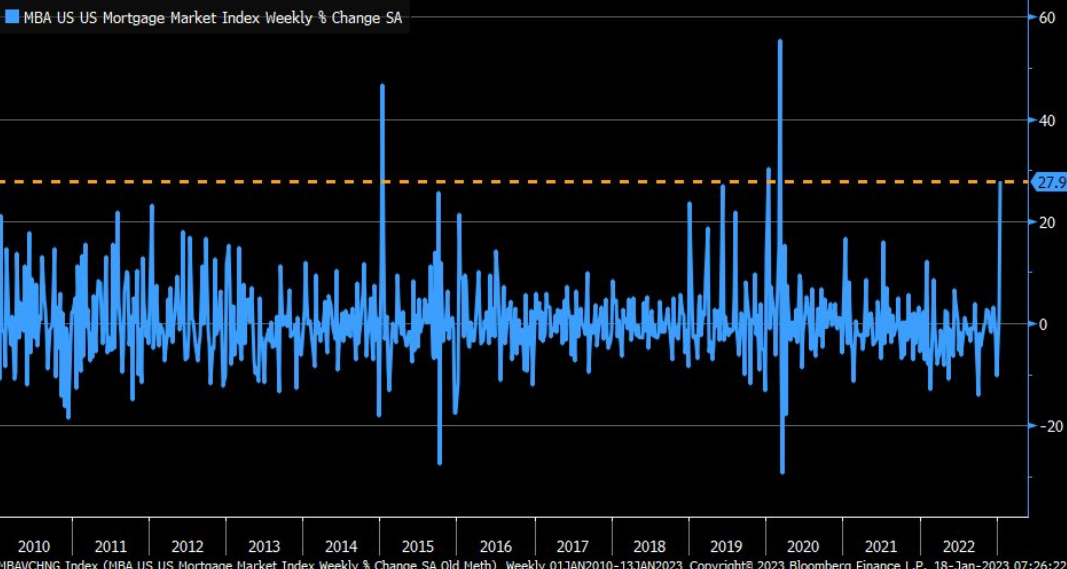
Please see below:
To explain, U.S. mortgage applications spiked by nearly 28% week-over-week (WoW), the largest WoW increase since March 2020. Likewise, if you analyze the orange horizontal dashed line, you can see that the weekly jump was one of the largest in more than 12 years.
As a result, whenever the crowd assumes that small inflation progress means the war is over, the loosening of financial conditions only spurs more demand (like with mortgage applications) and makes the Fed’s job more difficult. Thus, the consensus is highly uninformed about the historical implications of how inflation behaves, and how it’s finally resolved.
Overall, the gold price sidestepped much of the carnage, but the fundamentals remain highly bearish. With the crowd expecting the Fed to cut interest rates in roughly six months, their front-run optimism is the opposite of what the Fed wants. Consequently, due to the contrasting fundamentals, we believe the motto of ‘don’t’ fight the Fed’ is warranted in this instance.
But, let us know what you think: where do you see the FFR going? Should you trust the bond market or the Fed? And why is the crowd so happy to ignore the historical lessons about inflation?
Silver Still Struggles With $24
With silver going sideways for nearly a month, the white metal’s weakening momentum is an ominous sign for the precious metals market. Moreover, with mining stocks underperforming gold in recent days, they’re also starting to show cracks in their foundation.
Yet, while recession fears have increased, the Fed’s Beige Book (released on Jan. 18) stated that employment and wage inflation “remained elevated.” An excerpt read:
“Employment continued to grow at a modest to moderate pace for most Districts…. While some Districts noted that labor availability had increased, firms continued to report difficulty in filling open positions. Many firms hesitated to lay off employees even as demand for their goods and services slowed and planned to reduce headcount through attrition if needed.
“With persistently tight labor markets, wage pressures remained elevated across Districts, though five Reserve Banks reported that these pressures had eased somewhat. Some employers noted they have continued to offer bonuses and enhanced benefits to attract and retain workers.”
On top of that:
“Selling prices increased at a modest or moderate pace in most Districts, though many said that the pace of increases had slowed from that of recent reporting periods.”
Therefore, while inflation has cooled somewhat as the lagged effect of lower commodity prices from October filters through the U.S. economy, the U.S. labor market remains far from the demand destruction required to curb inflation.
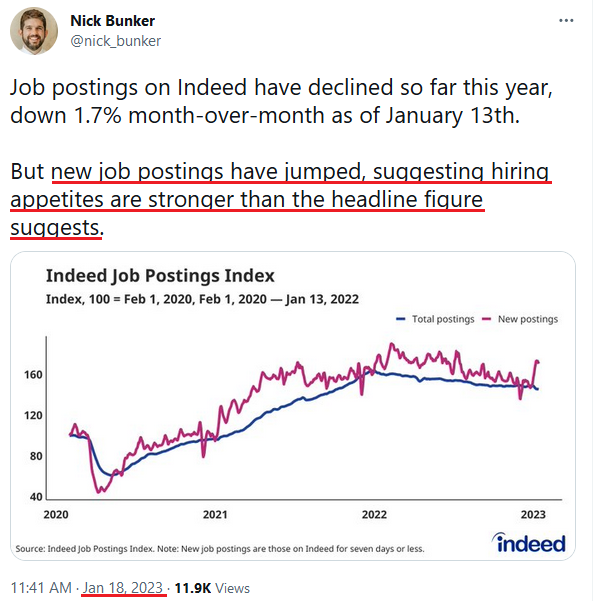
As further evidence, Nick Bunker, Economic Research Director for North America at the Indeed Hiring Lab, tweeted on Jan. 18:
Although, while the crowd assumes that rate cuts are on the horizon, a realization would only spur more demand, tighten the U.S. labor market even more, and further uplift wage inflation. As a result, their expectations contrast fundamental logic.
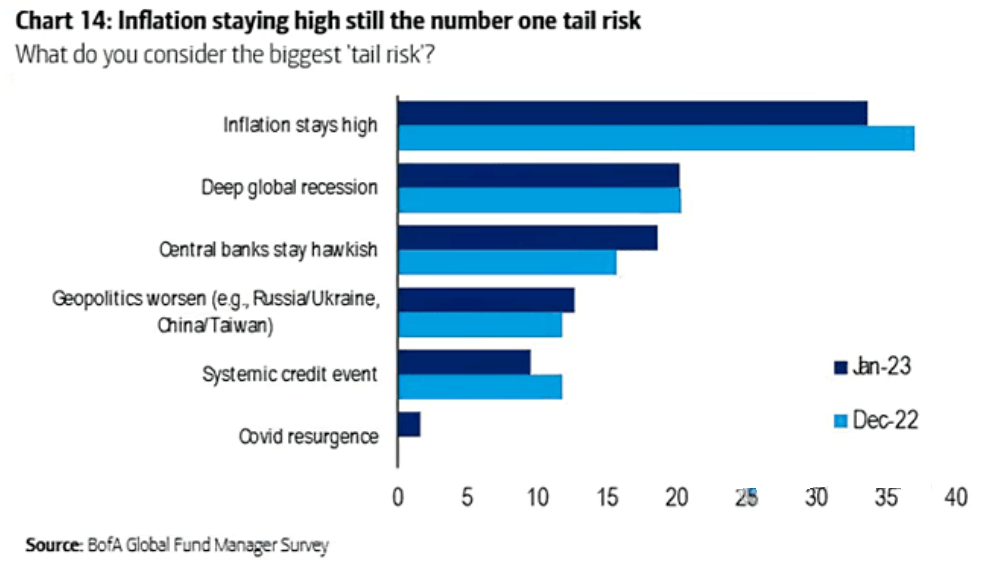
Furthermore, while the consensus views the outcome as a ‘tail risk’ (a low probability, high impact event), we see it as the most likely outcome.
Please see below:
To explain, Bank of America’s latest Global Fund Manager Survey shows that high inflation remains the greatest tail concern among institutional investors, with hawkish central banks in third.
The data speaks to the consensus mindset that inflation should fall quickly, and there is only a small chance that it won’t. So, rate cuts are likely, and a return to pre-pandemic monetary policy is on the horizon. However, the fundamentals contrast this overwhelmingly consensus narrative, and that’s why there is plenty of room for potential re-pricings in the months ahead.
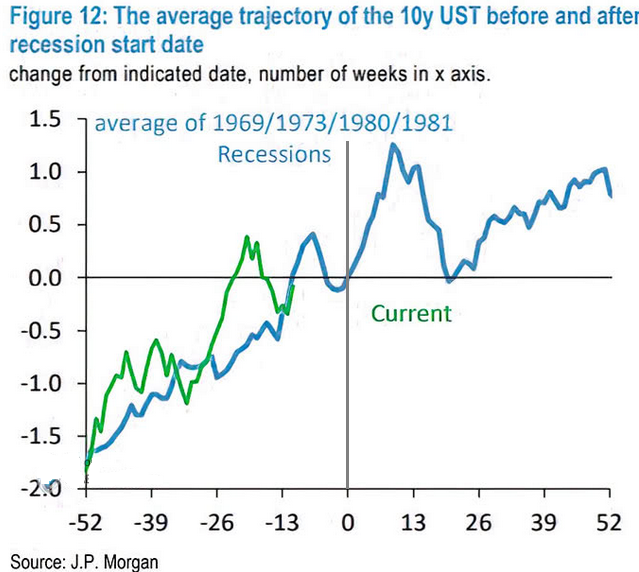
Finally, while a recession should arrive in late 2023, the average price action in the 1970s/1980s shows the events were bullish for the U.S. 10-Year Treasury yield. Moreover, since the FFR rose to new cycle highs during three of the four recessions, the crowd is overly optimistic about the future path of interest rates.
Please see below:
To explain, the blue line above tracks the average path of the U.S. 10-Year Treasury yield during the four recessions from 1969 to 1981, while the green line above tracks its current movement. If you analyze the vertical gray line in the middle of the chart (at 0), you can see that when the recessions hit, the U.S. 10-Year Treasury yield often rallied for weeks before a pullback occurred and another uptrend began.
Consequently, the historical lessons about inflation and interest rates are clear, even though the crowd assumes ‘this time is different.’
Overall, silver’s pullback was likely a sign of things to come, as the price remains well above its fundamental value. In addition, with silver’s outperformance of gold often a precursor to sharp drawdowns, the relative strength exhibited in October and November has become relative weakness in December and January.
Therefore, the technical playbook signals that meaningful reversals for gold, silver and mining stocks should occur sooner rather than later.
Are you a buyer of silver at these levels? How could an S&P 500 pullback impact the white metal? How important is the labor market regarding Fed officials’ decision-making?
The Bottom Line
While sentiment shifted as expected on Jan. 18, the fundamentals have been profoundly bearish for months; and while a standoff is unfolding between the Fed and the financial markets, the data supports the former, not the latter. As a result, while earnings reports may sway sentiment in the days ahead, a higher FFR should push the U.S. economy into recession, not premature demand destruction. As such, we still expect material downside for risk assets in the months ahead.
In conclusion, the PMs declined on Jan. 18, as the USD Index was flat and the U.S. 10-Year real yield dropped. But, with optimism starting to falter, it’s likely only a matter of time before the next bout of panic erupts.
Overview of the Upcoming Part of the Decline
- It seems to me that the corrective upswing is over (or about to be over) and that the next big move lower is already underway (or that it’s about to start).
- If we see a situation where miners slide in a meaningful and volatile way while silver doesn’t (it just declines moderately), I plan to – once again – switch from short positions in miners to short positions in silver. At this time, it’s too early to say at what price levels this could take place and if we get this kind of opportunity at all – perhaps with gold prices close to $1,500 - $1,550.
- I plan to switch from the short positions in junior mining stocks or silver (whichever I’ll have at that moment) to long positions in junior mining stocks when gold / mining stocks move to their 2020 lows (approximately). While I’m probably not going to write about it at this stage yet, this is when some investors might consider getting back in with their long-term investing capital (or perhaps 1/3 or 1/2 thereof).
- I plan to return to short positions in junior mining stocks after a rebound – and the rebound could take gold from about $1,450 to about $1,550, and it could take the GDXJ from about $20 to about $24. In other words, I’m currently planning to go long when GDXJ is close to $20 (which might take place when gold is close to $1,450), and I’m planning to exit this long position and re-enter the short position once we see a corrective rally to $24 in the GDXJ (which might take place when gold is close to $1,550).
- I plan to exit all remaining short positions once gold shows substantial strength relative to the USD Index while the latter is still rallying. This may be the case with gold prices close to $1,400 and GDXJ close to $15 . This moment (when gold performs very strongly against the rallying USD and miners are strong relative to gold after its substantial decline) is likely to be the best entry point for long-term investments, in my view. This can also happen with gold close to $1,400, but at the moment it’s too early to say with certainty.
- The above is based on the information available today, and it might change in the following days/weeks.
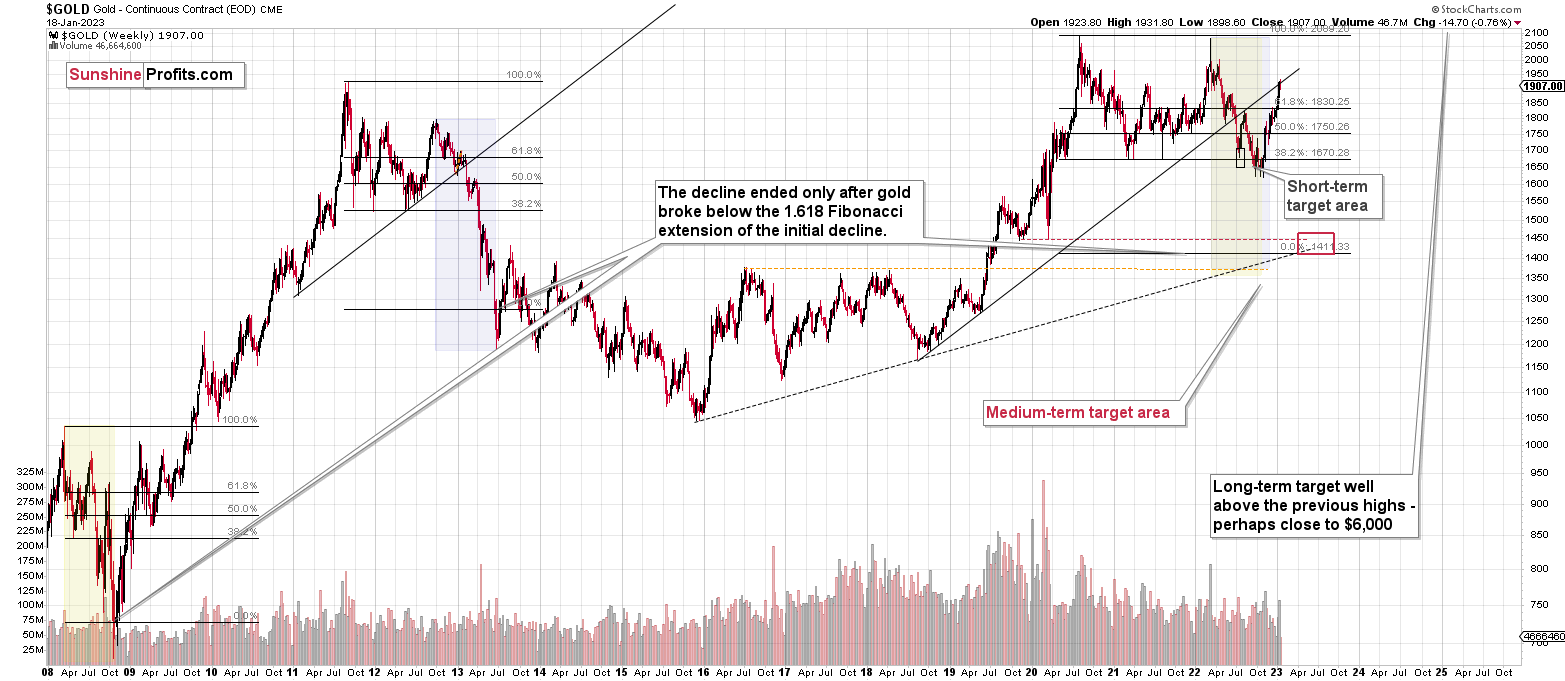
You will find my general overview of the outlook for gold on the chart below:
Please note that the above timing details are relatively broad and “for general overview only” – so that you know more or less what I think and how volatile I think the moves are likely to be – on an approximate basis. These time targets are not binding nor clear enough for me to think that they should be used for purchasing options, warrants, or similar instruments.
Letters to the Editor
We received a few messages over e-mail, but as we are moving to our new platform, we will be transferring them below the articles as comments – and that’s where we’ll be replying to them.
Asking your questions below the articles or in the spaces called “Ask the Community” or “Position Sizes” directly will help us deliver a reply sooner. In some cases, someone from the community might reply and help even before we do.
Please remember about the Pillars of our Community, especially about the Kindness of Speech Pillar.
Also, if there’s anything that you’re unhappy with, it’s best to send us a message at [email protected].
Please note that this section is going to go away within the next 1-8 weeks, as you can add comments/questions below the article on Golden Meadow – the platform that we’re using to provide our analyses. Your notification e-mails include an invitation link that allows you to access the “Gold Trading Alerts” space.
Also, if you haven’t had the chance to see the video, in which I’m talking about the new platform and why we essentially moved from Sunshine Profits to Golden Meadow, I strongly encourage you to do so:
Summary
Summing up, it seems that the major bottom in the USD Index is in (or at hand), while the correction in stocks, gold, silver, and mining stocks is over – or very close to being over.
Gold and junior miners corrected less than 61.8% of their 2022 decline, while silver corrected over 61.8% of the decline. Silver’s move above the 61.8% Fibonacci retracement was already invalidated, suggesting that the next big move lower is starting or about to start.
Now, as more investors realize that interest rates will have to rise sooner than expected, the prices of precious metals and mining stocks (as well as other stocks) are likely to fall. In my opinion, the current trading position is going to become profitable in the following weeks, and quite possibly in the following days. And while I can’t promise any kind of performance, I fully expect it to become very profitable before it’s over and to prolong our 2022 winning streak.
After the final sell-off (that takes gold to about $1,350-$1,500), I expect the precious metals to rally significantly. The final part of the decline might take as little as 1-5 weeks, so it's important to stay alert to any changes.
As always, we'll keep you – our subscribers – informed.
To summarize:
Trading capital (supplementary part of the portfolio; our opinion): Full speculative short positions (300% of the full position) in junior mining stocks are justified from the risk to reward point of view with the following binding exit profit-take price levels:
Mining stocks (price levels for the GDXJ ETF): binding profit-take exit price: $20.32; stop-loss: none (the volatility is too big to justify a stop-loss order in case of this particular trade)
Alternatively, if one seeks leverage, we’re providing the binding profit-take levels for the JDST (2x leveraged). The binding profit-take level for the JDST: $22.87; stop-loss for the JDST: none (the volatility is too big to justify a SL order in case of this particular trade).
For-your-information targets (our opinion; we continue to think that mining stocks are the preferred way of taking advantage of the upcoming price move, but if for whatever reason one wants / has to use silver or gold for this trade, we are providing the details anyway.):
Silver futures downside profit-take exit price: $14.32
SLV profit-take exit price: $13.42
ZSL profit-take exit price: $48.87
Gold futures downside profit-take exit price: $1,504
HGD.TO – alternative (Canadian) 2x inverse leveraged gold stocks ETF – the upside profit-take exit price: $16.47
HZD.TO – alternative (Canadian) 2x inverse leveraged silver ETF – the upside profit-take exit price: $36.87
Long-term capital (core part of the portfolio; our opinion): No positions (in other words: cash)
Insurance capital (core part of the portfolio; our opinion): Full position
Whether you’ve already subscribed or not, we encourage you to find out how to make the most of our alerts and read our replies to the most common alert-and-gold-trading-related-questions.
Please note that we describe the situation for the day that the alert is posted in the trading section. In other words, if we are writing about a speculative position, it means that it is up-to-date on the day it was posted. We are also featuring the initial target prices to decide whether keeping a position on a given day is in tune with your approach (some moves are too small for medium-term traders, and some might appear too big for day-traders).
Additionally, you might want to read why our stop-loss orders are usually relatively far from the current price.
Please note that a full position doesn't mean using all of the capital for a given trade. You will find details on our thoughts on gold portfolio structuring in the Key Insights section on our website.
As a reminder - "initial target price" means exactly that - an "initial" one. It's not a price level at which we suggest closing positions. If this becomes the case (as it did in the previous trade), we will refer to these levels as levels of exit orders (exactly as we've done previously). Stop-loss levels, however, are naturally not "initial", but something that, in our opinion, might be entered as an order.
Since it is impossible to synchronize target prices and stop-loss levels for all the ETFs and ETNs with the main markets that we provide these levels for (gold, silver and mining stocks - the GDX ETF), the stop-loss levels and target prices for other ETNs and ETF (among other: UGL, GLL, AGQ, ZSL, NUGT, DUST, JNUG, JDST) are provided as supplementary, and not as "final". This means that if a stop-loss or a target level is reached for any of the "additional instruments" (GLL for instance), but not for the "main instrument" (gold in this case), we will view positions in both gold and GLL as still open and the stop-loss for GLL would have to be moved lower. On the other hand, if gold moves to a stop-loss level but GLL doesn't, then we will view both positions (in gold and GLL) as closed. In other words, since it's not possible to be 100% certain that each related instrument moves to a given level when the underlying instrument does, we can't provide levels that would be binding. The levels that we do provide are our best estimate of the levels that will correspond to the levels in the underlying assets, but it will be the underlying assets that one will need to focus on regarding the signs pointing to closing a given position or keeping it open. We might adjust the levels in the "additional instruments" without adjusting the levels in the "main instruments", which will simply mean that we have improved our estimation of these levels, not that we changed our outlook on the markets. We are already working on a tool that would update these levels daily for the most popular ETFs, ETNs and individual mining stocks.
Our preferred ways to invest in and to trade gold along with the reasoning can be found in the how to buy gold section. Furthermore, our preferred ETFs and ETNs can be found in our Gold & Silver ETF Ranking.
As a reminder, Gold & Silver Trading Alerts are posted before or on each trading day (we usually post them before the opening bell, but we don't promise doing that each day). If there's anything urgent, we will send you an additional small alert before posting the main one.
Thank you.
Przemyslaw K. Radomski, CFA
Founder, Editor-in-chief


