Briefly: in our opinion, full (300% of the regular position size) speculative short positions in junior mining stocks are justified from the risk/reward point of view at the moment of publishing this Alert.
You already know the key thing about the current market situation, as I explained it yesterday – we saw key weekly (!) reversals across the precious metals market as well as in one of the key gold price’s drivers – the USD Index.
In today’s analysis, I will dig deeper into the latter, as understanding what’s happening to the USD Index provides critical context for moves that we see in the precious metals market. In fact, that’s one of the best ways to check if a given price move “has legs” or if it’s just price noise without much meaning.
Also, as a reminder, the other of the two key drivers for the price of gold are changes in real interest rates, and I discussed that in greater detail on Thursday.
As you may recall from my yesterday’s analysis, the USD Index formed a bullish weekly “hammer” reversal candlestick. As I wrote, it was likely to be followed by a sizable rally, and that’s exactly what we saw. The USDX soared by another 0.74 yesterday, which means that it has rallied by 1.58 so far this month. That’s less than it had declined in January, which means that 2023 is now an “up year” for the USD Index.
This is exciting on its own, but wait until you see the context!
Well, you didn’t have to wait for long, as here it is:
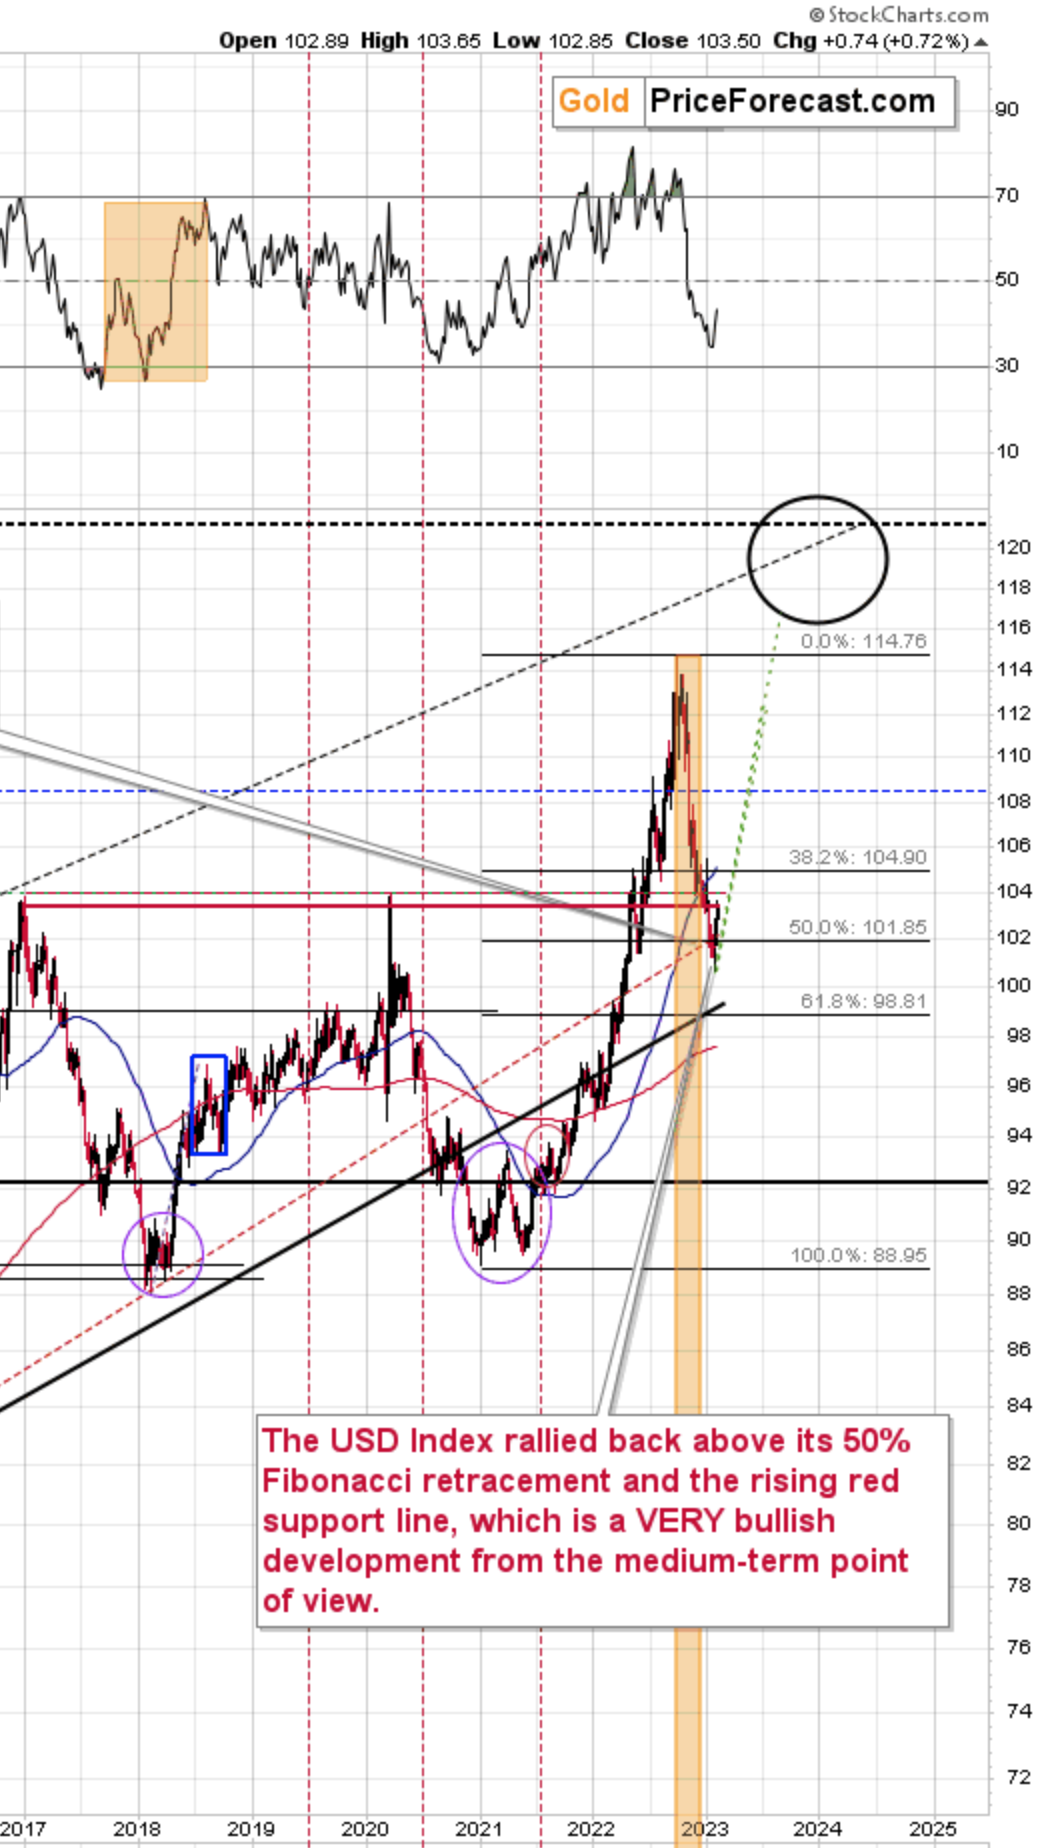
The early 2023 decline was a move below one of the key Fibonacci retracement levels – the 50% level. At first glance, this appeared to be a bearish development. However, fortunately, that’s not the only sight that we give. The move was small enough and accompanied by specific narratives that made us doubt whether the breakdown below this level would be confirmed.
And it wasn’t! We saw invalidation instead, and it happened in the most bullish way imaginable – in the form of a (powerful) weekly reversal.
Before I tell you about another super-bullish thing that just happened in the USD Index, I’d like to explain why the Fibonacci retracement levels are important at all – as a courtesy to those who are new to trading. Or maybe you simply used those levels but always wondered what’s up with them, and why they work so often.
To make a long story short, the Fibonacci sequence, ratio, and thus retracements are things that appear in nature in many places. People are a component of nature. People create markets. So, why wouldn’t it be the case that some things that people do, i.e., in the markets, work according to the Fibonacci rules?
For example, one price move is like the other (previous but related) price move but multiplied by 1.618? Or multiplied by it twice? 1.618 x 1.618 = ~2.618. Or inversed? 1 / 1.618 = ~0.618.
In the case of price movements, we must identify the key points of any price movement—its beginning and end.. And we can apply the above-mentioned multiplications to both: start and end of the move. When we apply the retracement from the opposite side, we get 1 - 0.618 = 0.382. Half of a given move doesn’t result from the Fibonacci sequence itself, but multiplication by two and division by it are also common in nature.
That’s pretty much it. The “retracement levels” that you see on the above chart (marked with black) represent those above-mentioned levels based on the most recent important rally, and they are shown in percentage terms (so, 61.8% instead of 0.618).
All right, having said that, let’s check what’s so bullish about what happened yesterday and why so many investors missed it.
- Hint #1: The horizontal, thick, red line represents what just happened.
- Hint #2: Investors (and, sadly, many analysts) often focus only on what happened this week, last month, or maybe in the past year or so, and they miss the very valuable analogies and links to a more distant past, incorrectly assuming that “it doesn’t matter.” It does matter, as the psychological mechanisms that caused investors to panic or get greedy at certain price levels remain unchanged.
The critical thing that happened is that the USD Index moved back above its 2016 high! The breakdown below was just invalidated!
Yesterday’s closing price was 103.5, and at the moment of writing these words, the USD Index is trading at 103.66.
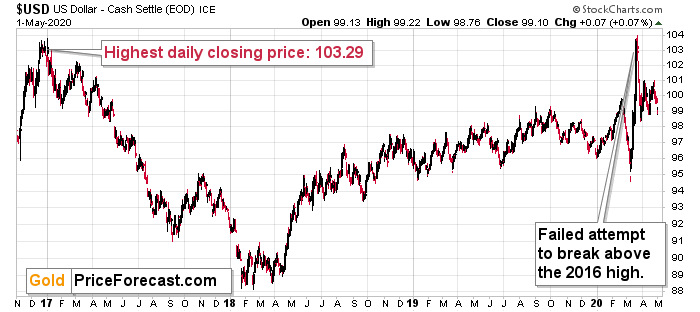
Now, let’s see where the USD Index traded back in 2016 and in 2020.
The highest daily close of 2016 was 103.29. This means that yesterday’s closing price was higher, and thus the breakdown was invalidated. Or, one might say, that the support provided by this high actually held, despite the small (from the long-term point of view) move below it.
Either way, the implications are profoundly bullish.
Not only did the USD Index just form a weekly reversal and move back above its 50% Fibonacci retracement, but it even moved back above its 2016 high! This is a very bullish combination of indications.
Since the precious metals sector tends to move in the opposite direction from what’s happening in the USD Index, this is a very bearish combination for gold, silver, and mining stocks.
- Wait a minute, what about the 2020 high?
This high – in terms of the daily closing prices – was exactly 103.5, which means that it was just matched. However, this high is not nearly as important as the 2016 one, because the 2020 rally and subsequent top were the USD Index’s attempts to break above the 2016 high. This attempt failed, so the 2020 high is not as important as the 2016 high.
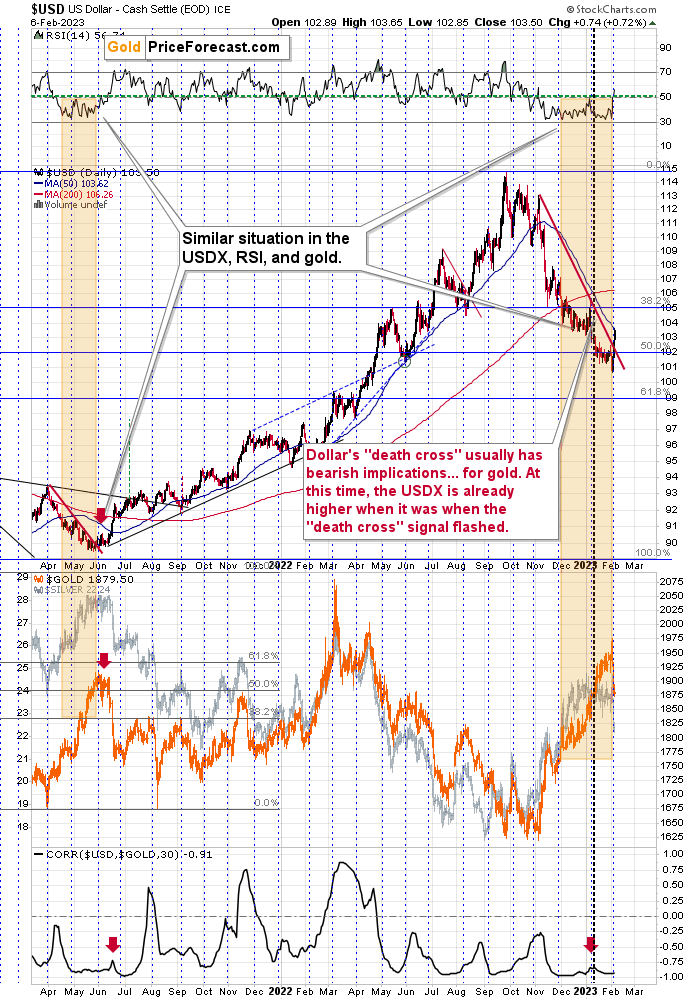
Also, do you remember about the supposedly bearish “death cross” in the USD Index that so many investors (and analysts!) got worried about? And the one that I talked about in my Jan. 11 video, where I explained why it doesn’t work as a bearish signal for the USD Index and that it’s actually a bearish signal for gold?
Well, the USD Index is already above the price levels at which it was trading when the “death cross” signal flashed, likely leaving many inexperienced investors scratching their heads. - “Wasn’t a death cross supposed to bring, you know, death, destruction, or at least declines?”
No. It doesn’t matter how fancy a name a given trading tool or technique has. Before applying it, one should always check if it works in a given market. If it doesn’t, then don’t use it – simple as that. The reliability of the “death cross” signal was next to none for the USDX, and indeed, it moved just a little lower and then it moved back up.
Based on multiple indications that I commented on in today’s analysis, the USD Index rally is likely to continue, continuing to baffle those who bought the “death cross” narrative at face value without checking if it really works.
What actually happened in most cases after we saw the USDX’s “death cross” was that the gold price then declined profoundly, either shortly or soon enough. And, well, that’s exactly what we saw recently.
To summarize, in my view, the real interest rates are up and about to soar higher, the USD Index most likely bottomed and is likely to soar, while the precious metals topped in a spectacular manner and are now likely to slide – either shortly or soon enough. The rally in gold, silver, and miners was indeed sizable, but… It’s over.
What’s next? Something exciting (and, in my view, lucrative) or something scary – depending on how positioned and informed one chooses to be.
Also, please note that (paraphrasing Sun Tzu) “understanding the enemy without understanding your true self is only half of a victory.” Before applying any insights into actionable practice (and placing or adding to your trades), please make sure that the position that you’re about to enter and its size are aligned with your approach, your investment goals, and your risk tolerance.
In other words, I suggest starting with yourself, and tailoring the trade to you, not the other way around. This will save you lots of stress, which is not only end in and of itself (your happiness and health are both closely linked to your stress levels), but it also helps you become a more profitable investor as less stress (or none thereof) means more objectivity and less risk of “running for the hills” right before a given trade becomes profitable (perhaps extremely so).
Having said that, let’s take a look at the markets from a more fundamental point of view.
Gold Hangs On, but for How Long?
With hawkish nonfarm payrolls helping to stifle gold, silver and mining stocks’ momentum, the interest rate narrative has shifted to higher for longer. Moreover, with the PMs highly allergic to higher Treasury yields, their medium-term outlooks remain ominous.
For example, rate-hike expectations continued to accelerate on Feb. 6, and the development is bad news for the precious metals.
Please see below:
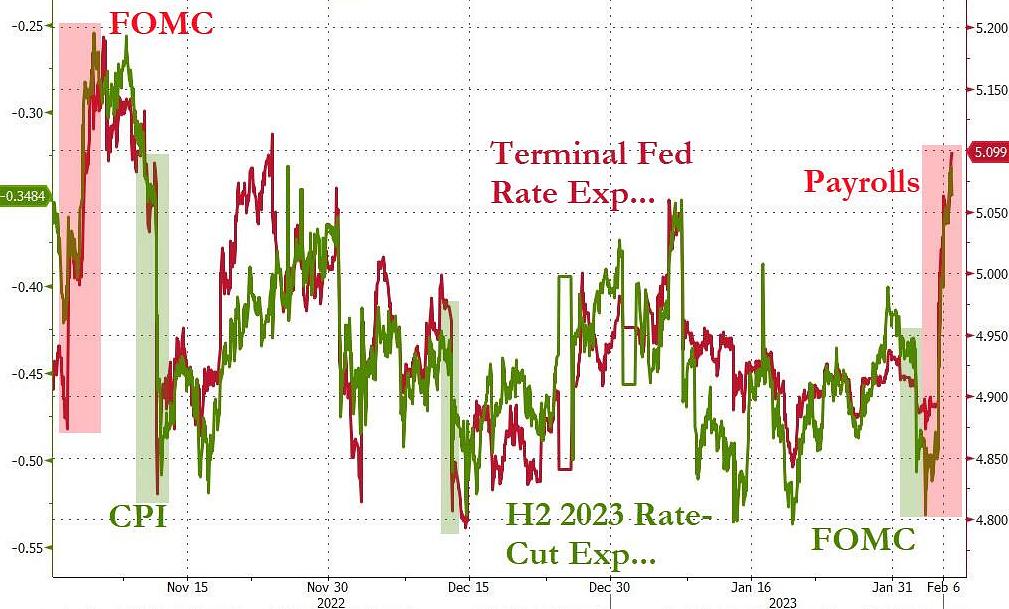 To explain, the red line above tracks the peak U.S. federal funds rate (FFR) implied by the futures market, while the green line above tracks the inverted (down means up) rate cuts expected thereafter. If you analyze the right side of the chart, you can see that rate-hike expectations are back near their November highs, while rate-cut expectations are back near their November lows. As a result, the hawkish shift aligns with our expectations.
To that point, the payrolls outperformance also sent ripples across the Treasury market.
Please see below:
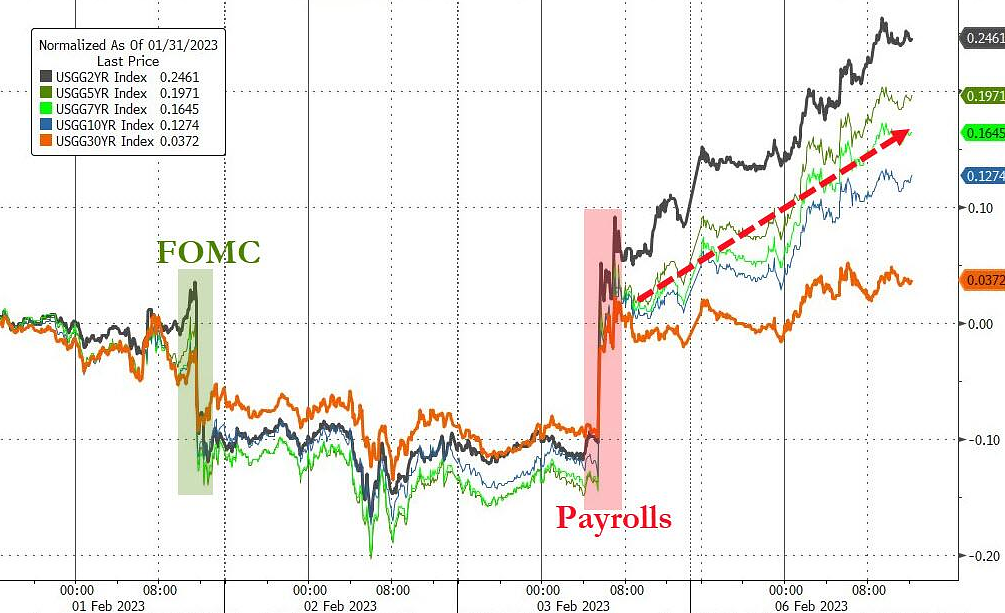 To explain, the colored lines above track U.S. Treasury yields ranging from the 2-Year to the 30-Year. If you analyze the movement post-payrolls, you can see that the bond bulls have been running for cover. Thus, while we warned that a resilient U.S. labor market would keep the pressure on the Fed, the pivot narrative has come under immense pressure in recent days.
Speaking of which, Atlanta Fed President Raphael Bostic said on Feb. 6:
“Job one for us has got to be to get inflation back under control; and I’m going to do all I can to see that we do that….
“Those last few tenths of a point can take a long time to be realized; and so I want to make sure that we are in the right place before we start easing off our policy because the most important thing at this stage is to get our price stability measure as close to target as possible.”
Please see below:
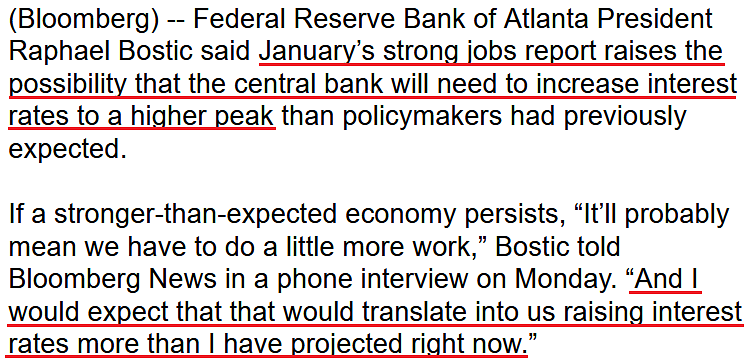 So, while we warned that the Goldilocks narrative – which implies rate cuts, low inflation and high corporate earnings – lacked fundamental credibility, investors’ belief has eroded. Therefore, the consensus is coming around to our expectations, and we outlined on Jan. 10 why the medium-term outlook remains highly treacherous. We wrote:
- Inflation is still highly problematic, and the consensus underestimates the difficulty of returning the metric to 2%.
- The FFR has eclipsed the peak year-over-year (YoY) core Consumer Price Index (CPI) in every inflation fight since 1961; and since the YoY core CPI peaked (for now) at 6.66% in September 2022, the historically-implied peak FFR is at least 6.67% , and the crowd is ignoring the historical lessons of where the FFR needs to go to eliminate inflation.
- Nine of the last 10 bouts of rising inflation ended with recessions, and recessions are bearish for gold. During the dot-com collapse, the GFC, and the COVID-19 crisis, gold declined substantially when panic ensued. As such, U.S. Treasury bonds and the U.S. dollar are the primary safe havens during liquidations, not gold.
- While everyone assumes that the FOMC is wrong about higher-for-longer interest rates, we believe the fundamentals support its outlook.
Furthermore, with wage inflation still problematic, the Fed must maintain its hawkish stance to win this battle.
Please see below:
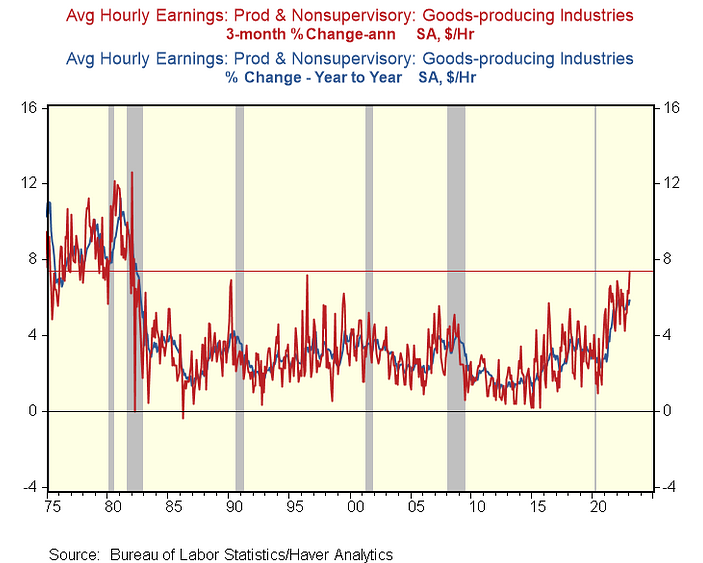 To explain, the blue line above tracks the YoY percentage change in average hourly earnings (AHE) for non-supervisory employees in the mining, construction and manufacturing industries, while the red line above tracks the three-month annualized percentage change.
If you analyze the right side of the chart, you can see that the red line hit 7.4% on Feb. 3, its highest level since the early 1980s. As a result, the crowd remains woefully misguided in its belief that inflation will normalize without higher interest rates.
Remember, the Wall Street narrative proclaimed that peak inflation meant the worst was over. Conversely, we believe that peak inflation is irrelevant because while stopping the YoY rise is easy, normalizing the metric to 2% is extremely difficult. Consequently, the implications of sticky inflation should enhance volatility in the months ahead.
In addition, while hawkish re-pricings have occurred recently, there should be more room to run.
Please see below:
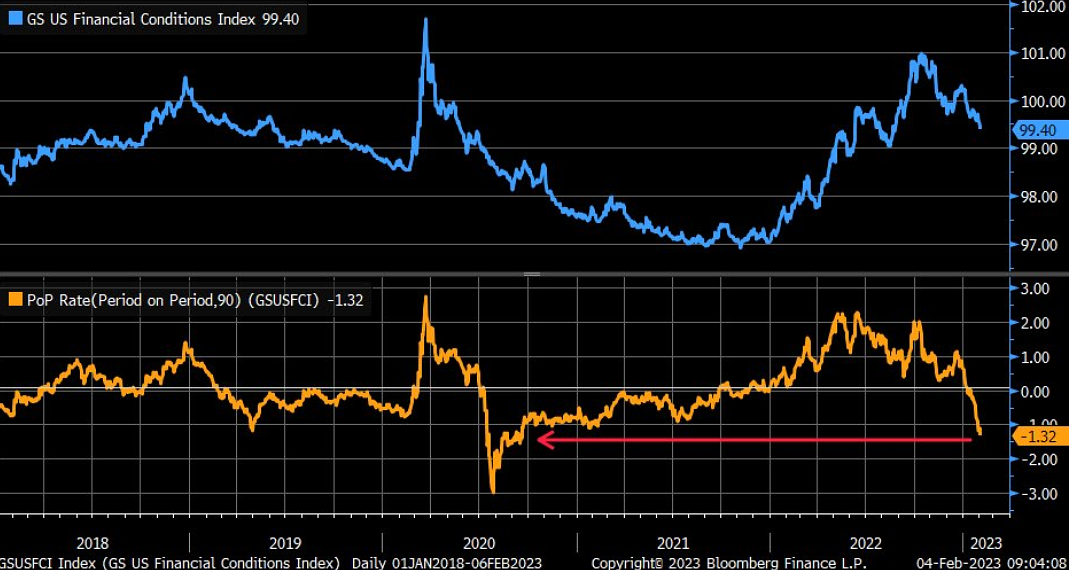 To explain, the blue line above tracks the Goldman Sachs Financial Conditions Index (FCI), while the orange line above tracks its 90-day rate of change. If you analyze the magnitude of the latter’s fall, you can see that sharp periods of easing have been mean-reverting since 2018, which implies a material reversal over the medium term.
As such, higher interest rates, lower stock prices, wider credit spreads and a stronger USD Index could spoil the bulls’ party, and a realization is profoundly bearish for the PMs.
Overall, while the narrative has shifted, asset prices remain decoupled from their fundamental values. With higher interest rates required to suppress demand, the Fed needs risk assets to suffer lengthy declines for inflation to abate. In the absence, the recent merry-go-round will repeat.
In September and October, recession fears helped sink asset prices and reduce inflation. Then, optimism returned and higher asset prices have the Cleveland Fed projecting a 0.63% month-over-month (MoM) CPI increase in January, which annualizes to 7.83%. So, inflation rises with each bout of optimism, and that’s why a sharp slide in risk assets is needed to normalize the metric for good.
Has the crowd finally heeded the Fed’s warning, or will dovish re-pricing occur in the weeks ahead? How prevalent is wage inflation? Where does the FCI go from here? Please share your thoughts.
Silver Flirts With Its December Low
While we warned that silver was headed for a breakdown below its 50-day moving average, the negativity continued on Feb. 6, as the S&P 500 ended the day in the red. Likewise, with the white metal hitting its 2022 lows alongside the U.S. equity benchmark in September and October, more stock market pain could push silver below its 200-day MA.
For example, while Morgan Stanley’s Chief Investment Strategist Mike Wilson confronted plenty of criticism throughout 2021 and 2022, he remained focused on the bearish fundamentals rather than following the narratives; and with the latest example present in January, he told clients on Feb. 6 that “the door is still very much open” for a meaningful drawdown. He wrote:
“What makes this analysis more powerful is that, historically, the majority of the
price downside in equities comes after forward [earnings per share] EPS growth goes negative. In other words, this earnings recession is not priced, in our view,”
Please see below:
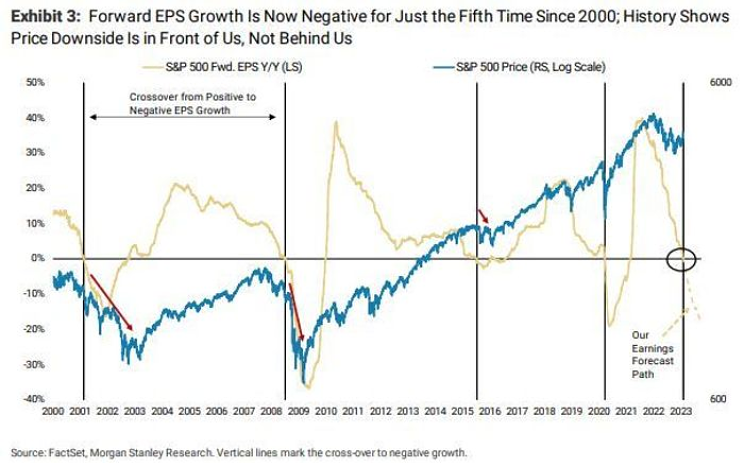 To explain, the blue line above tracks the S&P 500, while the brown line above tracks the index’s forward EPS growth implied by Morgan Stanley’s model. If you analyze the vertical black bars, you can see that when the model-implied EPS growth turned negative, the S&P 500 suffered major drawdowns in 2001, 2008 and 2020 and a mild drawdown in 2015. Although, the latter occurred with only a small decline in the brown line.
In contrast, the brown dotted line on the right side of the chart annotated with “Our Earnings Forecast Path” projects a malaise that rivals 2001 and 2020. Therefore, a realization should result in an S&P 500 drawdown that rivals those periods, not 2015.
Thus, while the S&P 500 has confronted some selling pressure, the drawdown has been mild relative to the EPS deceleration that could occur in the months ahead. In the process, silver could suffer a similar fate.
Also highlighting the positioning imbalance, the spread between the average BBB corporate bond yield and the 90-day U.S. Treasury Bill yield highlights investors’ disdain for risk management.
Please see below:
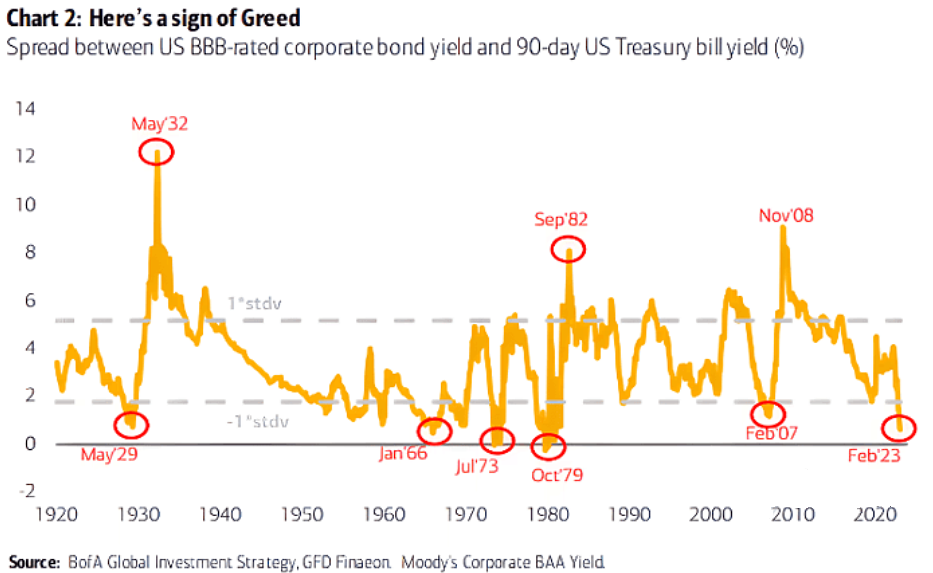 To explain, the orange line above subtracts the 90-day U.S. Treasury Bill yield from the average BBB corporate bond yield. When the orange line declines, it means that short-term Treasury yields are rising at a faster pace than corporate bond yields; and if you analyze the right side of the chart, you can see that the spread is near zero, and is more than one standard deviation below its long-term average.
In other words, the crowd is buying BBB corporate bonds at a nearly identical yield as Treasury Bills despite the heightened default risk.
More importantly, prior iterations of near-zero-to-negative spreads have resulted in sharp reversions that rattled the financial markets. Remember, the spread can only rise if the Fed cuts the FFR or if corporate bonds sell off and their yields rise; and with the latter more likely than the former in our view, mean reversion should inflict plenty of pain over the medium term.
As another ominous indicator, the equity risk premium (ERP) has not budged, and a sharp spike should occur before this bear market ends.
Please see below:
 To explain, the blue line above essentially tracks investors’ willingness to take risk. When the ERP rises, it means that investors demand a higher return to own the S&P 500, which also influences demand for assets like silver and mining stocks.
If you analyze the vertical pink bars, you can see that the last three recessions resulted in ERP spikes of 400 to 700 basis points; and with higher discount rates often leading to lower stock prices, the events are highly bearish.
Furthermore, with the reading on the right side of the chart lower than the post-GFC lows, the crowd views high inflation and a hawkish Fed as immaterial risks. In contrast, we view them as substantial headwinds, and the demand destruction that should occur as the Fed tames inflation should shift sentiment in the months ahead.
Finally, Steve Eisman – who is famous for shorting the housing market in 2008 – told Bloomberg on Feb. 6 that a regime change is occurring. He said:
“Paradigms change over time. Sometimes those paradigms change violently, and sometimes those paradigms change over time because people don’t give up their paradigms easily; and I think we’re going through a period possibly like that again.”
From “2010 through the beginning of 2022, if you were a company that had no earnings but strong revenue growth, people dreamed the dream. When the revenue growth slows, people stopped dreaming the dream, or a combination of that with higher rates and the discounting mechanism takes down the stock.”
So, while we have long warned that the post-GFC playbook is no longer applicable, the crowd continues to hold out hope for a return to pre-pandemic monetary policy. Yet, with resilient inflation and higher interest rates poised to end that “dream,” a wake-up call could hit silver as the drama unfolds.
Do you agree with Wilson’s assessment? When could we see a sharp rise in the ERP and/or the BBB-T-Bill yield spread? How important is the stock market’s performance when analyzing silver?
The Bottom Line
The mood has shifted on Wall Street, as concerns over a hawkish Fed have resurfaced. However, Fed Chairman Jerome Powell is scheduled to speak today, so his words could create some volatility.
Either way, the technicals and the fundamentals have not deviated from our expectations, and the next phase should culminate with a sharp recession and a material rise in the USD Index, real yields, the FCI, the ERP and credit spreads. As a result, a realization is profoundly bearish for gold, silver and mining stocks.
In conclusion, the PMs were mixed on Feb. 6, as gold ended the day in the green. But, like silver, the GDXJ ETF has also broken below its 50-day MA, and it’s likely only a matter of time before gold and the GDX ETF follow suit. Consequently, we still view their risk-reward propositions as heavily skewed to the downside.
Overview of the Upcoming Part of the Decline
- It seems to me that the corrective upswing is over (or about to be over) and that the next big move lower is already underway (or that it’s about to start).
- If we see a situation where miners slide in a meaningful and volatile way while silver doesn’t (it just declines moderately), I plan to – once again – switch from short positions in miners to short positions in silver. At this time, it’s too early to say at what price levels this could take place and if we get this kind of opportunity at all – perhaps with gold prices close to $1,500 - $1,550.
- I plan to switch from the short positions in junior mining stocks or silver (whichever I’ll have at that moment) to long positions in junior mining stocks when gold / mining stocks move to their 2020 lows (approximately). While I’m probably not going to write about it at this stage yet, this is when some investors might consider getting back in with their long-term investing capital (or perhaps 1/3 or 1/2 thereof).
- I plan to return to short positions in junior mining stocks after a rebound – and the rebound could take gold from about $1,450 to about $1,550, and it could take the GDXJ from about $20 to about $24. In other words, I’m currently planning to go long when GDXJ is close to $20 (which might take place when gold is close to $1,450), and I’m planning to exit this long position and re-enter the short position once we see a corrective rally to $24 in the GDXJ (which might take place when gold is close to $1,550).
- I plan to exit all remaining short positions once gold shows substantial strength relative to the USD Index while the latter is still rallying. This may be the case with gold prices close to $1,400 and GDXJ close to $15 . This moment (when gold performs very strongly against the rallying USD and miners are strong relative to gold after its substantial decline) is likely to be the best entry point for long-term investments, in my view. This can also happen with gold close to $1,400, but at the moment it’s too early to say with certainty.
- The above is based on the information available today, and it might change in the following days/weeks.
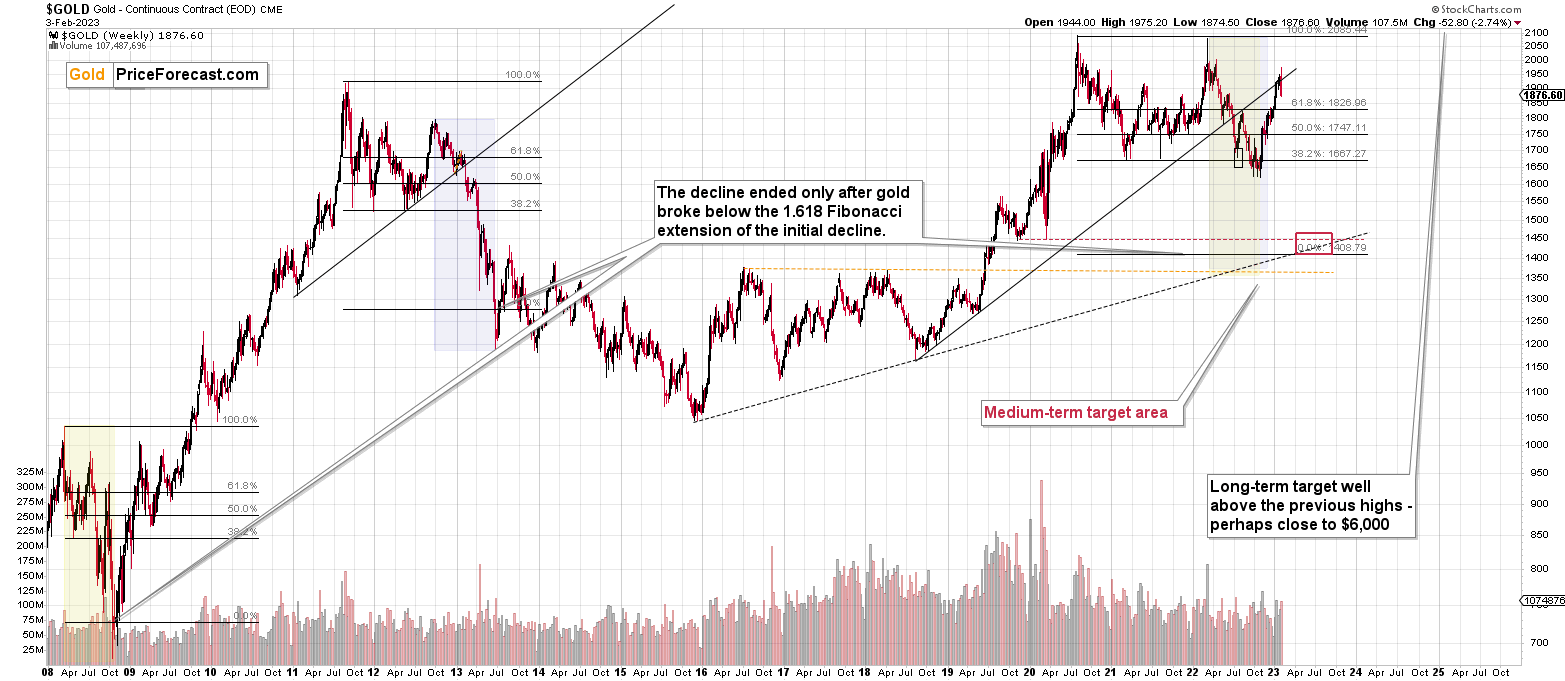
You will find my general overview of the outlook for gold on the chart below:
Please note that the above timing details are relatively broad and “for general overview only” – so that you know more or less what I think and how volatile I think the moves are likely to be – on an approximate basis. These time targets are not binding nor clear enough for me to think that they should be used for purchasing options, warrants, or similar instruments.
Letters to the Editor
We received a few messages over e-mail, but as we are moving to our new platform, we will be transferring them below the articles as comments – and that’s where we’ll be replying to them.
Asking your questions below the articles or in the spaces called “Ask the Community” or “Position Sizes” directly will help us deliver a reply sooner. In some cases, someone from the community might reply and help even before we do.
Please remember about the Pillars of our Community, especially about the Kindness of Speech Pillar.
Also, if there’s anything that you’re unhappy with, it’s best to send us a message at [email protected].
Please note that this section is going to go away within the next 1-8 weeks, as you can add comments/questions below the article on Golden Meadow – the platform that we’re using to provide our analyses. Your notification e-mails include an invitation link that allows you to access the “Gold Trading Alerts” space.
Also, if you haven’t had the chance to see the video, in which I’m talking about the new platform and why we essentially moved from Sunshine Profits to Golden Meadow, I strongly encourage you to do so:
Summary
Summing up, it seems that the major bottom in the USD Index is in (or at hand), while the correction in stocks, gold, silver, and mining stocks is over – or very close to being over.
Gold and silver correct about 61.8% of their 2022 decline, while junior miners corrected a bit more than 50% of the decline, but not more than 61.8% thereof. This is exactly how the big 2021 and 2022 declines in junior miners started.
Given the above, gold’s very long-term resistance (the 2011 high!) and the situation in the USD Index, it seems that the next big move lower in the precious metals sector is about to start.
Now, as more investors realize that interest rates will have to rise sooner than expected, the prices of precious metals and mining stocks (as well as other stocks) are likely to fall. In my opinion, the current trading position is going to become profitable in the following weeks, and quite possibly in the following days. And while I can’t promise any kind of performance, I fully expect it to become very profitable before it’s over and to prolong our 2022 winning streak.
After the final sell-off (that takes gold to about $1,350-$1,500), I expect the precious metals to rally significantly. The final part of the decline might take as little as 1-5 weeks, so it's important to stay alert to any changes.
As always, we'll keep you – our subscribers – informed.
To summarize:
Trading capital (supplementary part of the portfolio; our opinion): Full speculative short positions (300% of the full position) in junior mining stocks are justified from the risk to reward point of view with the following binding exit profit-take price levels:
Mining stocks (price levels for the GDXJ ETF): binding profit-take exit price: $20.32; stop-loss: none (the volatility is too big to justify a stop-loss order in case of this particular trade)
Alternatively, if one seeks leverage, we’re providing the binding profit-take levels for the JDST (2x leveraged). The binding profit-take level for the JDST: $22.87; stop-loss for the JDST: none (the volatility is too big to justify a SL order in case of this particular trade).
For-your-information targets (our opinion; we continue to think that mining stocks are the preferred way of taking advantage of the upcoming price move, but if for whatever reason one wants / has to use silver or gold for this trade, we are providing the details anyway.):
Silver futures downside profit-take exit price: $14.32
SLV profit-take exit price: $13.42
ZSL profit-take exit price: $48.87
Gold futures downside profit-take exit price: $1,504
HGD.TO – alternative (Canadian) 2x inverse leveraged gold stocks ETF – the upside profit-take exit price: $16.47
HZD.TO – alternative (Canadian) 2x inverse leveraged silver ETF – the upside profit-take exit price: $36.87
Long-term capital (core part of the portfolio; our opinion): No positions (in other words: cash)
Insurance capital (core part of the portfolio; our opinion): Full position
Whether you’ve already subscribed or not, we encourage you to find out how to make the most of our alerts and read our replies to the most common alert-and-gold-trading-related-questions.
Please note that we describe the situation for the day that the alert is posted in the trading section. In other words, if we are writing about a speculative position, it means that it is up-to-date on the day it was posted. We are also featuring the initial target prices to decide whether keeping a position on a given day is in tune with your approach (some moves are too small for medium-term traders, and some might appear too big for day-traders).
Additionally, you might want to read why our stop-loss orders are usually relatively far from the current price.
Please note that a full position doesn't mean using all of the capital for a given trade. You will find details on our thoughts on gold portfolio structuring in the Key Insights section on our website.
As a reminder - "initial target price" means exactly that - an "initial" one. It's not a price level at which we suggest closing positions. If this becomes the case (as it did in the previous trade), we will refer to these levels as levels of exit orders (exactly as we've done previously). Stop-loss levels, however, are naturally not "initial", but something that, in our opinion, might be entered as an order.
Since it is impossible to synchronize target prices and stop-loss levels for all the ETFs and ETNs with the main markets that we provide these levels for (gold, silver and mining stocks - the GDX ETF), the stop-loss levels and target prices for other ETNs and ETF (among other: UGL, GLL, AGQ, ZSL, NUGT, DUST, JNUG, JDST) are provided as supplementary, and not as "final". This means that if a stop-loss or a target level is reached for any of the "additional instruments" (GLL for instance), but not for the "main instrument" (gold in this case), we will view positions in both gold and GLL as still open and the stop-loss for GLL would have to be moved lower. On the other hand, if gold moves to a stop-loss level but GLL doesn't, then we will view both positions (in gold and GLL) as closed. In other words, since it's not possible to be 100% certain that each related instrument moves to a given level when the underlying instrument does, we can't provide levels that would be binding. The levels that we do provide are our best estimate of the levels that will correspond to the levels in the underlying assets, but it will be the underlying assets that one will need to focus on regarding the signs pointing to closing a given position or keeping it open. We might adjust the levels in the "additional instruments" without adjusting the levels in the "main instruments", which will simply mean that we have improved our estimation of these levels, not that we changed our outlook on the markets. We are already working on a tool that would update these levels daily for the most popular ETFs, ETNs and individual mining stocks.
Our preferred ways to invest in and to trade gold along with the reasoning can be found in the how to buy gold section. Furthermore, our preferred ETFs and ETNs can be found in our Gold & Silver ETF Ranking.
As a reminder, Gold & Silver Trading Alerts are posted before or on each trading day (we usually post them before the opening bell, but we don't promise doing that each day). If there's anything urgent, we will send you an additional small alert before posting the main one.
Thank you.
Przemyslaw K. Radomski, CFA
Founder, Editor-in-chief


