

Briefly: in our opinion, full (300% of the regular position size) speculative short positions in junior mining stocks are justified from the risk/reward point of view at the moment of publishing this Alert.
The precious metals sector didn’t do much on Friday, but something very important happened in gold’s key driver – the USD Index.
Let’s get right to it.
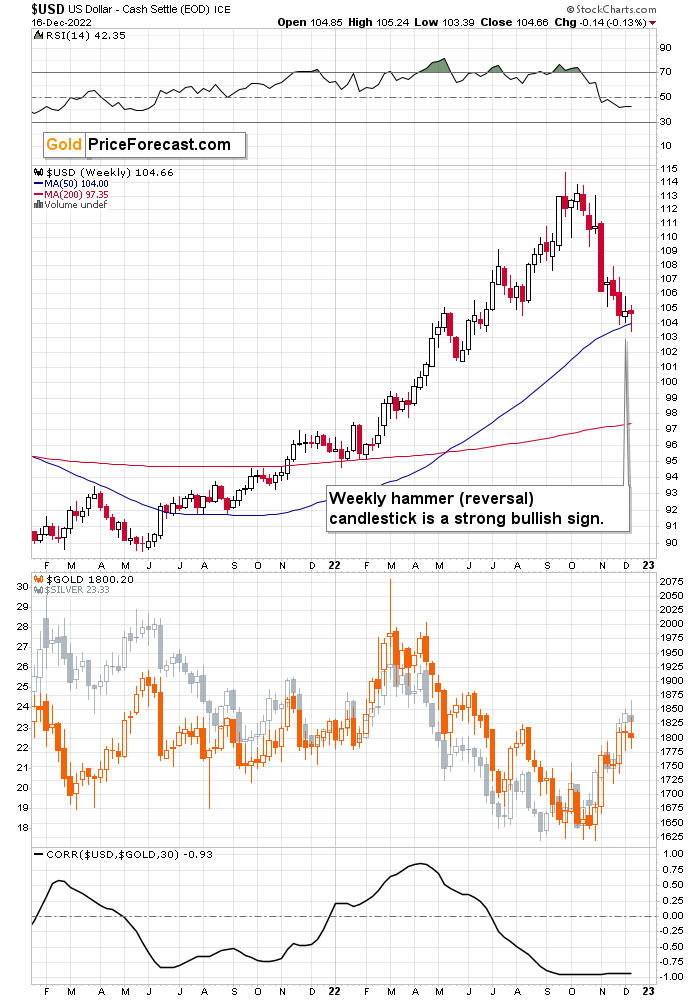
There was very little change in terms of weekly prices as the USD Index declined by just 0.14.
However, the way the USD Index first declined and then moved back up makes all the difference!
The USDX at first declined, moving on one or more rumors regarding the Fed and what it’s going to do next (and probably on some other rumors as well), and then once it became clear that the pace of rate hikes has indeed decreased, Powell announced that there will be no U-turn in the near and medium-term future, and investors got a wake-up call.
Instead of pushing gold higher and the USD Index lower, they seem to have started to realize what’s really going on, and they reversed course.
The USD Index moved back up, while gold moved back down.
Ultimately, the U.S. currency ended the week practically unchanged, but it formed a bullish hammer candlestick. It’s a reversal candlestick, and let’s keep in mind that weekly candlesticks are much more powerful than the ones based on just daily price changes.
The above happened after a sizable short-term decline, so it’s very likely that it confirmed the change in the short-term trend – which, in all likelihood, is now up.
Since the correlation between the USD Index and the precious metals sector is very negative (below -0.9, while -1 is the most negative that the “linear correlation coefficient” can get), it means that as the USD Index moves back up, the precious metals sector is likely to move down. And these are not likely to be small moves, either.
In other words, i.e. based on the USD Index’s hammer reversal candlestick, one can expect gold to move much lower in the following weeks.
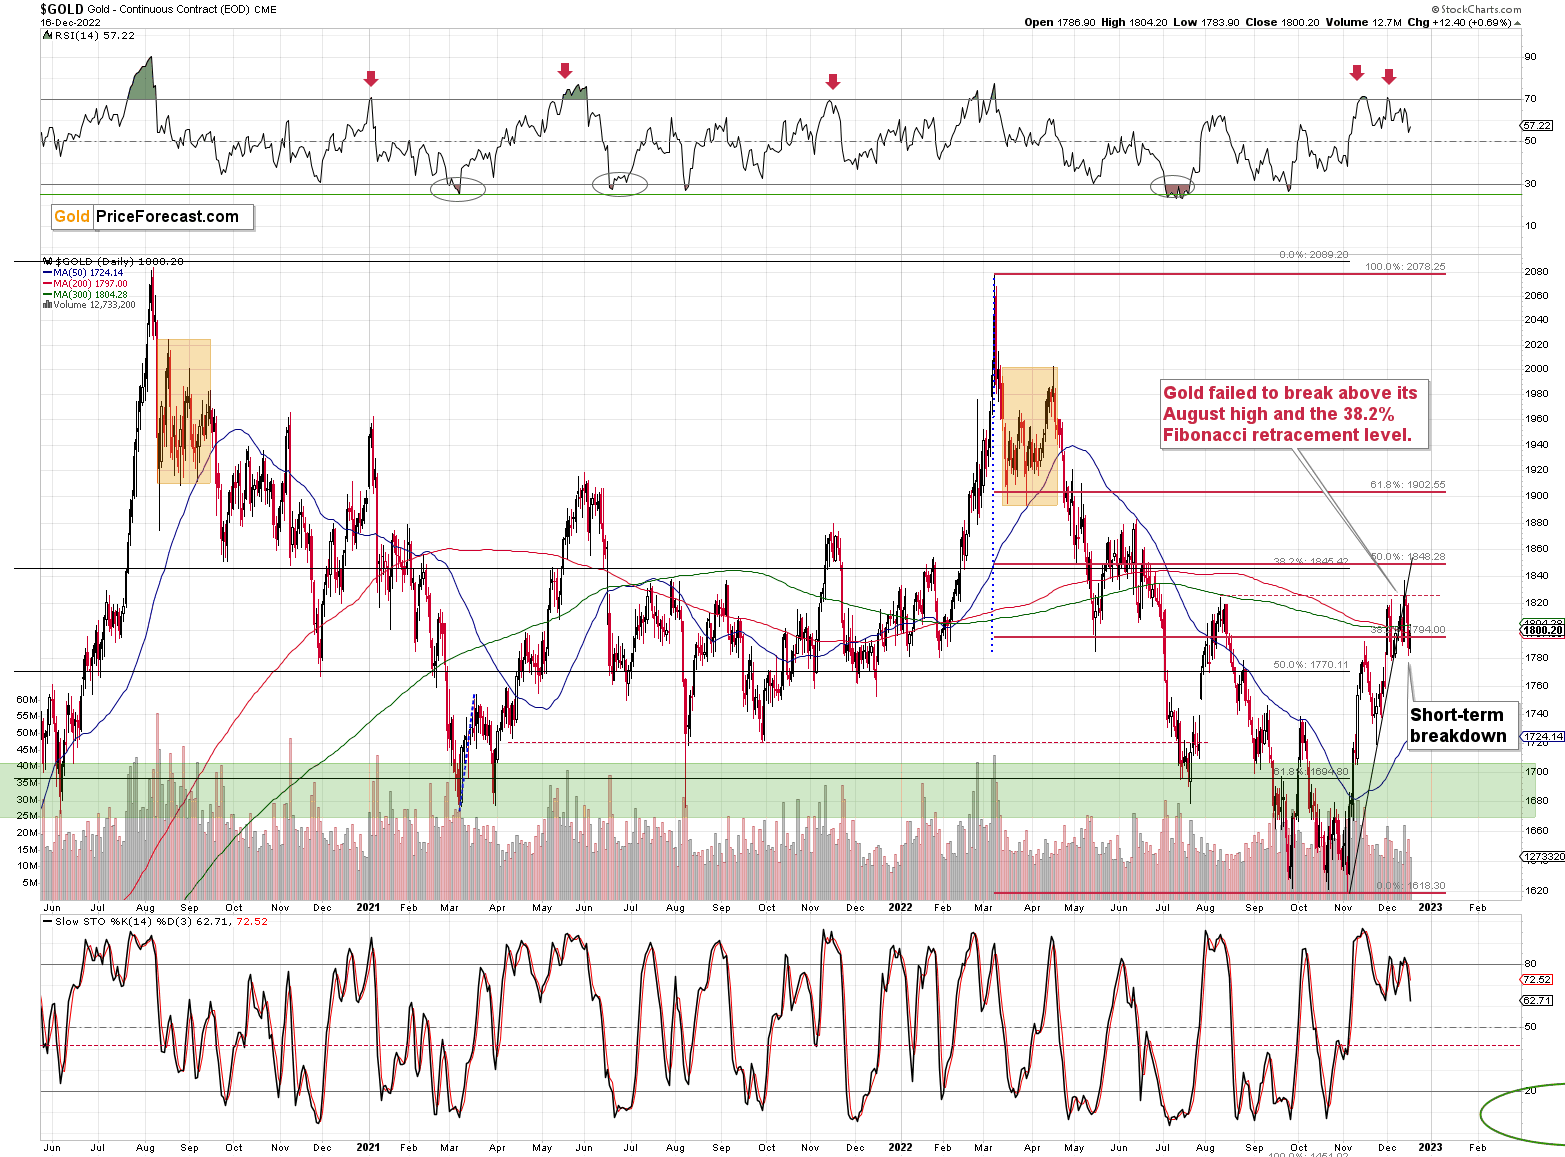
Gold ended Friday’s session higher, but it didn’t change the fact that it broke below its rising support line, and it all happened after the sell signal from the RSI.
Consequently, the intraday rally (and today’s pre-market move higher) is likely just a verification of the breakdown.
The thing that confirms the above theory is the low volume on which gold rallied on Friday. The buying power appears to have been limited or dried up. That’s bearish – very bearish – regardless of the few dollars that gold might rally within the next few hours.
So far today (chart courtesy of https://www.goldpriceforecast.com), gold tried to move back to the $1,800 level, but it hasn’t managed to do so.
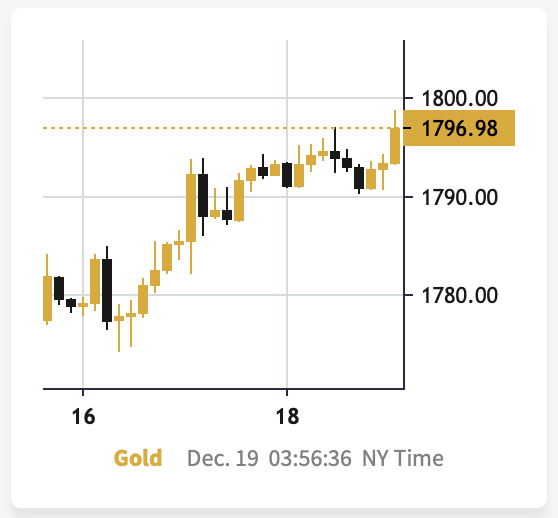
The point is that even if gold does indeed move above $1,800 today, it won’t change much, as gold already confirmed its breakdown below its rising support line, and all other points from today’s analysis remain up-to-date as well.
The situation on the stock market is bearish, too.
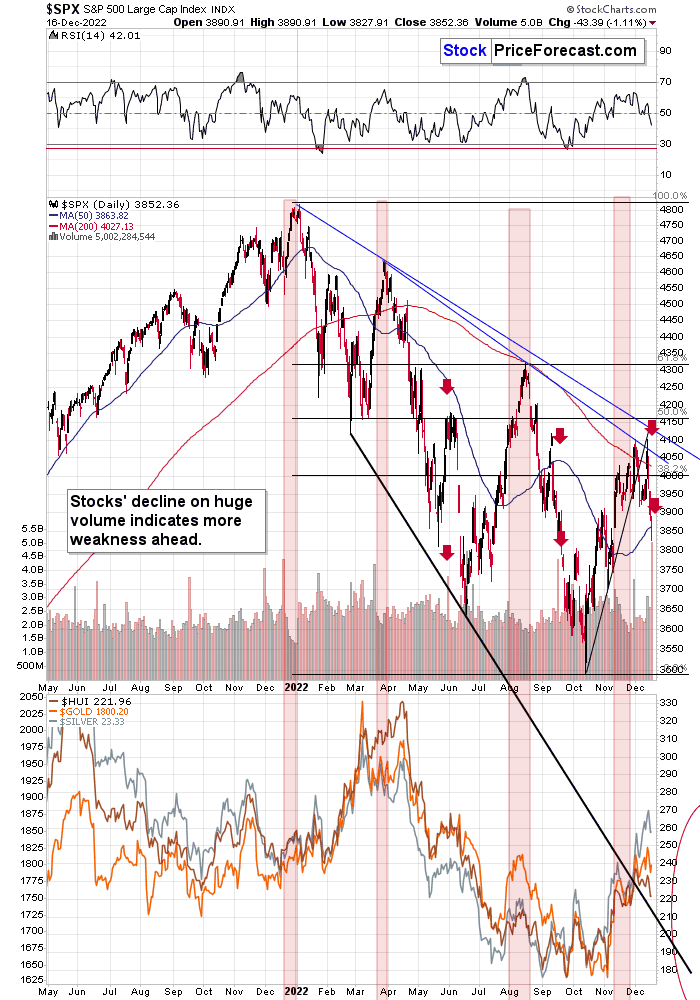
The volume by which stocks declined on Friday was huge. It confirmed the strength of the bears – the selling force was enormous.
There were two similar situations in recent history. Stocks declined on huge volume at the end of May and in mid-September. In both cases, lower stock market values followed. And since history tends to rhyme, it’s likely that we’re going to see declining stock market prices this time as well.
Just like gold, stocks confirmed their breakdown below their rising support line. They also declined shortly after invalidating the attempt to break above the lowermost of the declining blue resistance lines.
Interestingly, stocks plunged after the above-mentioned rising support line crossed the declining blue resistance line. That’s no coincidence – prices tend to reverse at the vertices of triangles created by support/resistance lines. The term "responsibility" refers to the act of determining whether or not a person is responsible for his or her own actions.
As the stock market declines, commodities (i.e., silver), and mining stocks are likely to decline as well.
Speaking of the latter, let’s take a look at the proxy for junior mining stocks – the GDXJ ETF.
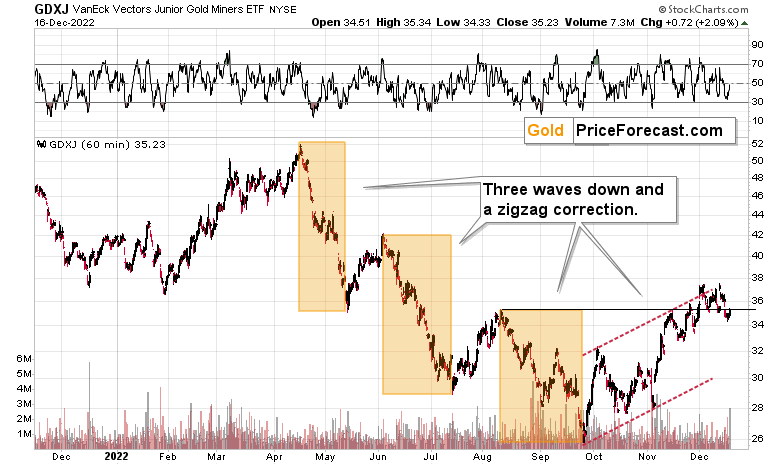
As you can see on the above chart, junior miners just broke back below their August and November highs, and they are now testing this move.
This test is likely to succeed, and miners are likely to decline much more.
Why? Because that’s what they “told us” beforehand. Well, they would have told us if mining stocks could speak – but since they can’t, they communicated in a different way. Miners "told us" that they are likely to fall by rising less than gold and falling more than gold.
Since at the same time silver moved profoundly higher relative to gold, we knew that the precious metals market really wants to move lower. After all, miners tend to lead gold, while silver lags behind, and plays catch-up. The above-mentioned relative performance of miners and silver relative to gold indicates that lower values of the precious metals sector are to be expected.
Since that move is not likely to be minor, it presents a great profit opportunity for those, who are positioned correctly.
Having said that, let’s take a look at the market from a more fundamental point of view.
How Long Can Gold Walk the Bearish Tightrope?
After hawkish realities helped upend the S&P 500 and crude oil on Dec. 16, sentiment has shifted dramatically across the financial markets. But, with gold, silver and mining stocks rallying, they’re behaving as if all is well on Wall Street. Yet, while they assume that a calmer USD Index and weaker U.S. Treasury yields are bullish, their misguided optimism should end in disappointment.
To explain, we wrote on Apr. 20:
The next leg higher for the U.S. 10-Year real yield may occur for the opposite reasons. For example, we noted above that we don’t need nominal yields to rise for real yields to rise.
Moreover, while the U.S. 10-Year Treasury yield was undervalued in 2021 and was poised to move higher, the U.S. 10-Year breakeven inflation rate is overvalued in 2022 and is poised to move lower.
Please see below:
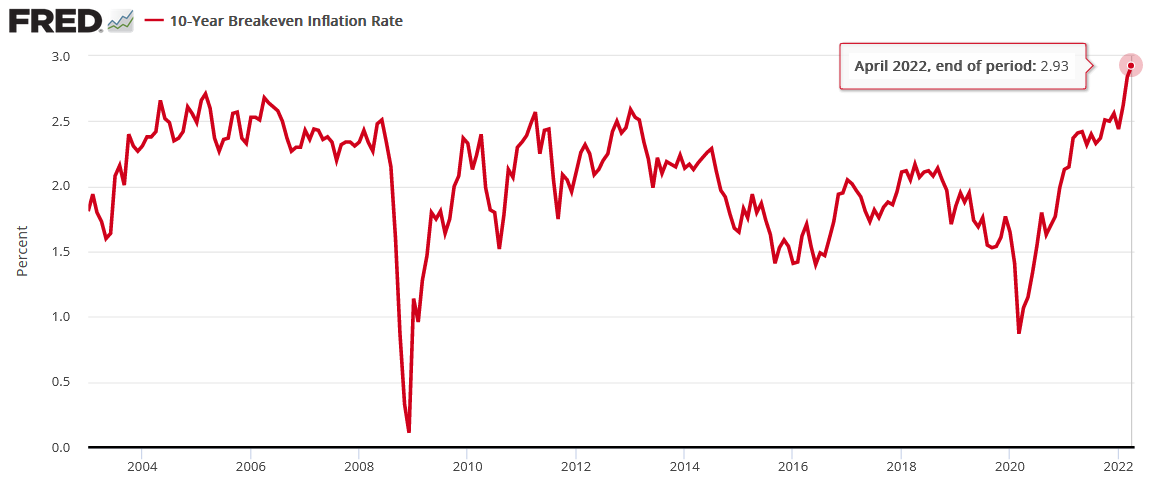
The U.S. 10-Year breakeven inflation rate ended the Apr. 19 session at 2.93%, only slightly below the all-time high of 2.95% set in March. However, like the PMs, investors’ long-term inflation expectations remain in la-la land.
With the Fed on a hawkish crusade to stifle demand and reduce inflation, the central bank can achieve this goal. The only question is how much economic pain officials are willing to tolerate to get the job done.
To that point, with the U.S. 10-Year breakeven inflation rate sinking to a new 2022 low of 2.13% on Dec. 16, the fundamentals continue to unfold as expected.
Please see below:
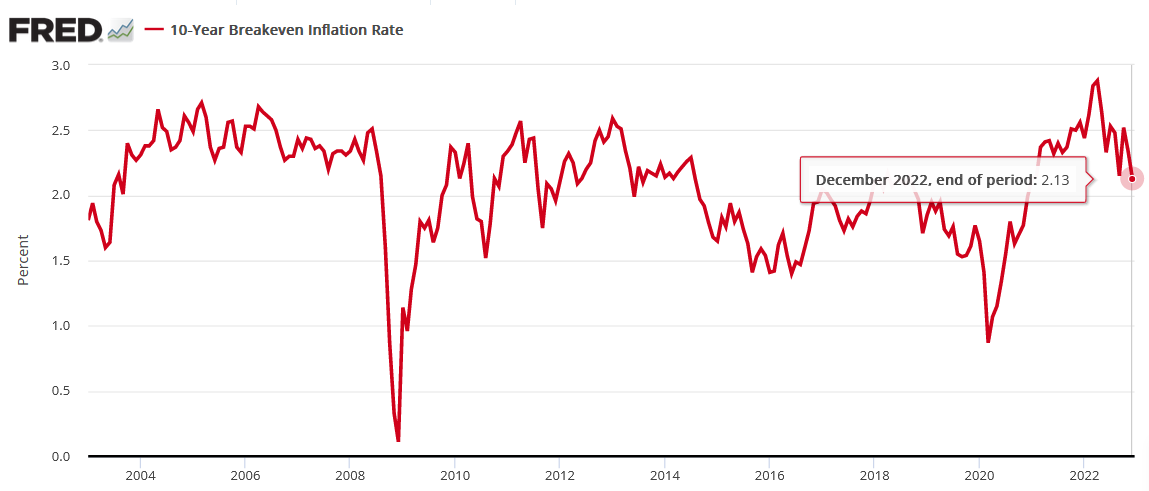
So, while the PMs see a consolidating USD Index and lower nominal interest rates and assume the fundamental backdrop has improved, the reality is that the U.S. 10-Year real yield has risen materially in December.
Previously, the metric declined from its 2022 peak of 1.74% on Nov. 3 to a low of 1.08% on Dec. 2. Coincidently, the PMs rallied during this period as the USD Index also came under pressure. In contrast, the metric ended the Dec. 16 session at 1.35%, which marks a 27 basis point increase in two weeks.
Also, while the PMs behave as if the U.S. 10-Year real yield is still declining, the S&P 500 has noticed, as it’s down by 5.4% from its Dec. 2 close; and while momentum investors believe the PMs are a safe place to hide, prior periods of ignoring the fundamentals culminated with substantial drawdowns. As a result, it’s likely only a matter of time before the next iteration unfolds.
Furthermore, while the crowd has been buying dips all year amid misguided hopes for a dovish pivot, CNBC’s Jim Cramer – a staunch permabull – finally acknowledged reality on Dec. 15:
Please see below:
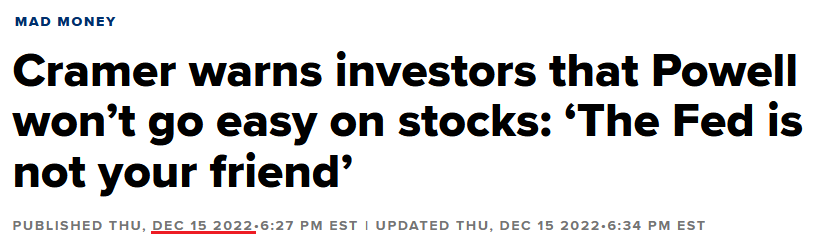 Source: CNBC
But, we warned in the spring that the Fed’s inflation fight would rattle risk assets and halt a medium-term uprising. We wrote on Apr. 6:
Please remember that the Fed needs to slow the U.S. economy to calm inflation, and rising asset prices are mutually exclusive to this goal. Therefore, officials should keep hammering the financial markets until investors finally get the message.
Moreover, with the Fed in inflation-fighting mode and reformed doves warning that the U.S. economy “could teeter” as the drama unfolds, the reality is that there is no easy solution to the Fed’s problem. To calm inflation, it has to kill demand. As that occurs, investors should suffer a severe crisis of confidence.
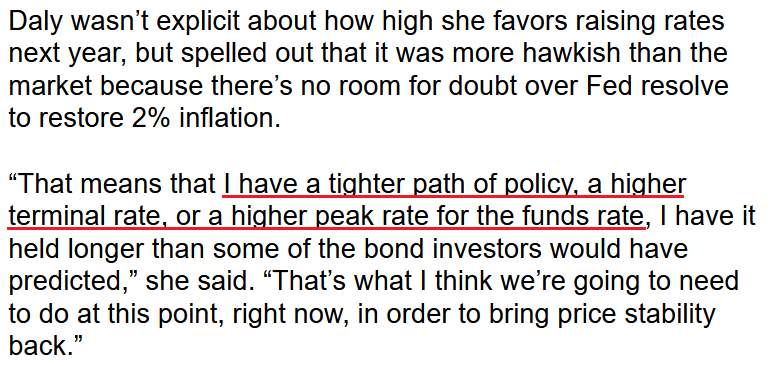
In addition, with more Fed officials sounding the hawkish alarm, the gold price should suffer from these developments in the months ahead. For example, San Francisco Fed President Mary Daly said on Dec. 16:
“I don’t quite know why markets are so optimistic about inflation. We don’t have the luxury of pricing for perfection because we have a price stability mandate, and so we have to imagine what the risks to inflation are, and to me they still are on the upside.”
As such, Daly noted that her peak U.S. federal funds rate (FFR) projection is higher than the ~5% expected by the futures market.
Please see below:
 Source: Bloomberg
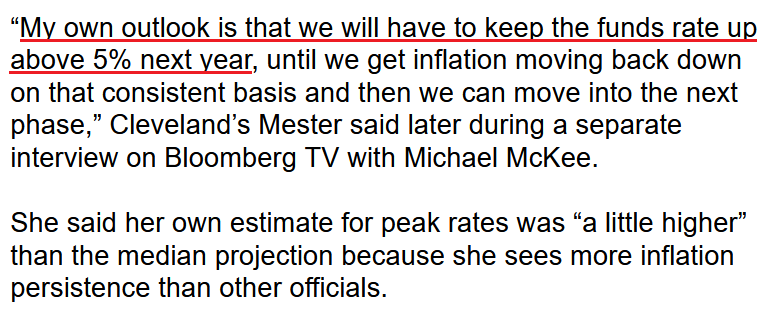
Likewise, Cleveland Fed President Loretta Mester said on Dec. 16:
“The level of inflation is still way too high” and “we need to continue to bring up interest rates into a restrictive stance. We did a lot of work this year,” but the FFR will need to remain restrictive for “quite a while in order to get inflation on a sustainable downward path.”
Thus, she also expects the FFR to peak north of 5%.
Please see below:
 Source: Bloomberg
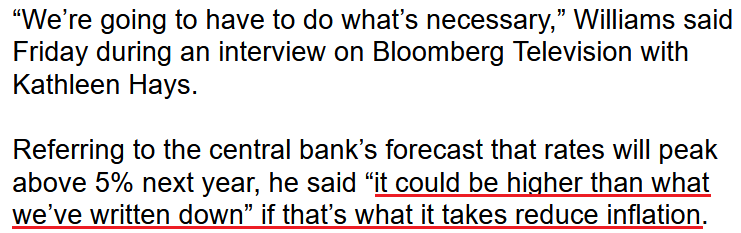
Making three of a kind, New York Fed President John Williams said on Dec. 16:
“To me, the question of how high we have to get to is really going to depend on what we see in inflation and the supply-and-demand imbalance…. Where inflation is still high is in these core-services areas that are probably going to be more persistent and really reflect the imbalance between supply and demand. We definitely need to see it coming down to get to that 2% inflation goal.”
So, while Williams falls on the dovish end of the spectrum, he also admitted that the peak FFR could surpass 5% in 2023.
Please see below:
 Source: Bloomberg
On top of that, while the reality check has rattled the consensus, we have been consistent in our view that the FFR should march higher and the liquidity drain should upend several risk assets, including gold. We wrote on Dec. 1:
The narrative pushing the gold price higher is built on a faulty foundation; and despite the notion that the Fed is near a pivot, the reality is that the FOMC’s peak FFR projection keeps increasing.
As such, while sentiment is powerful in the short term, the medium-term fundamentals remain highly alarming. With growth, inflation, employment and consumer spending still extremely resilient, the consensus underestimates this inflation fight. Consequently, our 2023 FFR estimate of 4.5% to 5.5% should prove too low when it’s all said and done.
Overall, the fundamentals continue to unfold as expected. Throughout 2022, investors incorrectly attempted to call the peak FFR and the death of inflation. However, the fundamentals influence the Fed, not the other way around; and with the fundamentals still bullish for the FFR, it’s no surprise that Fed officials keep increasing their projections.
Therefore, while the gold price ignored the ramifications on Dec. 16, the liquidity drain should catch up to the PMs in the months ahead.
Silver Holds on Despite the Intraday Volatility
With silver dumping and pumping intraday on Dec. 16, the white metal ended the session up by 0.10%. Moreover, with the S&P 500 coming under pressure, silver’s outperformance was relatively uncommon. But, with the USD Index and the U.S. 10-Year Treasury yield largely consolidating, the PMs view the fundamental backdrop as constructive.
Furthermore, with the Cboe Volatility Index (VIX) – which measures the S&P 500’s expected volatility over the next 30 days – falling on Dec. 16, the lack of fear keeps liquidations in check for now.
Please see below:
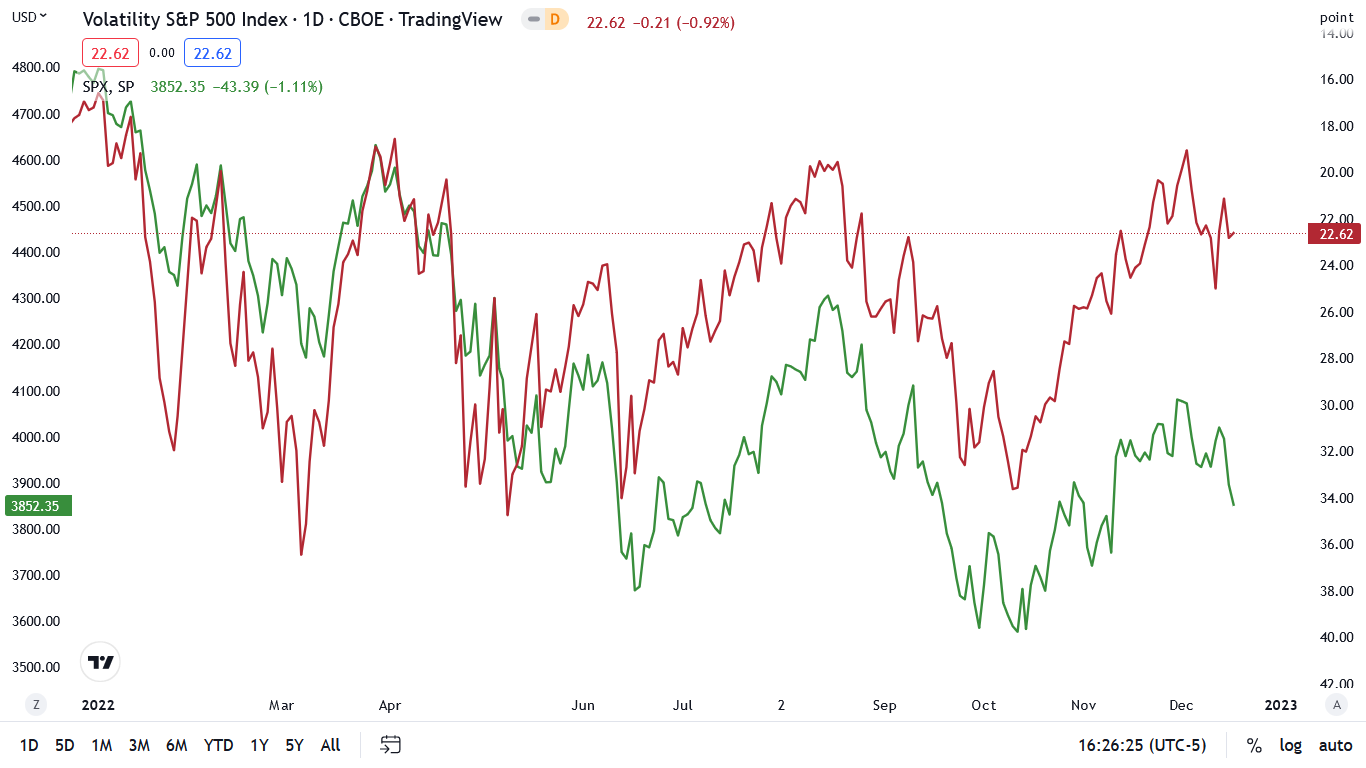
To explain, the green line above tracks the S&P 500, while the red line above tracks the inverted (down means up) VIX. If you analyze the relationship, you can see that spikes in volatility often occur when the S&P 500 falls.
When the S&P 500 was near 3,850 in June and September/October, the VIX was north of 30. In contrast, the metric declined on Dec. 16, and stands near 23. As a result, investors don’t fear a higher FFR, an earnings malaise or a potential recession, and the complacency highlights their misguided faith in the Fed.
As further evidence, data from Bank of America emphasizes the mentality that developed due to the Fed’s plethora of pivots following the global financial crisis (GFC).
Please see below:
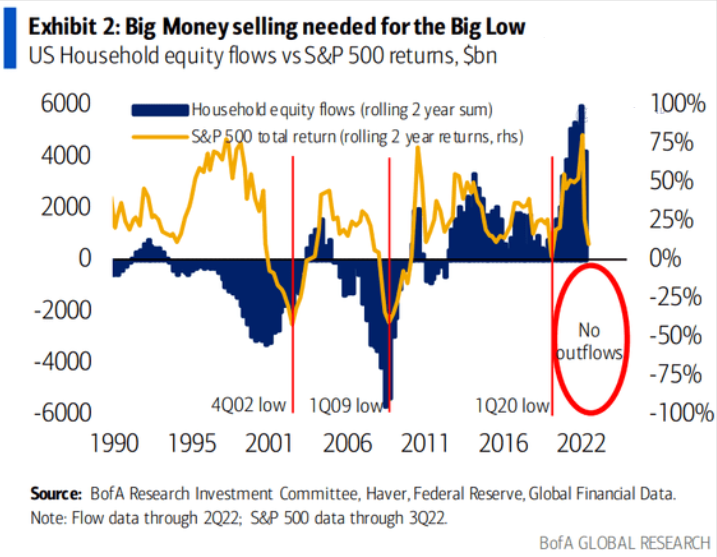
To explain, the gold line above tracks the S&P 500’s rolling two-year total return, while the blue bars above track U.S. households’ rolling two-year fund flows. If you analyze the relationship, you can see that the S&P 500’s bottoms during the dot-com bubble and the GFC occurred after U.S. households capitulated.
Conversely, the blue bars on the right side of the chart show how Americans have not pulled money out of the stock market on a two-year rolling basis, even as money poured into equities during 2020 and 2021 (see the height of the blue bars).
Thus, not only are U.S. households holding their positions with little anxiety, but the imbalances built up before this recessionary bear market were at an all-time high. Yet, since the crowd assumes another post-GFC pivot will send stocks soaring, they’ve been trained to wait for the Fed to save the day. However, unanchored inflation is a different animal, and the Fed can’t solve this problem by printing money.
Speaking of which, the global liquidity drain has gone into overdrive, and higher interest rates should have drastic implications in the months ahead.
Please see below:
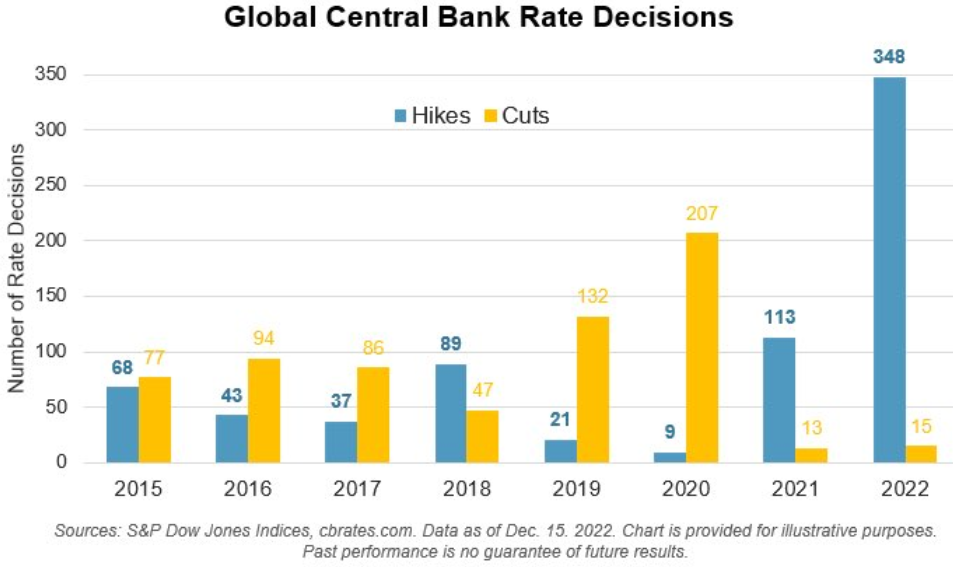
To explain, the blue and yellow bars above represent the number of global central bank interest rate hikes and cuts. If you analyze the right side of the chart, you can see that 2022 has culminated with 348 increases and 15 decreases, with this year's hikes exceeding the previous six years combined. Consequently, the economic impact is underappreciated and profoundly bearish for corporate profits.
Likewise, while market participants remain invested in underperforming assets like the S&P 500 and silver, their poor risk-reward analysis should elicit regret over the medium term.
Please see below:
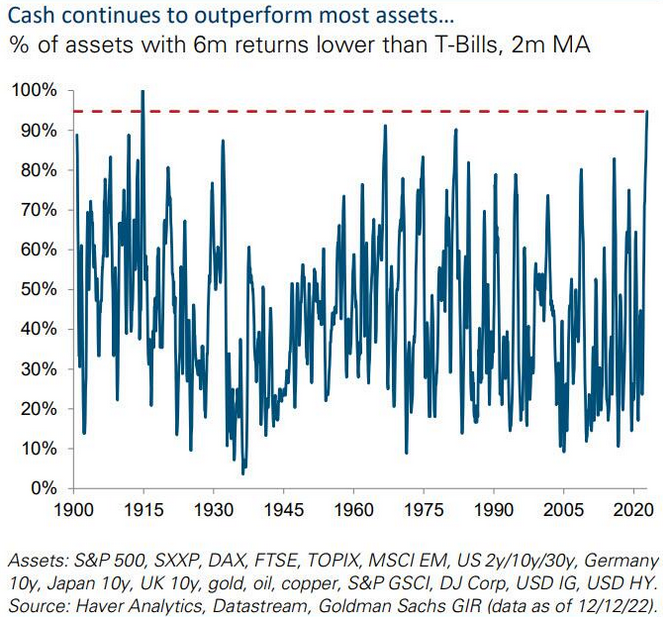
To explain, the blue line above tracks the percentage of assets with a lower six-month return than two-month Treasury Bills. If you analyze the right side of the chart, you can see that roughly 95% of assets are underperforming cash. So, while a higher FFR provides investors with a risk-free return of 4.25%+, the post-GFC gamblers want to hit a home run by owning risk assets and awaiting a dovish pivot.
Yet, the gambit is the opposite of prudent risk management, and that’s why we warned on Oct. 26 that the crowd was fighting a losing battle. We wrote:
With two of the four largest companies in the S&P 500 suffering, the squeeze may have already run its course. Moreover, while positioning is still heavily short, the index offered tactical value near 3,600, not 3,850.
In addition, with the bearish medium-term fundamentals rearing their ugly head, and the Fed poised to raise interest rates by 75 basis points next week, stocks offer a poor risk-reward proposition when the FFR should hit 4%.
Furthermore, with the S&P 500 ending the Dec. 16 session at ~3,852, the index has gone nowhere in roughly a month and a half. In contrast, cash returns have increased as the Fed hiked the FFR. Therefore, with resilient inflation, employment and growth poised to push the FFR even higher, the risk-reward proposition of owning the S&P 500 and silver is even poorer now.
As such, while investors like to learn these lessons the hard way, the more they position for a dovish pivot, the less likely it is to occur.
The Bottom Line
While Fed officials have rattled the financial markets in recent days, a dormant VIX highlights investors’ lack of anxiety; and while the S&P 500 has suffered, the sell-off has been orderly and little panic has materialized. Consequently, gold, silver, mining stocks and the S&P 500 remain well above their fundamental values, as not only is a prospective recession not priced in, but the S&P 500’s forward price-to-earnings (P/E) ratio still doesn’t reflect the implications of a 5%+ FFR.
As a result, with earnings and the index’s multiple poised to contract in 2023, the Fed’s inflation fight should weigh heavily on the S&P 500 and the PMs.
In conclusion, the PMs rallied on Dec. 16, as the crowd views them as the new momentum play. Conversely, with the medium-term technicals and fundamentals still profoundly bearish, the downside momentum can be just as violent when sentiment shifts. Thus, we still expect new lows in 2023.
Overview of the Upcoming Part of the Decline
- It seems to me that the corrective upswing is over (or about to be over) and that the next big move lower is already underway (or that it’s about to start).
- If we see a situation where miners slide in a meaningful and volatile way while silver doesn’t (it just declines moderately), I plan to – once again – switch from short positions in miners to short positions in silver. At this time, it’s too early to say at what price levels this could take place and if we get this kind of opportunity at all – perhaps with gold prices close to $1,500 - $1,550.
- I plan to switch from the short positions in junior mining stocks or silver (whichever I’ll have at that moment) to long positions in junior mining stocks when gold / mining stocks move to their 2020 lows (approximately). While I’m probably not going to write about it at this stage yet, this is when some investors might consider getting back in with their long-term investing capital (or perhaps 1/3 or 1/2 thereof).
- I plan to return to short positions in junior mining stocks after a rebound – and the rebound could take gold from about $1,450 to about $1,550, and it could take the GDXJ from about $20 to about $24. In other words, I’m currently planning to go long when GDXJ is close to $20 (which might take place when gold is close to $1,450), and I’m planning to exit this long position and re-enter the short position once we see a corrective rally to $24 in the GDXJ (which might take place when gold is close to $1,550).
- I plan to exit all remaining short positions once gold shows substantial strength relative to the USD Index while the latter is still rallying. This may be the case with gold prices close to $1,400 and GDXJ close to $15 . This moment (when gold performs very strongly against the rallying USD and miners are strong relative to gold after its substantial decline) is likely to be the best entry point for long-term investments, in my view. This can also happen with gold close to $1,400, but at the moment it’s too early to say with certainty.
- The above is based on the information available today, and it might change in the following days/weeks.
You will find my general overview of the outlook for gold on the chart below:
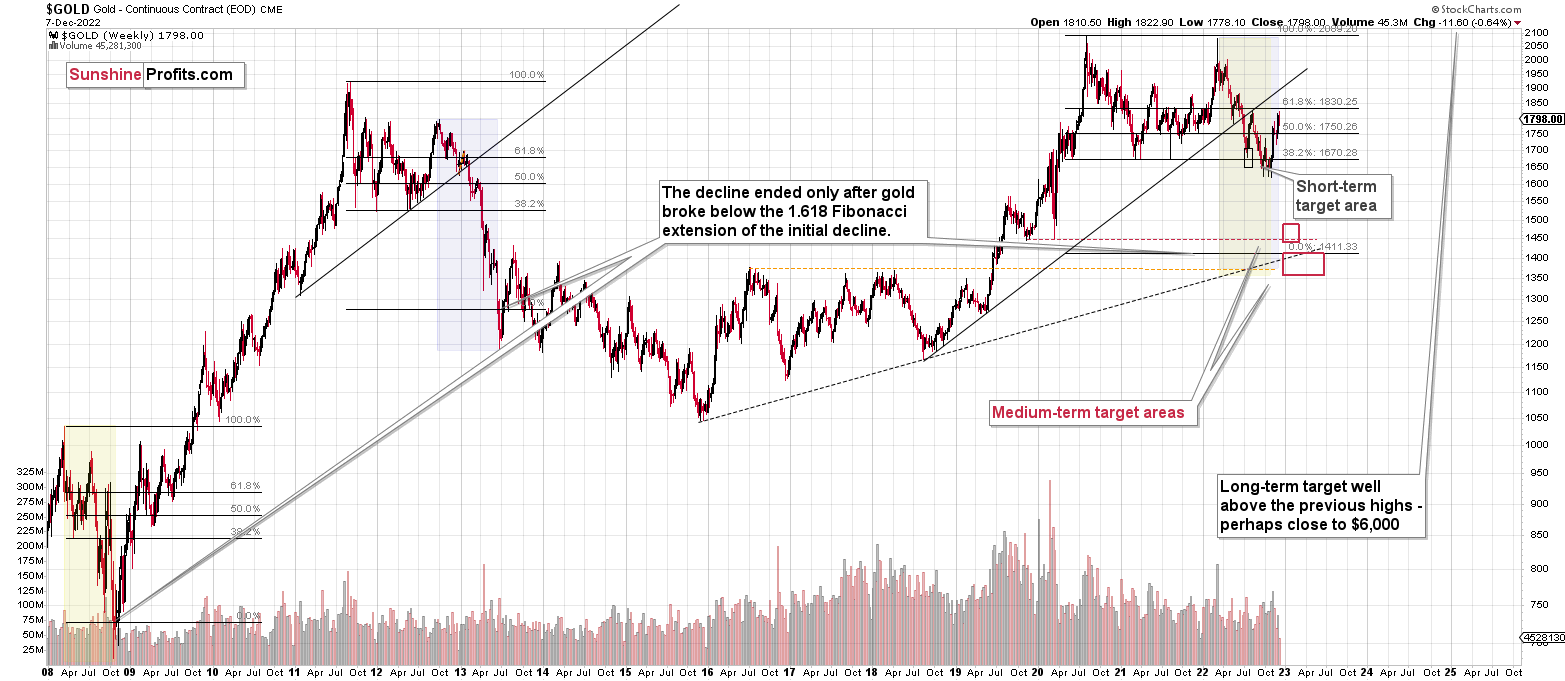
Please note that the above timing details are relatively broad and “for general overview only” – so that you know more or less what I think and how volatile I think the moves are likely to be – on an approximate basis. These time targets are not binding nor clear enough for me to think that they should be used for purchasing options, warrants, or similar instruments.
Letters to the Editor
We received a few messages over e-mail, but as we are moving to our new platform, we will be transferring them below the articles as comments – and that’s where we’ll be replying to them.
Please note that this section is going to go away within the next 1-8 weeks, as you can add comments/questions below the article on Golden Meadow – the platform that we’re using to provide our analyses. Your notification e-mails include an invitation link that allows you to access the “Gold Trading Alerts” space.
Also, if you haven’t had the chance to see the video, in which I’m talking about the new platform and why we essentially moved from Sunshine Profits to Golden Meadow, I strongly encourage you to do so:
Summary
Summing up, it seems that the major bottom in the USD Index is in, while the correction in stocks, gold, silver, and mining stocks is over.
The nature of the recent corrections was mostly technical and rumor-based. The rumor was that the Fed would be making a dovish U-turn soon, and it recently became clear that this is not going to be the case. Consequently, the corrective upswing is likely to be reversed, and medium-term downtrends are likely to resume.
In my opinion, the current trading position is going to become profitable in the following weeks, and quite possibly in the following days. And while I can’t promise any kind of performance, I fully expect it to become very profitable before it’s over and to prolong our 2022 winning streak.
After the final sell-off (that takes gold to about $1,350-$1,500), I expect the precious metals to rally significantly. The final part of the decline might take as little as 1-5 weeks, so it's important to stay alert to any changes.
As always, we'll keep you – our subscribers – informed.
To summarize:
Trading capital (supplementary part of the portfolio; our opinion): Full speculative short positions (300% of the full position) in junior mining stocks are justified from the risk to reward point of view with the following binding exit profit-take price levels:
Mining stocks (price levels for the GDXJ ETF): binding profit-take exit price: $20.32; stop-loss: none (the volatility is too big to justify a stop-loss order in case of this particular trade)
Alternatively, if one seeks leverage, we’re providing the binding profit-take levels for the JDST (2x leveraged). The binding profit-take level for the JDST: $27.87; stop-loss for the JDST: none (the volatility is too big to justify a SL order in case of this particular trade).
For-your-information targets (our opinion; we continue to think that mining stocks are the preferred way of taking advantage of the upcoming price move, but if for whatever reason one wants / has to use silver or gold for this trade, we are providing the details anyway.):
Silver futures downside profit-take exit price: $12.32
SLV profit-take exit price: $11.32
ZSL profit-take exit price: $74.87
Gold futures downside profit-take exit price: $1,504
HGD.TO – alternative (Canadian) 2x inverse leveraged gold stocks ETF – the upside profit-take exit price: $18.47
HZD.TO – alternative (Canadian) 2x inverse leveraged silver ETF – the upside profit-take exit price: $46.87
Long-term capital (core part of the portfolio; our opinion): No positions (in other words: cash)
Insurance capital (core part of the portfolio; our opinion): Full position
Whether you’ve already subscribed or not, we encourage you to find out how to make the most of our alerts and read our replies to the most common alert-and-gold-trading-related-questions.
Please note that we describe the situation for the day that the alert is posted in the trading section. In other words, if we are writing about a speculative position, it means that it is up-to-date on the day it was posted. We are also featuring the initial target prices to decide whether keeping a position on a given day is in tune with your approach (some moves are too small for medium-term traders, and some might appear too big for day-traders).
Additionally, you might want to read why our stop-loss orders are usually relatively far from the current price.
Please note that a full position doesn't mean using all of the capital for a given trade. You will find details on our thoughts on gold portfolio structuring in the Key Insights section on our website.
As a reminder - "initial target price" means exactly that - an "initial" one. It's not a price level at which we suggest closing positions. If this becomes the case (as it did in the previous trade), we will refer to these levels as levels of exit orders (exactly as we've done previously). Stop-loss levels, however, are naturally not "initial", but something that, in our opinion, might be entered as an order.
Since it is impossible to synchronize target prices and stop-loss levels for all the ETFs and ETNs with the main markets that we provide these levels for (gold, silver and mining stocks - the GDX ETF), the stop-loss levels and target prices for other ETNs and ETF (among other: UGL, GLL, AGQ, ZSL, NUGT, DUST, JNUG, JDST) are provided as supplementary, and not as "final". This means that if a stop-loss or a target level is reached for any of the "additional instruments" (GLL for instance), but not for the "main instrument" (gold in this case), we will view positions in both gold and GLL as still open and the stop-loss for GLL would have to be moved lower. On the other hand, if gold moves to a stop-loss level but GLL doesn't, then we will view both positions (in gold and GLL) as closed. In other words, since it's not possible to be 100% certain that each related instrument moves to a given level when the underlying instrument does, we can't provide levels that would be binding. The levels that we do provide are our best estimate of the levels that will correspond to the levels in the underlying assets, but it will be the underlying assets that one will need to focus on regarding the signs pointing to closing a given position or keeping it open. We might adjust the levels in the "additional instruments" without adjusting the levels in the "main instruments", which will simply mean that we have improved our estimation of these levels, not that we changed our outlook on the markets. We are already working on a tool that would update these levels daily for the most popular ETFs, ETNs and individual mining stocks.
Our preferred ways to invest in and to trade gold along with the reasoning can be found in the how to buy gold section. Furthermore, our preferred ETFs and ETNs can be found in our Gold & Silver ETF Ranking.
As a reminder, Gold & Silver Trading Alerts are posted before or on each trading day (we usually post them before the opening bell, but we don't promise doing that each day). If there's anything urgent, we will send you an additional small alert before posting the main one.
Thank you.
Przemyslaw K. Radomski, CFA
Founder, Editor-in-chief

