Briefly: in our opinion, full (300% of the regular position size) speculative short positions in junior mining stocks are justified from the risk/reward point of view at the moment of publishing this Alert.
Gold welcomed the first day of 2023 with a rally. It’s not that odd given that gold was declining most of the year, and some buyers probably wanted to harvest the tax savings by cashing in losses and they are buying back today (chart courtesy of https://GoldPriceForecast.com).
It doesn’t mean that the rally is here to stay. No, quite the opposite is likely.
Do you remember the “January rally” that we saw in early 2022? It lasted less than two days. Stocks moved higher on the first session of the year, and they formed an intraday top during the second session of the year.
And then, the S&P 500 moved from about 4,800 to levels below 3,600.
So, looking at the early-January performance might be misleading.
The lower part of the above chart features gold, silver, and the HUI Index (proxy for gold stocks). As you can see, silver outperformed gold strongly in December, while gold stocks did almost nothing, greatly underperforming gold. That’s a very powerful bearish indication for the following weeks. After all, that’s exactly what tends to happen close to market tops – silver outperforms, while gold stocks lag.
Speaking of mining stocks, did anything change in the case of junior mining stocks so far today?
No.
In today’s London trading (the U.S. markets are still closed while I’m writing this), the GDXJ opened relatively high, but it quickly erased about half of the upswing.
Is the 2023 top in junior mining stocks already in? It could be the case, especially if we focus on the first half of 2023. We might see a powerful rally in juniors in the second half of the year, but seeing a huge decline in the first half of the year is even more likely.
Of course, these are not the reasons for the decline per se – I listed multiple thereof (e.g., rising real interest rates) in my previous analyses.
The other key driver of gold prices (besides real interest rates) is the USD Index, and it just showed substantial strength today.
This comes after a breakout and a rather lengthy confirmation thereof. Therefore, this could be the start of another powerful rally.
Why doesn’t the “tax loss buyback” mechanism apply to the USD Index (as it does to gold or stocks)?
Because the USD Index is ultimately an index not an asset per se, and the index consists of individual currency exchange rates, most important of them being EUR/USD and JPY/USD. So, it’s the relative valuation of two currencies, not a single asset. If the above-mentioned mechanism applied to the U.S. dollar, it might as well apply to the euro, and to the Japanese yen. And in this case, the effects would cancel each other out in the case of the exchange rates.
Consequently, the rally in the USD Index might be the thing that is really happening today, while action in gold and the stock market might be just something temporary and of little meaning.
Having said that, let’s take a look at the markets from a more fundamental point of view.
Could a Hard Landing Rock Gold in 2023?
While the bearish cocktail of unanchored inflation and higher interest rates drove gold, silver, and mining stocks’ fundamental performances in 2022, a recession should push them to new lows in 2023.
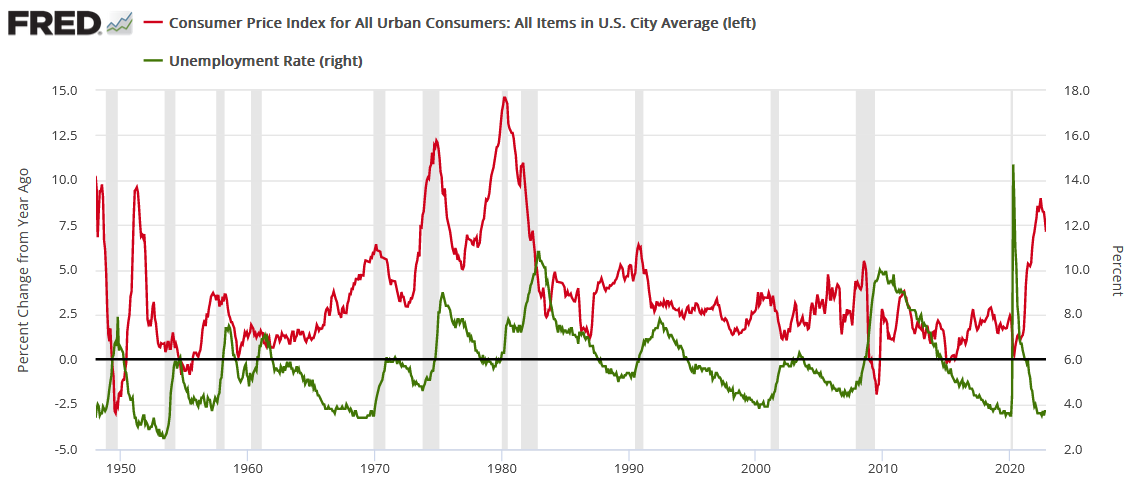
For example, nine of the last 10 bouts of rising inflation have ended with recessions since 1948, and the Fed’s “transitory” error in 2021 aligns this iteration with the other economic malaises. In a nutshell: the Fed let the U.S economy run too hot, and now has to over-tighten to normalize inflation. In the process, the 2022 economic script should flip in 2023.
Please see below:
To explain, the red line above tracks the year-over-year (YoY) percentage change in the headline Consumer Price Index (CPI), while the green line above tracks the U.S. unemployment rate. If you analyze the relationship, you can see that the headline CPI often hits a cycle high, the unemployment rate hits a cycle low, a recession occurs, and then the metrics converge.
Consequently, while we warned repeatedly that high inflation and a robust U.S. labor market would push the U.S. federal funds rate (FFR) higher in 2022, a reversal of fortunes in 2023 should reduce inflation at the expense of employment.
To that point, history shows that large gaps between the YoY headline CPI and the unemployment rate elicit sharp reversions; and if you analyze the right side of the chart, you can see that the gap between the two rivals the major divergences from 1948, 1951 and the 1970s/early 1980s. As a result, if (when) the next iteration unfolds, the gold price should suffer as liquidations spread across the financial markets.
Furthermore, with hawkish economic data hitting the wire in December and for much of 2022, higher interest rates have suppressed investor sentiment. However, the economic impact of a higher FFR has been minimal, which highlights why the bearish fundamental thesis still has room to run.
For example, the Fed hoped that a higher FFR would reduce inflation and slow the U.S. labor market to a greater degree than what transpired. Moreover, while investors panicked about a potential collapse of the U.S. housing market, the damage has been immaterial, and much more weakness should materialize before this bear market ends.
Please see below:
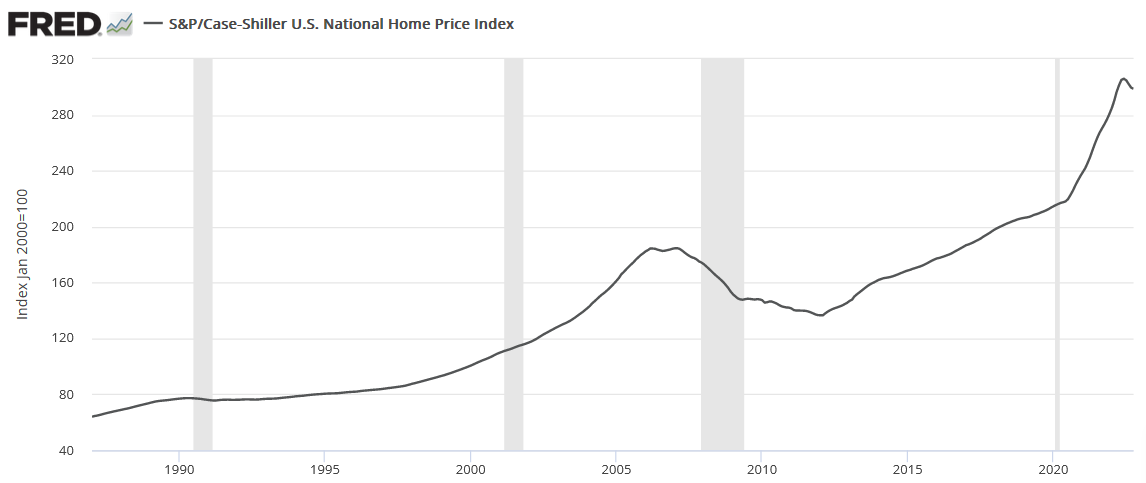
To explain, the U.S. housing market is no different than the S&P 500; and with the crowd so used to the Fed saving the day, they buy the dip believing that the post-GFC trend of perpetually higher prices will continue. Yet, their recency bias contrasts the fundamental realities.
The gray line above tracks the S&P/Case-Shiller U.S. National Home Price Index. If you analyze the right side of the chart, you can see that the recent slide is inconsequential relative to the near-vertical ascent that occurred during the pandemic-induced stimulus frenzy in 2020 and 2021.
So, U.S. home prices have barely corrected, and investors are kidding themselves if they think the worst is in the rearview.
To that point, if you analyze the gray line’s ascent leading up to the global financial crisis (GFC), you can see that a sharp re-rating occurred as prices reconnected with fundamental reality; and while the narrative proclaims that the U.S. housing market has been crushed, the reality is that the correction has likely only just begun.
Remember, it’s not only the historical implications of unanchored inflation that signal a sharp recession in 2023, but the imbalances of near-record low unemployment and near-record high home prices highlight why the metrics need to rise and fall substantially to reach more normalized levels.
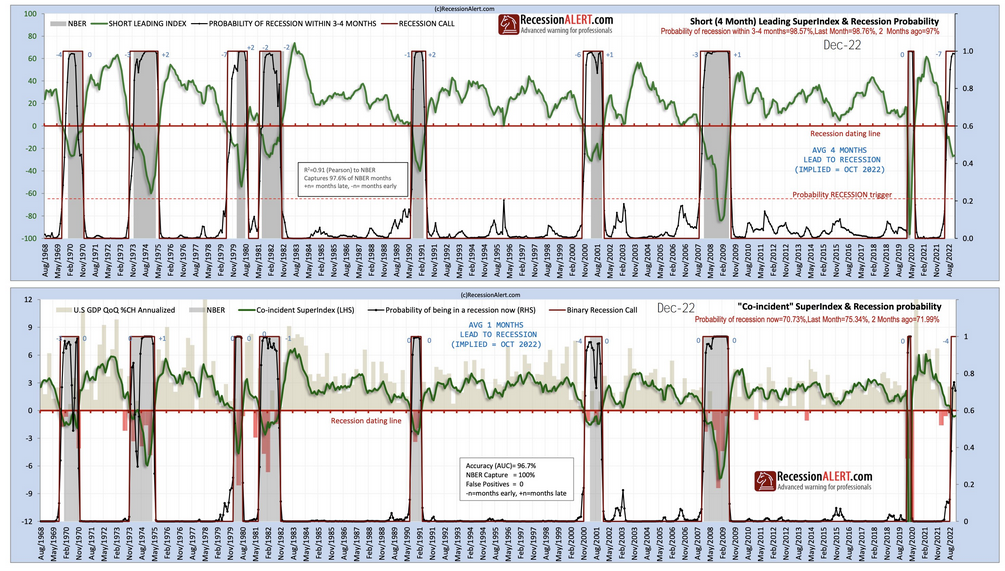
Continuing the theme, the frailty of leading economic indicators also highlights why recession pressures should accelerate in 2023.
Please see below:
To explain, the green line on the first chart above tracks the movement of RecessionAlert's short-term leading economic index, while the black line tracks the probability of a recession over the next three to four months.
Similar to the inflation-unemployment divergence that we highlighted at the outset, the short-term leading economic index has sunk into negative territory, while the recession probability metric stands at 98.57%.
Therefore, while Main Street sidestepped Wall Street's carnage in 2022, both should feel the pain in 2023; and as the drama unfolds, risk assets like gold should suffer, and silver and mining stocks will likely experience the greatest drawdowns.
In addition, the crowd still assumes that the Fed will cut interest rates in 2023. However, we've warned on numerous occasions that dovish pivots amid high inflation occur alongside major economic weakness, which makes the events bearish, not bullish. Or, to put it another way, the fear of an imminent recession overpowers the celebration of lower interest rates and causes a panic-like sell-off.
As such, investors have priced in an extremely unrealistic outcome in 2023, as even if the U.S. avoids a recession (highly unlikely), the fundamental backdrop is still more bearish than what's anticipated.
Please see below:
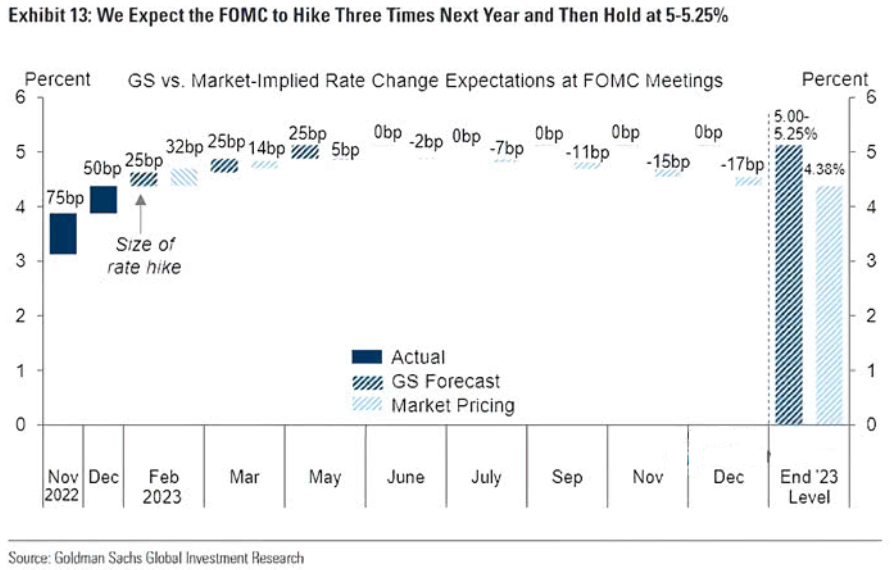
To explain, Goldman Sachs expects the FFR to peak in the 5% to 5.25% range in 2023. But, while its forecast aligns with the consensus, the latter expects rate cuts in the back half of the year.
Conversely, Goldman Sachs expects the U.S. to avoid a recession, which is why the investment bank projects no rate cuts in 2023; and therein lies the conundrum: if the U.S. economy remains resilient, the futures market will have to price in a higher FFR for the end of 2023.
On the flip side, recession-induced rate cuts are unlikely to increase optimism when corporate earnings forecasts are being cut dramatically. Thus, both scenarios are bearish, and risk assets need to fall further to reflect the challenges that lie ahead.
Overall, while the PMs outperformed stocks and bonds in December, they should play catch-up when the next bout of panic arrives. Consequently, we expect more weakness before long-term buying opportunities emerge.
Silver Should Watch the FAANGs
While silver ended 2022 on a high note, the USD Index’s late 2022 pullback helped ease the burden of higher interest rates. Although, with a greenback comeback poised to materialize in 2023, the two-headed monster of a higher U.S. 10-Year real yield and a stronger USD Index should create an ominous fundamental backdrop for the PMs.
On top of that, with overvalued technology stocks poised to help push the S&P 500 to new lows, their plight should help upend silver in 2023. For context, we wrote on Dec. 30:
The S&P 500’s autumn slide culminated with the silver price sinking below $18; and while there could be a pathway to $30 in 2023, we believe that new lows for the S&P 500 should culminate with new lows for silver.
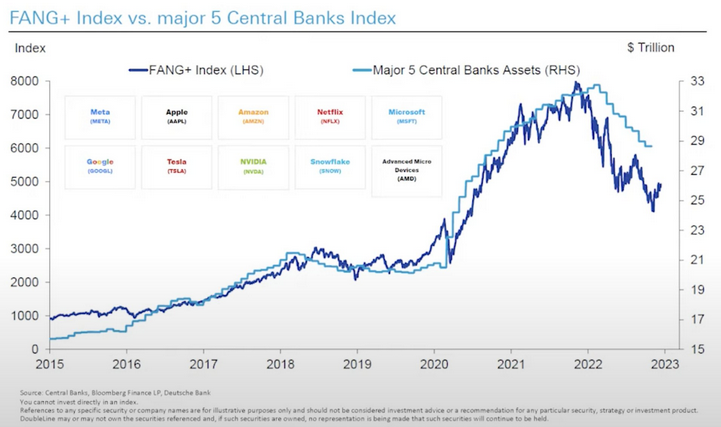
To that point, with the Fed’s balance sheet continuing to drop, QT has usurped QE; and with the development weighing heavily on Big Tech, the cascading effect could also capsize the silver price.
Please see below:
To explain, the dark blue line above tracks the FAANG+ index – which includes heavyweights like Facebook (Meta Platforms), Amazon, Apple, Netflix, Google (Alphabet) and others – while the light blue line above tracks the consolidated balance sheet of the five-largest central banks.
If you analyze the relationship, you can see that QE had been a boon for these stocks, as free money increased multiples and created abnormally high valuations. Conversely, with QT commencing in 2022, the declining light blue line helped pop the Big Tech bubble.
More importantly, with QT poised to continue in 2023, more pain should confront these behemoths, and the S&P 500 is unlikely to stay afloat if its largest constituents continue to sink.
Likewise, history shows that the post-GFC imbalances are still far from remedied.
Please see below:
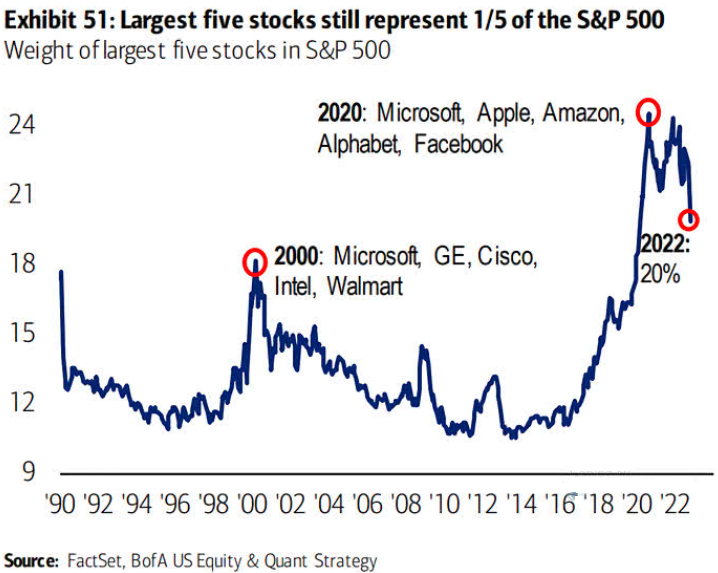
To explain, the blue line above shows that the five-largest stocks in the S&P 500 from 2020 still make up 20% of the overall index. Moreover, the figure exceeds the ~18% peak from the height of the dot-com bubble.
Furthermore, when the bubble popped in 2000, the combined market cap of the millennium darlings as a percentage of the S&P 500 declined for years thereafter. Thus, while this bubble has deflated from ~24% to 20%, it’s still a long way from the 12% or less seen throughout history. As a result, Big Tech’s bloodbath should continue in the months ahead.
If we isolate the S&P 500, valuation also implies considerable downside before achieving a final low.
Please see below:
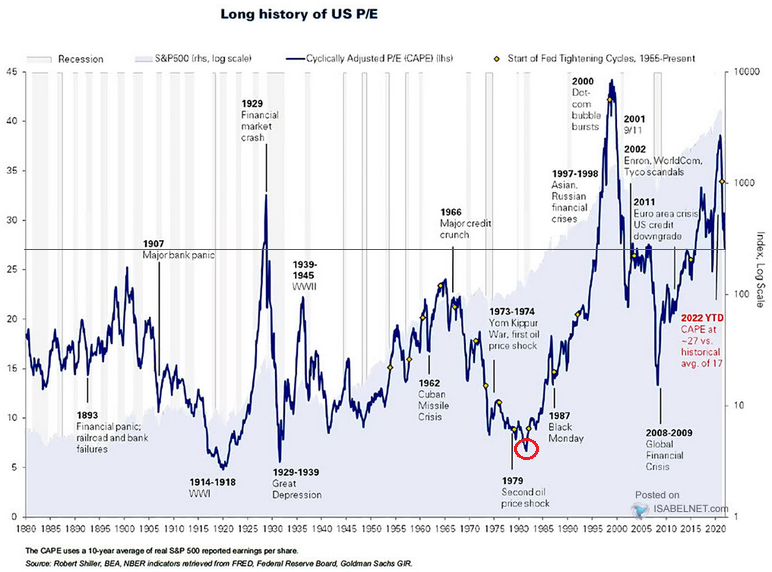
To explain, the dark blue line above tracks the Cyclically Adjusted Price-to-Earnings (CAPE) Ratio, which uses the average of S&P 500 companies’ realized 10-year earnings, adjusted for inflation.
If you analyze the horizontal red line, you can see that the current reading of 27 remains historically high. Crucially, the relatively high readings recorded post-GFC occurred alongside stable inflation and record-low interest rates. In contrast, the lower readings from ~1900 to 2000 occurred alongside uncertain economic backdrops that rival today’s environment.
Notice how the CAPE Ratio sunk like a stone in the 1970s and nearly hit 5 in ~1980 (the red circle)? This is what happens when unanchored inflation jumps around and refuses to quit. Therefore, while a drop of that magnitude is unlikely in 2023, it still highlights why 27 is materially out of whack with the current fundamental backdrop.
So, while the silver price held up relatively well despite the S&P 500’s ~20% decline in 2022, history shows that recessions are bearish for silver, as the white metal’s high-beta behavior makes it ripe for sharp drawdowns. To explain, we wrote on Nov. 25:
While we’ve been bullish on the U.S. economy for some time, the actions required to normalize inflation should result in substantial economic weakness over the next 12 months, and economically sensitive metals, like silver, should suffer more than gold when the tide turns.
Please see below:
To explain, the gray line above tracks the monthly movement of the silver futures price, while the red line above tracks the monthly movement of the copper futures price. If you analyze the relationship, you can see that they often follow in each other’s footsteps over the long term.
Furthermore, when the recession hit in 2001, it culminated with a ~20% decline in the silver futures price, while the 2007-2009 recession resulted in a ~46% drop, and the 2020 recession resulted in a ~23% drop. Consequently, while silver may seem like a solid momentum play when prices rise, the reversal can be just as violent on the downside.
Overall, silver has outperformed gold, bonds, and the S&P 500 during this corrective upswing, but the optimism should turn to pessimism over the medium term. With the U.S. confronting a meaningful recession and the ramifications far from priced in, a dash for cash could help the silver price take out its 2022 lows in the months ahead.
The Bottom Line
While the S&P 500 suffered mightily in 2022 and the GDXJ ETF (our short position) declined by ~15%, there are still plenty of unfinished imbalances that need to be rectified; and with the next fundamental phase poised to shift the conversation from inflation and interest rates to a recession, "soft landing" expectations will likely be 2023's version of "transitory." Remember, the Fed has a problem that QE can't solve, and history shows there is no easy way out.
In conclusion, the PMs were mixed on Dec. 30, as the dip buyers came in late to save the S&P 500. But, 2022's ominous implications remain, and risk assets are unlikely to make any meaningful traction while real interest rates rise, and the Fed ups the FFR. Therefore, while the USD Index is the missing link, it's important to remember that the greenback was a winner in 2022, and we believe another run to higher highs is on the horizon.
Overview of the Upcoming Part of the Decline
- It seems to me that the corrective upswing is over (or about to be over) and that the next big move lower is already underway (or that it’s about to start).
- If we see a situation where miners slide in a meaningful and volatile way while silver doesn’t (it just declines moderately), I plan to – once again – switch from short positions in miners to short positions in silver. At this time, it’s too early to say at what price levels this could take place and if we get this kind of opportunity at all – perhaps with gold prices close to $1,500 - $1,550.
- I plan to switch from the short positions in junior mining stocks or silver (whichever I’ll have at that moment) to long positions in junior mining stocks when gold / mining stocks move to their 2020 lows (approximately). While I’m probably not going to write about it at this stage yet, this is when some investors might consider getting back in with their long-term investing capital (or perhaps 1/3 or 1/2 thereof).
- I plan to return to short positions in junior mining stocks after a rebound – and the rebound could take gold from about $1,450 to about $1,550, and it could take the GDXJ from about $20 to about $24. In other words, I’m currently planning to go long when GDXJ is close to $20 (which might take place when gold is close to $1,450), and I’m planning to exit this long position and re-enter the short position once we see a corrective rally to $24 in the GDXJ (which might take place when gold is close to $1,550).
- I plan to exit all remaining short positions once gold shows substantial strength relative to the USD Index while the latter is still rallying. This may be the case with gold prices close to $1,400 and GDXJ close to $15 . This moment (when gold performs very strongly against the rallying USD and miners are strong relative to gold after its substantial decline) is likely to be the best entry point for long-term investments, in my view. This can also happen with gold close to $1,400, but at the moment it’s too early to say with certainty.
- The above is based on the information available today, and it might change in the following days/weeks.
You will find my general overview of the outlook for gold on the chart below:
Please note that the above timing details are relatively broad and “for general overview only” – so that you know more or less what I think and how volatile I think the moves are likely to be – on an approximate basis. These time targets are not binding nor clear enough for me to think that they should be used for purchasing options, warrants, or similar instruments.
Letters to the Editor
We received a few messages over e-mail, but as we are moving to our new Golden Meadow platform, we will be transferring them below the articles as comments – and that’s where we’ll be replying to them.
On the platform, please ask your questions below the articles or in the spaces called “Ask the Community” or “Position Sizes” directly – it will help us deliver a reply sooner. In some cases, someone from the community might reply and help even before we do.
Please remember about the Pillars of our Community, especially about the Kindness of Speech Pillar.
Also, if there’s anything that you’re unhappy with, it’s best to send us a message at [email protected].
Please note that this section is going to go away within the next 1-8 weeks, as you can add comments/questions below the article on Golden Meadow – the platform that we’re using to provide our analyses. Your notification e-mails include an invitation link that allows you to access the “Gold Trading Alerts” space.
Also, if you haven’t had the chance to see the video, in which I’m talking about the new platform and why we essentially moved from Sunshine Profits to Golden Meadow, I strongly encourage you to do so:
Summary
Summing up, it seems that the major bottom in the USD Index is in, while the correction in stocks, gold, silver, and mining stocks is over or very close to being over.
The nature of the recent corrections was mostly technical and rumor-based. The rumor was that the Fed would be making a dovish U-turn soon, and it recently became clear that this was not going to be the case. Consequently, the corrective upswing is likely to be reversed, and medium-term downtrends are likely to resume.
In my opinion, the current trading position is going to become profitable in the following weeks, and quite possibly in the following days. And while I can’t promise any kind of performance, I fully expect it to become very profitable before it’s over and to prolong our 2022 winning streak.
After the final sell-off (that takes gold to about $1,350-$1,500), I expect the precious metals to rally significantly. The final part of the decline might take as little as 1-5 weeks, so it's important to stay alert to any changes.
As always, we'll keep you – our subscribers – informed.
To summarize:
Trading capital (supplementary part of the portfolio; our opinion): Full speculative short positions (300% of the full position) in junior mining stocks are justified from the risk to reward point of view with the following binding exit profit-take price levels:
Mining stocks (price levels for the GDXJ ETF): binding profit-take exit price: $20.32; stop-loss: none (the volatility is too big to justify a stop-loss order in case of this particular trade)
Alternatively, if one seeks leverage, we’re providing the binding profit-take levels for the JDST (2x leveraged). The binding profit-take level for the JDST: $22.87; stop-loss for the JDST: none (the volatility is too big to justify a SL order in case of this particular trade).
For-your-information targets (our opinion; we continue to think that mining stocks are the preferred way of taking advantage of the upcoming price move, but if for whatever reason one wants / has to use silver or gold for this trade, we are providing the details anyway.):
Silver futures downside profit-take exit price: $14.32
SLV profit-take exit price: $13.42
ZSL profit-take exit price: $48.87
Gold futures downside profit-take exit price: $1,504
HGD.TO – alternative (Canadian) 2x inverse leveraged gold stocks ETF – the upside profit-take exit price: $16.47
HZD.TO – alternative (Canadian) 2x inverse leveraged silver ETF – the upside profit-take exit price: $36.87
Long-term capital (core part of the portfolio; our opinion): No positions (in other words: cash)
Insurance capital (core part of the portfolio; our opinion): Full position
Whether you’ve already subscribed or not, we encourage you to find out how to make the most of our alerts and read our replies to the most common alert-and-gold-trading-related-questions.
Please note that we describe the situation for the day that the alert is posted in the trading section. In other words, if we are writing about a speculative position, it means that it is up-to-date on the day it was posted. We are also featuring the initial target prices to decide whether keeping a position on a given day is in tune with your approach (some moves are too small for medium-term traders, and some might appear too big for day-traders).
Additionally, you might want to read why our stop-loss orders are usually relatively far from the current price.
Please note that a full position doesn't mean using all of the capital for a given trade. You will find details on our thoughts on gold portfolio structuring in the Key Insights section on our website.
As a reminder - "initial target price" means exactly that - an "initial" one. It's not a price level at which we suggest closing positions. If this becomes the case (as it did in the previous trade), we will refer to these levels as levels of exit orders (exactly as we've done previously). Stop-loss levels, however, are naturally not "initial", but something that, in our opinion, might be entered as an order.
Since it is impossible to synchronize target prices and stop-loss levels for all the ETFs and ETNs with the main markets that we provide these levels for (gold, silver and mining stocks - the GDX ETF), the stop-loss levels and target prices for other ETNs and ETF (among other: UGL, GLL, AGQ, ZSL, NUGT, DUST, JNUG, JDST) are provided as supplementary, and not as "final". This means that if a stop-loss or a target level is reached for any of the "additional instruments" (GLL for instance), but not for the "main instrument" (gold in this case), we will view positions in both gold and GLL as still open and the stop-loss for GLL would have to be moved lower. On the other hand, if gold moves to a stop-loss level but GLL doesn't, then we will view both positions (in gold and GLL) as closed. In other words, since it's not possible to be 100% certain that each related instrument moves to a given level when the underlying instrument does, we can't provide levels that would be binding. The levels that we do provide are our best estimate of the levels that will correspond to the levels in the underlying assets, but it will be the underlying assets that one will need to focus on regarding the signs pointing to closing a given position or keeping it open. We might adjust the levels in the "additional instruments" without adjusting the levels in the "main instruments", which will simply mean that we have improved our estimation of these levels, not that we changed our outlook on the markets. We are already working on a tool that would update these levels daily for the most popular ETFs, ETNs and individual mining stocks.
Our preferred ways to invest in and to trade gold along with the reasoning can be found in the how to buy gold section. Furthermore, our preferred ETFs and ETNs can be found in our Gold & Silver ETF Ranking.
As a reminder, Gold & Silver Trading Alerts are posted before or on each trading day (we usually post them before the opening bell, but we don't promise doing that each day). If there's anything urgent, we will send you an additional small alert before posting the main one.
Thank you.
Przemyslaw K. Radomski, CFA
Founder, Editor-in-chief


