Briefly: in our opinion, full (300% of the regular position size) speculative short positions in mining stocks are justified from the risk/reward point of view at the moment of publishing this Alert.
The recent speculative mania stemming from Reddit’s WallStreetBets forum has taken established institutional investors by surprise and spilled over into affecting the performance of the Nasdaq100 and the precious metals.
A simple look at Google Trends reveals that searches have gone through the roof for Gamestop and other poorly performing companies that have been shorted by Wall Street. Small traders are currently having an outsized effect on the markets and because nothing operates in a vacuum, gold, silver and miners will also have to factor in these recent developments.
Gold, silver, and mining stocks are likely to move much lower in the following weeks, and the breakdown that we just saw in the mining stocks is a very important sign pointing to that.
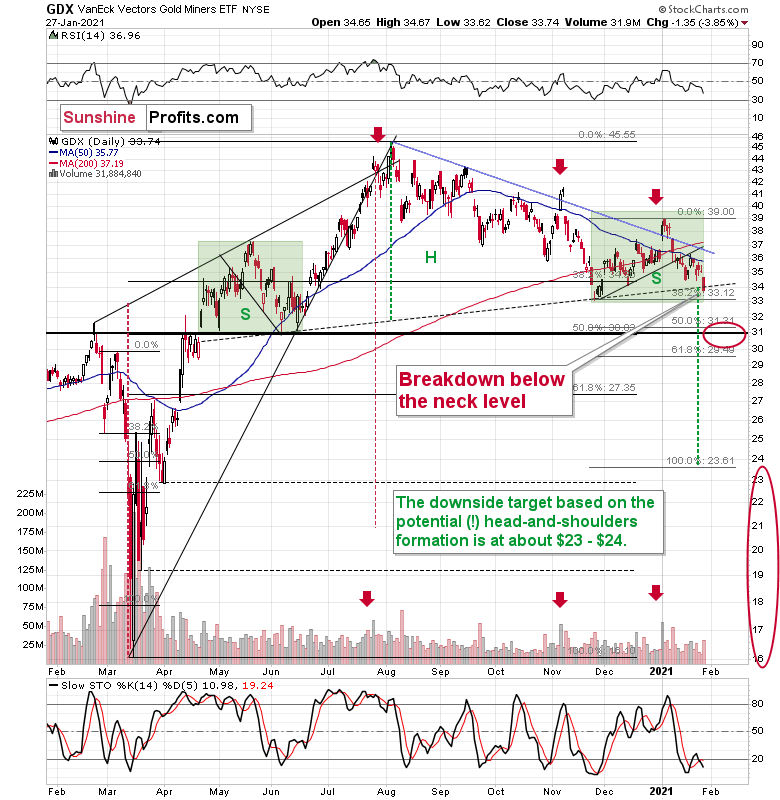
Figure 1 – VanEck Vectors Gold Miners ETF (GDX)
After consolidating for about two months, gold miners are showing significant weakness relative to gold once again, and they just broke below the neck level of almost a year long head-and-shoulders formation.
The green boxes above are the shoulders of the formation. Interestingly, they are identical in size, which means that both shoulders are symmetrical. This makes the formation more reliable. The formation was just completed, and when the breakdown below the neck level is fully confirmed, the implications will become very bearish for the next several weeks.
The likely minimum size of the decline based on the H&S pattern is equal to the size of the “head” of the pattern. We marked it with green, dashed lines, and they point to ~$24 as the minimum downside target. That’s what our broad target area reflects.
Please note that the H&S-pattern-based target corresponds to the target based on one of the Fibonacci extensions – the same that worked as a very useful tool in predicting the bottom in March. Please note that miners moved below this target on a very temporary basis.
However, since no market moves in a straight line (even during the March 2020 slide, there were intraday corrections), I expect to see a corrective upswing (or more thereof) before GDX moves as low. The first important stop is likely to be at about $31. This level is based on the 50% Fibonacci retracement level, previous highs and lows (also ones not visible on the above chart).
The breakdown in GDX is not yet confirmed, but once the GDX closes below this line for two more days, it will be confirmed. Based on today’s pre-market downswing in gold and based on the analogous breakdown in the junior miners (GDXJ ETF), it seems very likely that the breakdown in the GDX will indeed be confirmed.
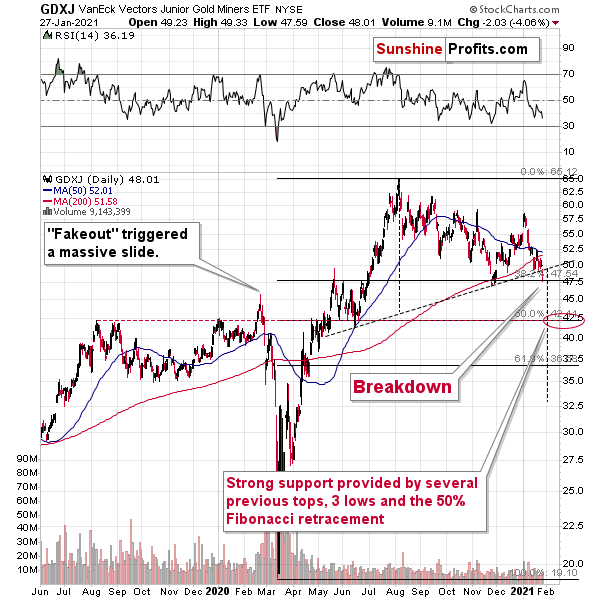
Figure 2 - VanEck Vectors Junior Gold Miners ETF (GDXJ)
In the case of the junior miners the initial downside target is a about $42.5, which is also based on the 50% Fibonacci retracement and the previous highs and lows.
GDXJ declined slightly more than GDX yesterday, which is something quite normal, given that the general stock market has also declined quite visibly (as Matthew Levy, CFA and I had indicated).
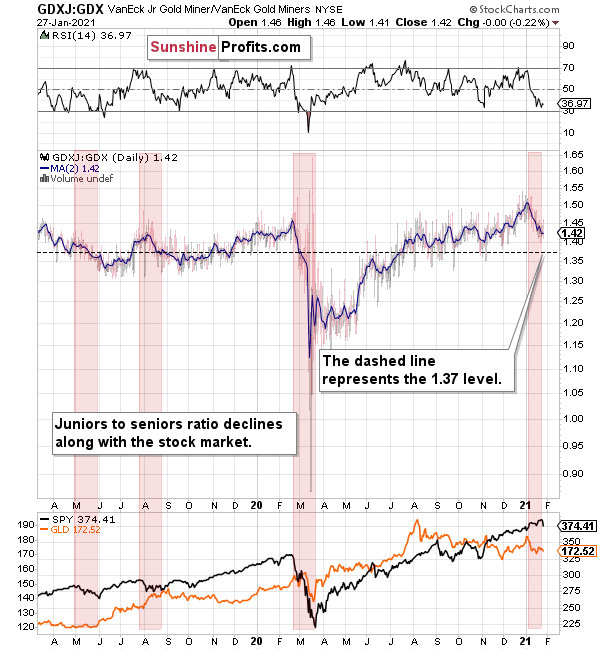
Since the stock market is likely to decline in the following months (and quite possibly weeks, and days – while the “days” part is least clear from my point of view – Matthew will have much greater insight), which means that juniors are likely to decline more than seniors. And their ratio suggests the same thing.
Figure 3
The short-term trend is already down and given the current pace of decline, the 1.37 level could be reached within the next few days/weeks. This level of the ratio would correspond to both my interim target levels being reached at the same time ($42.5 / $31 = ~1.37)
Still, please note how low the ratio moved during the 2020 slide. If stocks decline substantially, then juniors are once again likely to be hit more than senior miners (both are likely to slide much lower, though).
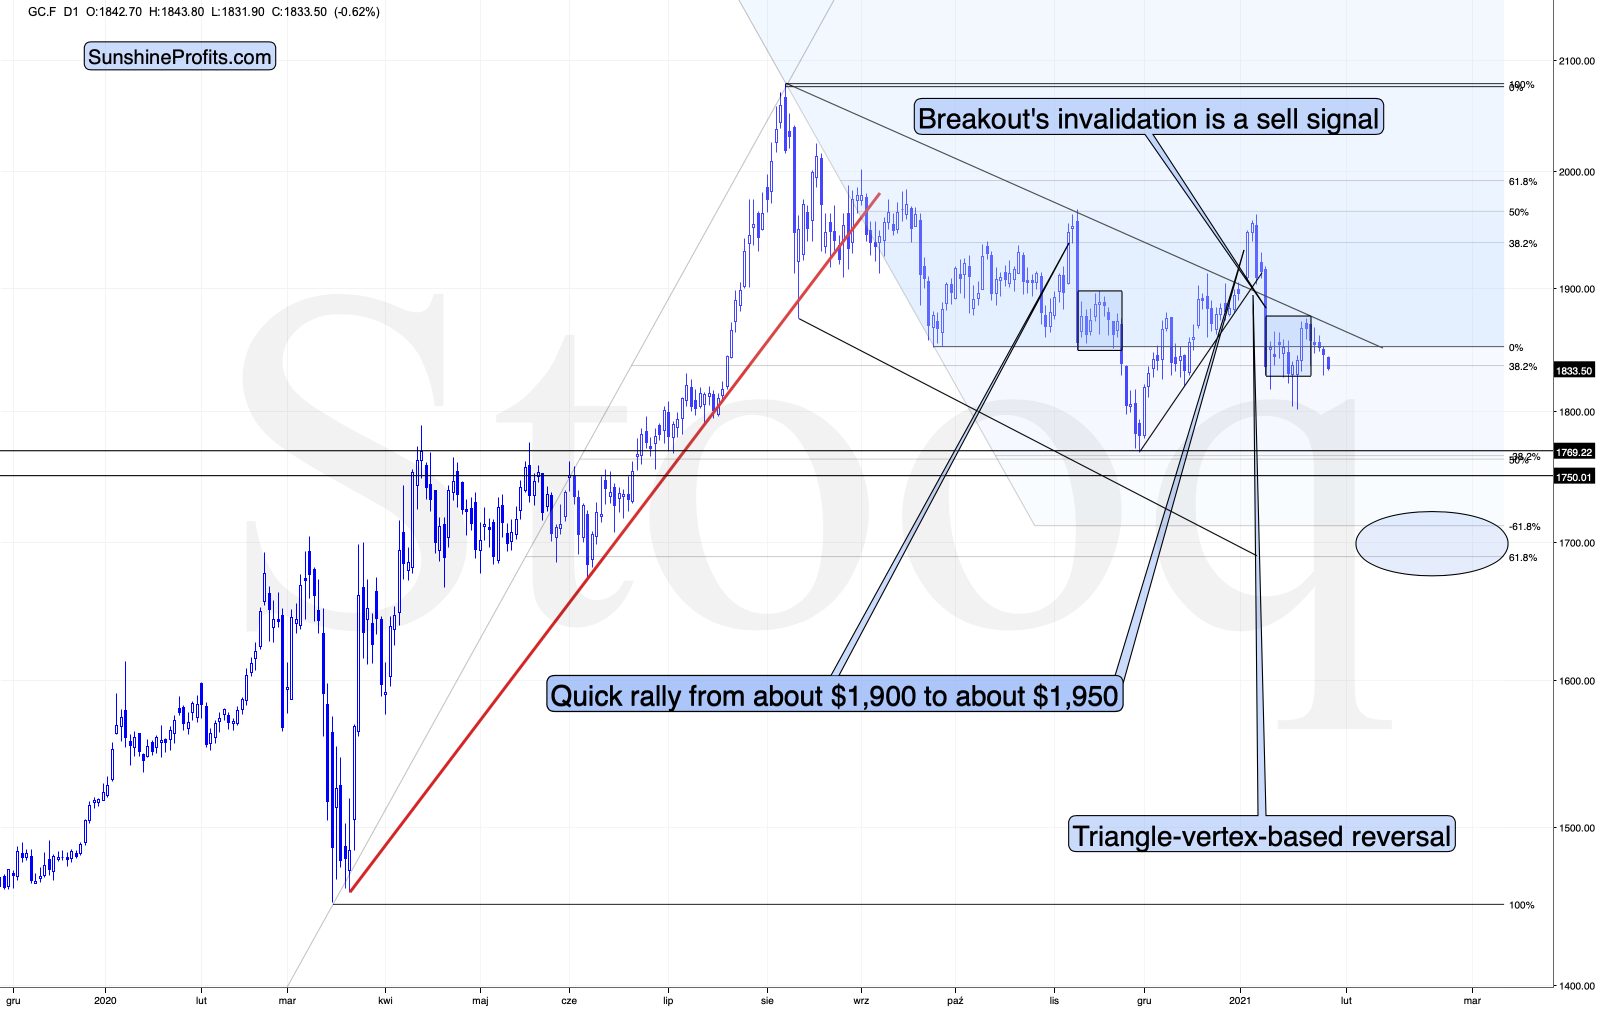
I previously wrote about mining stocks’ relative performance. Here’s what gold just did:
Figure 4
In short, gold is steadily declining. Please note that while miners just closed at fresh yearly lows and close to their November lows, gold is visibly above both levels. That’s a crystal-clear indication of miners’ underperformance and a very bearish indication going forward.
It’s been very often the case that miners’ weak performance preceded declines in the entire precious metals sector. This happened in Q1 2020, as well as before the massive 2013 slide in gold, silver, and mining stocks. It also seems to be indicating something profound this time.
Figure 5
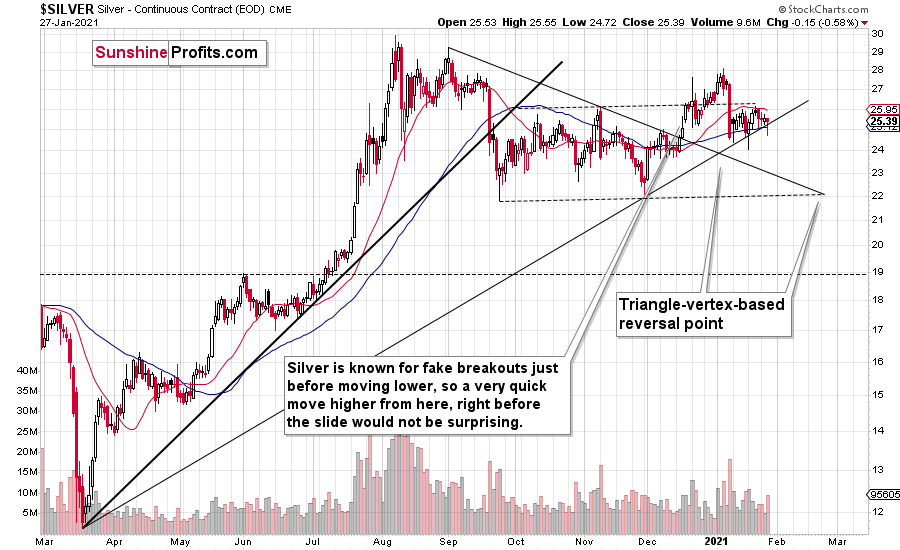
Silver held up relatively well yesterday, which is not that odd given two things:
- Silver tends to perform well close to market tops.
- Silver is right above its medium-term support line, which already stopped declines twice.
So, silver is relatively strong, and miners are relatively weak – that’s exactly what we tend to see before declines in the precious metals market.
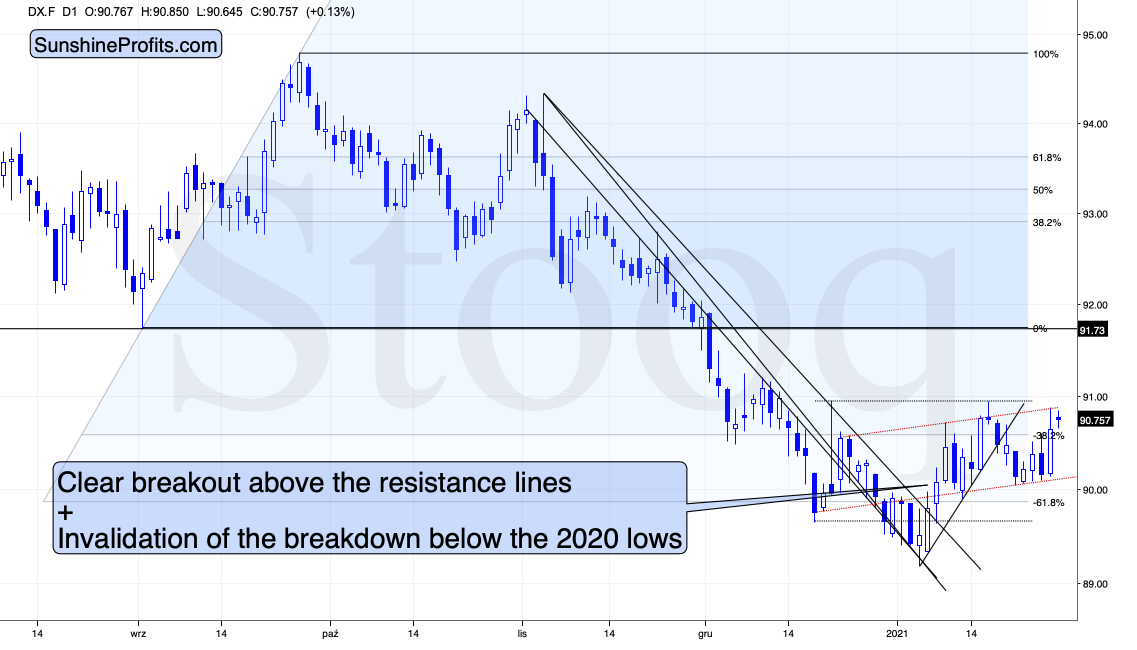
The spark for another powerful decline in the PMs and miners might come from the rallying USD Index.
Figure 6
The USD Index is testing its previous 2020 highs, and it might (!) be forming the right shoulder of a short-term head-and-shoulders pattern. The key word here is “might”. If the USDX rallies above its previous highs (about ~91), this pattern will be invalidated and the short-term outlook for the USDX will be clearly bullish. This would also serve as a breakout above the inverse head-and-shoulders pattern (mid-Dec. low being the left shoulder, the early 2021 low being the head, and the recent low being the right shoulder), which would have even more bullish implications (with the price target above 92).
Would this be enough for gold to decline to $1,700? It might not be enough, but it might be enough for the miners to move to my above-mentioned initial downside targets ($31 and $42.5 for GDX and GDXJ, respectively).
Having said that, let’s take a look at the market from a more fundamental angle.
Tick Tock
Warren Buffett once wrote, “Normally sensible people drift into behavior akin to that of Cinderella at the ball. They know that overstaying the festivities, that is, continuing to speculate in companies that have gigantic valuations relative to the cash they are likely to generate in the future will eventually bring on pumpkins and mice. Therefore, the giddy participants all plan to leave just seconds before midnight. There’s a problem, though: they are dancing in a room in which the clocks have no hands.”
On Jan. 21, I warned that the NASDAQ’s ticking time bomb could eventually blow up the precious metals.
I wrote:
Figure 7 - Source: Bloomberg/ Liz Ann Sonders
To highlight why averages exist in the first place, notice the identical pattern that emerged from 2009 to 2010 (the red boxes)? Following the 2008 financial (housing) crisis, U.S. equities bottomed in March of 2009. Several months later, euphoria took hold and the percentage of NASDAQ Composite companies trading above their 200-day MA surged back to record levels (near the end of 2009).
Another happy ending?
Not quite.
As valuations decoupled from reality, a Minsky Moment struck in early 2010, with the NASDAQ Composite plunging by more than 17% in just over two months.
Then, on Jan. 26, I detailed the potential impact on the PMs:
Along for the ride, the NASDAQ 100 – the largest 100 companies in the index – also declined by nearly 16%.
Figure 8
And circling back to the PMs, the performance of the NASDAQ 100 is an important variable. If you analyze the chart below, you can see that the last five times the NASDAQ 100 declined by more than 2% in a single day – gold, silver and the gold miners all suffered significant drawdowns.
Figure 9
Fast forward to Wednesday (Jan. 27):
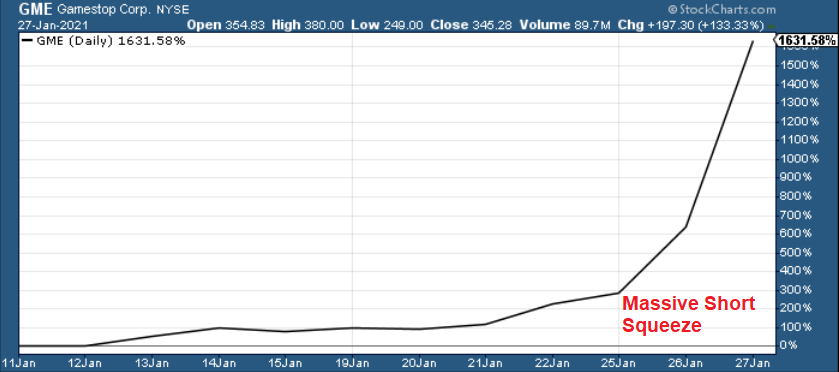
With the speculative mania reaching new heights (underpinned by record leverage), GameStop (GME) was the straw that broke the camel’s back.
Please see below:
Figure 10
Rising by more than 1,600% over the last 12 trading days, this week’s massive, short squeeze highlights how todays’ investors have turned Wall Street into a roulette wheel.
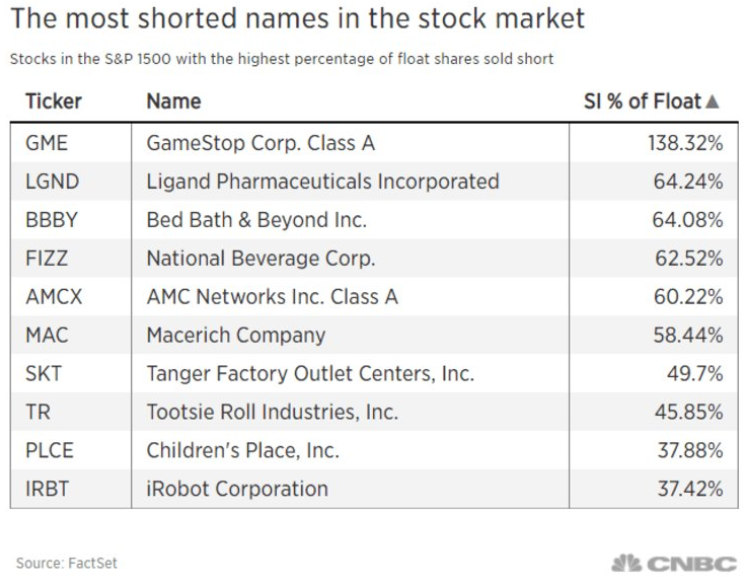
For context, GameStop is the most shorted stock on the Street.
Figure 11
And manufacturing the epic short squeeze, traders on Reddit’s WallStreetBets (WSB) forum banned together and bid up the stock. In response, hedge funds and other institutional investors (that were betting against the stock) were forced to cover their short positions (as the stock price rose and losses mounted). As a result, the gambit finally came to a head on Wednesday.
Figure 12
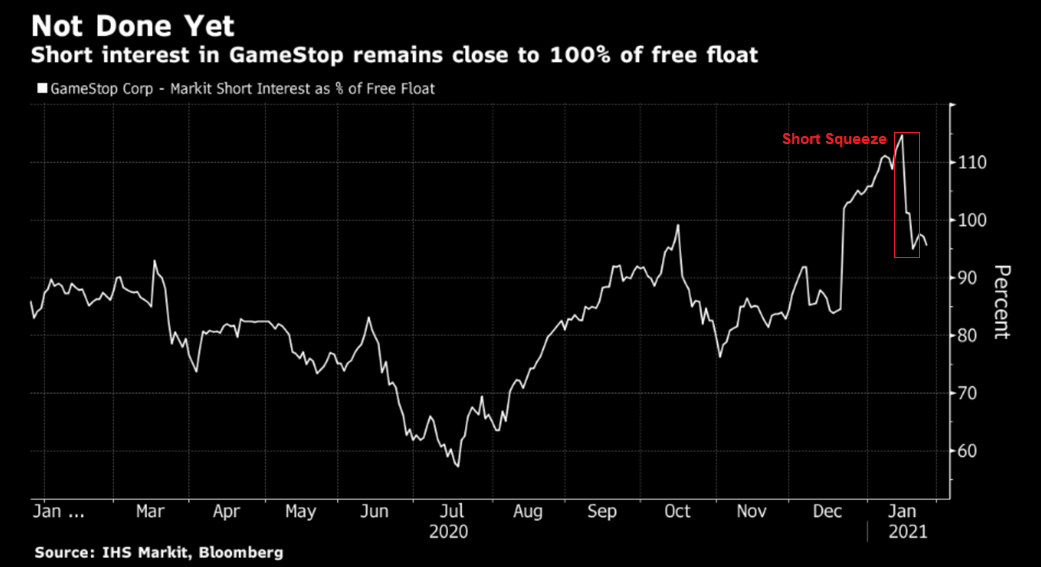
To explain the chart above, at the beginning of 2021, the number of shares short GameStop actually exceed its free float (shares publicly available). But if you analyze the red box above, you can see that roughly 20% of those short positions have been forced to cover since the explosion unfolded on Jan. 25.
And how did this behavior spill over into the PMs?
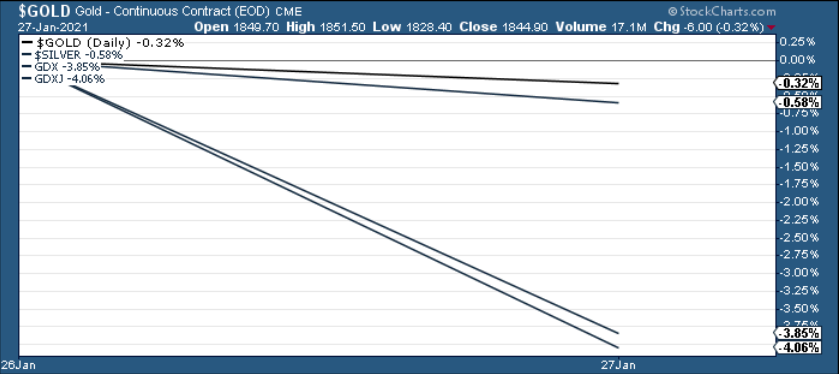
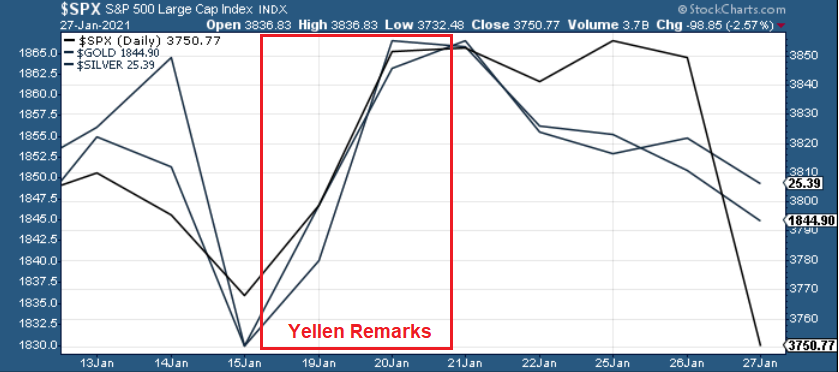
Well, with the bubble buyers becoming more brazen by the day, their skittish counterparts finally felt something was amiss on Wednesday. And with the NASDAQ 100 plunging by 2.80% (the S&P 500 also fell by 2.57%), gold, silver and the gold miners were also sent to slaughter – as you’ve already read earlier today.
Please see below:
Figure 13
The bottom line?
As I’ve been warning, the PMs don’t operate in a vacuum. Thus, the bearish technicals and fundamentals aren’t the only variables that can tip them over the edge. Due to their moderate-to-strong correlations with U.S. equities (the S&P 500), an unwinding of the speculative excess will cascade across the precious’ metals market.
Moreover, despite receiving a shot in the arm after Janet Yellen urged lawmakers to “act big” on the next coronavirus relief package, as expected, the high has clearly worn off.
Figure 14
In conclusion, the PMs are likely to suffer a profound decline in the coming weeks. Gold continues to underperform relative to the recent decline of the USD Index. And after yesterday’s 0.50% rally in the USDX, combined with traders rejecting the upper trendline of gold’s November consolidation channel, gold is likely to break below its longer-term rising support line. However, once U.S. equities and the EUR/USD accurately reflect their fair values, gold will find a bottom and a buying opportunity will present itself.
Letters to the Editor
Q: I appreciate the thoroughness of your analyses, and the historical analogies. The one piece of data I wonder about is the slow stochastic graph of the GDX. It appears to be near the bottom of its range, just as it was in late November last year when it appeared gold and overall market prices were on the precipice. Instead, GDX and gold rallied, and the GDX stochastic graph went up to the upper end of its range. Could it be that we’re there again now, and another rally, to some degree, could be underway again for the next few weeks?
A: It’s true that the buy signal from the Stochastic (below 20) in the GDX heralded a rally in the GDX, but it seems that the situation really is different this time, and the Stochastic itself already confirms it. What I mean by that is the fresh sell signal that we just saw. This makes the current situation much more similar to what we saw in March 2020, where the additional sell signal was what preceded the biggest part of the decline.
The price moves are not as volatile now, and the decline in stocks seems to have only begun, so it seems more likely that we’re going to see the sizable middle part of the decline, but not yet its final inning.
Overview of the Upcoming Part of the Decline
I expect the initial bottom to form with gold falling to roughly $1,700, and I expect the GDX ETF to decline to about $31 - $32 at that time. I then plan to exit the short positions in the miners and I will consider long positions in the miners at that time – in order to benefit from the likely rebound.
I expect the above-mentioned decline to take another 1 – 6 weeks to materialize and I expect the rebound to take place during 1-3 weeks.
After the rebound (perhaps to $33 - $34 in the GDX), I plan to get back in with the short position in the mining stocks.
Then, after miners slide once again in a meaningful and volatile way, but silver doesn’t (and it just declines moderately), I plan to switch from short positions in miners to short positions in silver (this could take another 1-4 weeks to materialize). I plan to exit those positions when gold shows substantial strength relative to the USD Index, while the latter is still rallying. This might take place with gold close to $1,500 and the entire decline (from above $1,700 to about $1,500) would be likely to take place within 1-5 weeks and I would expect silver to fall hardest in the final part of the move. This moment (when gold performs very strongly against the rallying USD and miners are strong relative to gold – after gold has already declined substantially) is likely to be the best entry point for long-term investments in my view. This might happen with gold close to $1,500, but it’s too early to say with certainty at this time.
Consequently, the entire decline could take between 3 and 14 weeks, while the initial part of the decline (to $1,700 in gold) is likely to take between 1 and 6 weeks.
The above is based on the information available today and it might change in the following days/weeks.
Summary
To summarize, it might be the case that the next big short-term downswing has just begun as miners broke below the neck level of their almost-yearly head-and-shoulders formation. The outlook for the precious metals sector remains bearish.
The things are likely to be VERY INTERESTING on the stock market in the following days, weeks, and months, and besides having important implications for the precious metals sector, stock price moves might be very important (and perhaps lucrative) if one gets additional insight into this sector.
Consequently, we’re enabling a special promotion for Matthew Levy’s, CFA Stock Trading Alerts – the first three weeks are for just $9. The subscription then renews normally, unless cancelled, which effectively means that you get to access Matthew’s up-to-date thoughts on the market for next to nothing, and if you don’t like what you’re getting, you can simply cancel the subscription. There are quite many “specialists” out there, most of them self-proclaimed (the “Robinhood investors” etc.), so it’s important to make sure that the information that one is getting comes from a high-quality source.
Like your Editor (PR), Matthew is a CFA Charterholder, which means that he passed three rigorous exams (each one per year) demonstrating expertise in i.a. analysis, portfolio management & valuation, risk management and – most importantly – ethics. And it’s not just “theory” – far from it. As you can read in Matthew’s bio, he’s been managing and co-managing over $600MM in cumulative assets. Moreover, since he started publishing his analyses with us – which was on Nov. 30, 2020 – he’s made numerous good calls about the market. The great buy of the EWF ETF (Taiwan ETF) on Dec. 3 was one of them (at about $50, and it recently moved above $58). This promotion will only last a few days, so we encourage you to examine Matthew’s work at these preferred terms today.
As always, we'll keep you - our subscribers - informed.
To summarize:
Trading capital (supplementary part of the portfolio; our opinion): Full speculative short positions (300% of the full position) in mining stocks is justified from the risk to reward point of view with the following binding exit profit-take price levels:
Senior mining stocks (price levels for the GDX ETF): binding profit-take exit price: $32.02; stop-loss: none (the volatility is too big to justify a SL order in case of this particular trade); binding profit-take level for the DUST ETF: $28.73; stop-loss for the DUST ETF: none (the volatility is too big to justify a SL order in case of this particular trade)
Junior mining stocks (price levels for the GDXJ ETF): binding profit-take exit price: $42.72; stop-loss: none (the volatility is too big to justify a SL order in case of this particular trade); binding profit-take level for the JDST ETF: $21.22; stop-loss for the JDST ETF: none (the volatility is too big to justify a SL order in case of this particular trade)
For-your-information targets (our opinion; we continue to think that mining stocks are the preferred way of taking advantage of the upcoming price move, but if for whatever reason one wants / has to use silver or gold for this trade, we are providing the details anyway. In our view, silver has greater potential than gold does):
Silver futures downside profit-take exit price: unclear at this time - initially, it might be a good idea to exit, when gold moves to $1,703.
Gold futures downside profit-take exit price: $1,703
Long-term capital (core part of the portfolio; our opinion): No positions (in other words: cash
Insurance capital (core part of the portfolio; our opinion): Full position
Whether you already subscribed or not, we encourage you to find out how to make the most of our alerts and read our replies to the most common alert-and-gold-trading-related-questions.
Please note that we describe the situation for the day that the alert is posted in the trading section. In other words, if we are writing about a speculative position, it means that it is up-to-date on the day it was posted. We are also featuring the initial target prices to decide whether keeping a position on a given day is in tune with your approach (some moves are too small for medium-term traders, and some might appear too big for day-traders).
Additionally, you might want to read why our stop-loss orders are usually relatively far from the current price.
Please note that a full position doesn't mean using all of the capital for a given trade. You will find details on our thoughts on gold portfolio structuring in the Key Insights section on our website.
As a reminder - "initial target price" means exactly that - an "initial" one. It's not a price level at which we suggest closing positions. If this becomes the case (like it did in the previous trade), we will refer to these levels as levels of exit orders (exactly as we've done previously). Stop-loss levels, however, are naturally not "initial", but something that, in our opinion, might be entered as an order.
Since it is impossible to synchronize target prices and stop-loss levels for all the ETFs and ETNs with the main markets that we provide these levels for (gold, silver and mining stocks - the GDX ETF), the stop-loss levels and target prices for other ETNs and ETF (among other: UGL, GLL, AGQ, ZSL, NUGT, DUST, JNUG, JDST) are provided as supplementary, and not as "final". This means that if a stop-loss or a target level is reached for any of the "additional instruments" (GLL for instance), but not for the "main instrument" (gold in this case), we will view positions in both gold and GLL as still open and the stop-loss for GLL would have to be moved lower. On the other hand, if gold moves to a stop-loss level but GLL doesn't, then we will view both positions (in gold and GLL) as closed. In other words, since it's not possible to be 100% certain that each related instrument moves to a given level when the underlying instrument does, we can't provide levels that would be binding. The levels that we do provide are our best estimate of the levels that will correspond to the levels in the underlying assets, but it will be the underlying assets that one will need to focus on regarding the signs pointing to closing a given position or keeping it open. We might adjust the levels in the "additional instruments" without adjusting the levels in the "main instruments", which will simply mean that we have improved our estimation of these levels, not that we changed our outlook on the markets. We are already working on a tool that would update these levels daily for the most popular ETFs, ETNs and individual mining stocks.
Our preferred ways to invest in and to trade gold along with the reasoning can be found in the how to buy gold section. Furthermore, our preferred ETFs and ETNs can be found in our Gold & Silver ETF Ranking.
As a reminder, Gold & Silver Trading Alerts are posted before or on each trading day (we usually post them before the opening bell, but we don't promise doing that each day). If there's anything urgent, we will send you an additional small alert before posting the main one.
Thank you.
Przemyslaw Radomski, CFA
Founder, Editor-in-chief


