Briefly: in our opinion, full (300% of the regular position size) speculative short positions in junior mining stocks are justified from the risk/reward point of view at the moment of publishing this Alert.
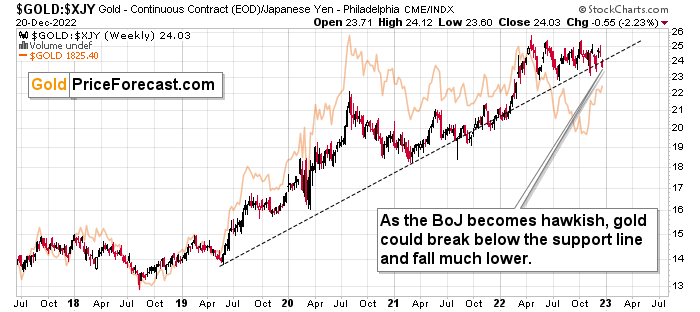
The gold price in the USD moved higher yesterday, but in terms of the yen, it collapsed. Which of the moves shows the real direction?
The one featuring the gold price in the Japanese yen.
As you can see on the above chart, it moved below the rising long-term support line once again, and each time it previously tried to break below it, it moved higher once again. However, this time is already different because of the fundamental shift in the Bank of Japan’s strategy. We will discuss it more thoroughly in the following part of today’s analysis, and for now, I would like to once again discuss why the action in the gold-USD Index link is currently different than what usually happens.
It might all seem complex until one focuses on what really drove the recent price movement.
It was not about what happened in the USA – it was about what happened in Japan.
It was not about the US currency’s weakness. It was about the strength of Japan’s currency.
Gold can be viewed as a currency, and in fact, it is priced as such. Gold’s value didn’t really increase yesterday – it was the fact that other exchange rates changed materially that impacted what we saw from the USD point of view.
So, once again, gold didn’t show relative strength to the U.S. dollar’s weakness because it wasn’t the U.S. dollar that was weak yesterday. It was the yen that was strong, and it made the currency exchange rate between the USD and yen move so much that it affected gold’s price in the USD.
It’s not a game-changer. It’s just a temporary price noise.
The above might be confusing, and indeed, many market participants are likely to react to the USD Index’s movement based on its face value. But that’s simply incorrect, and people are likely to come to their senses relatively soon (it’s not that complex, either).
If this is still perplexing, I’ll quote what I wrote about it yesterday:
It’s easier to understand the implication based on a counter-example. Remember when all the monetary authorities around the world were getting more and more dovish and they kept printing more and more money? That was bullish for gold, right?
Ok, so, now what we see is the opposite. The monetary authorities around the world are getting more and more hawkish, and the Bank of Japan appears to be finally joining the hawkish party, which is bearish for gold.
This remains true despite any short-term price movements caused by individual currency exchange rate changes. So, even if the yen continues to strengthen relative to the dollar for some time, gold might not be willing to react to it for much longer.
Why? Because in the short-term, markets are particularly emotional. “OMG, USDX fell, let’s buy gold!” can dominate traders’ way of feeling/thinking (on a side note, “feenking” could be a new verb to describe the situation when one thinks that they are thinking about something, but actually they are just rationalizing their feelings).
Then, as the traders have some time to think about what’s really happening, they could sell gold as it becomes less and less appealing, given that fiat money can (at least for now…) provide more interest payments.
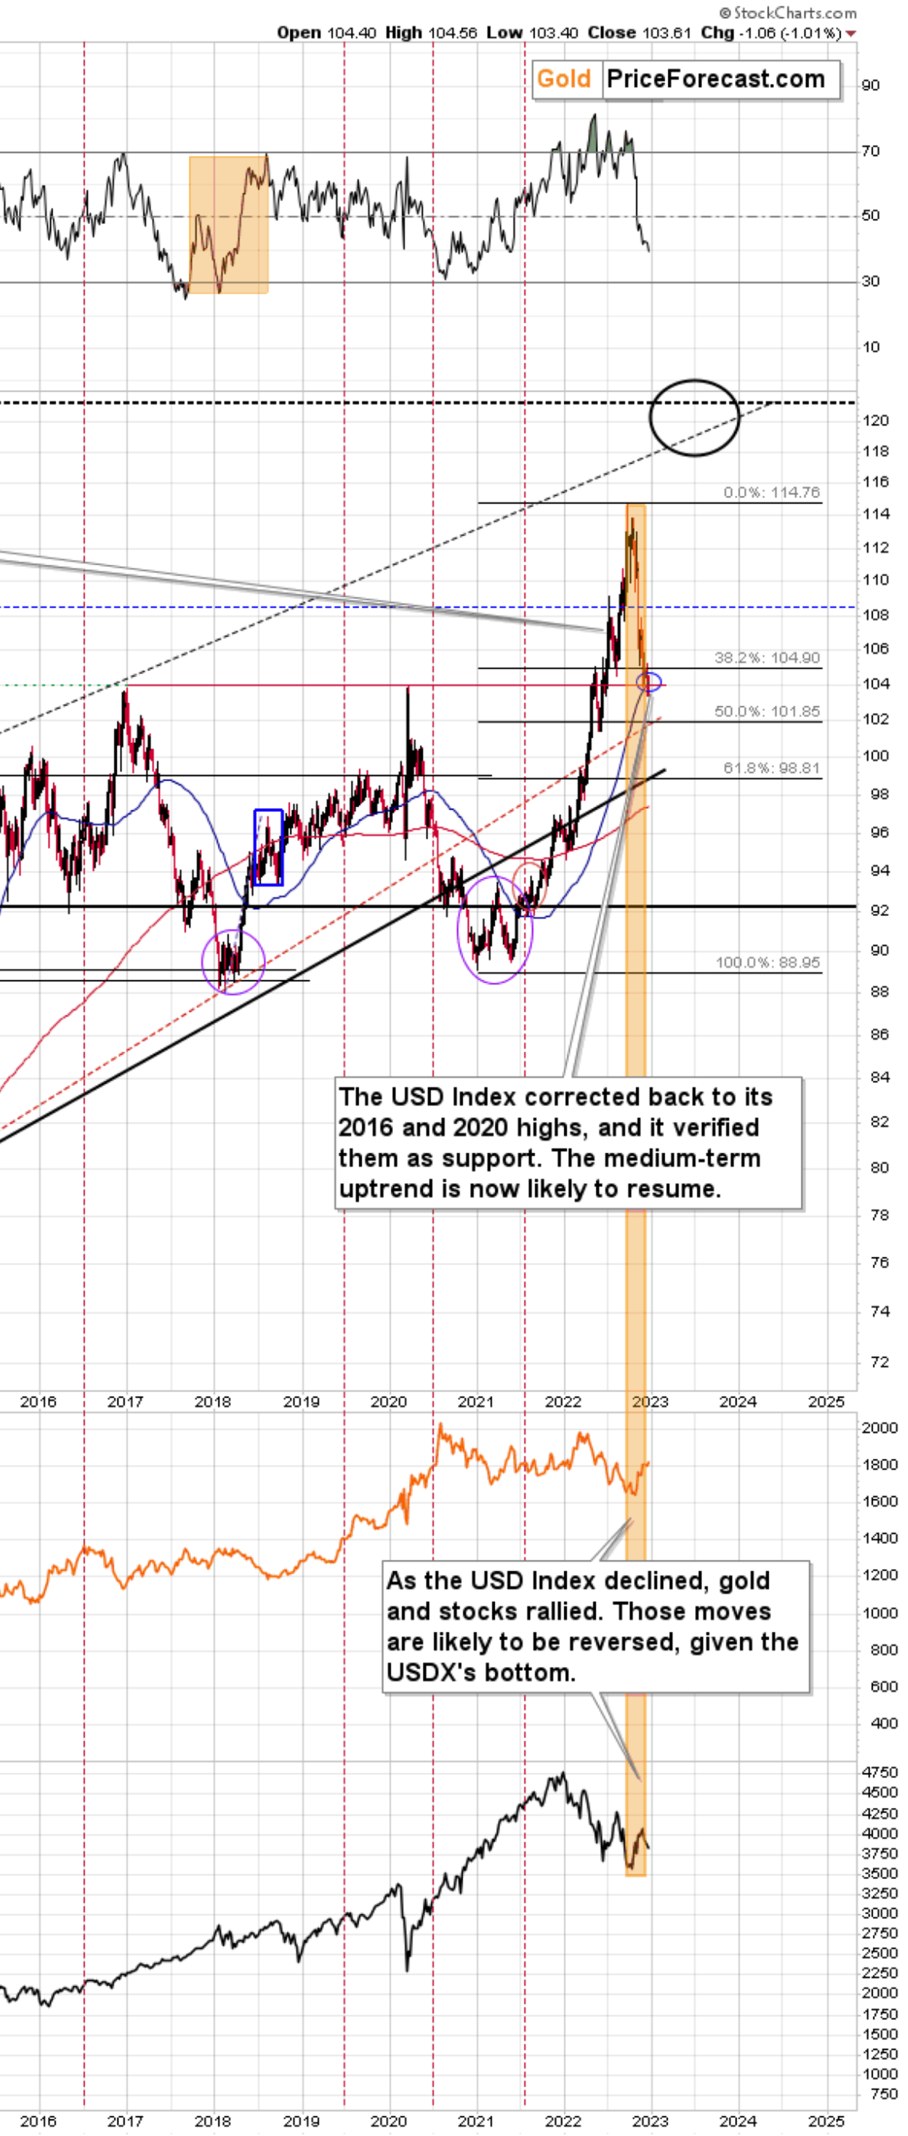
Actually, the USD Index might not be willing to decline more at this time, anyway. Why? Strong technical support.
As you may recall, the USD Index is trading close to its 2016 and 2020 highs. It’s not below the lower of those in terms of the daily closing prices, so it’s too early to be talking about a breakdown, let alone a confirmed one. Still, the proximity of those highs (also on an intraday basis) is likely to be enough to trigger a rebound and a rally soon.
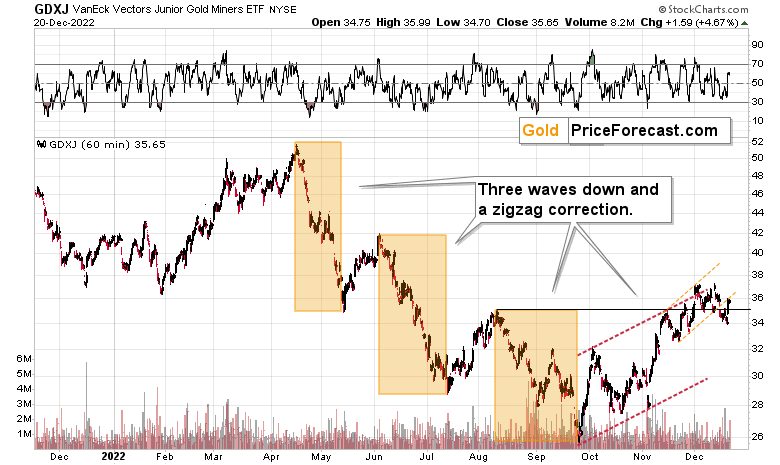
And while the USD Index is testing its recent lows, are junior mining stocks testing their recent highs?
No!
Junior miners (GDXJ ETF serves as proxy for them) corrected approximately half of their recent downswing.
It’s clear that gold miners don’t want to rally here. Their corrective Sep.-Dec. upswing is most likely over, and thus they are now likely to react weakly to factors that would make them rally (like weaker USD Index values) and strongly to factors that would make them decline (like stronger USD Index values, or weaker stock market valuations).
Technically, please note that the GDXJ moved below its accelerating trend channel (marked with orange lines), and it’s now simply verifying this breakdown.
So, all in all, the precious metals market is likely to move lower in the following weeks, as the dust around the recent Bank of Japan’s action settles.
= = = = =
Before summarizing the technical part, I would like to let you (my subscribers) know that I’ll be providing the same presentation that I provided to you last week (the one on the top three gold trading techniques) on our social media channels. You already saw it, and there’s a long recording of the presentation (along with the quite long Q&A and market analysis).
However, if you’d like to see it again (this time, I’m determined to present it in 30-40 minutes, followed by 5-15 minutes of Q&A and then live market coverage), please feel free to do so.
It will take place today, Dec. 21, at 10 AM EST (4 PM CET) on our Youtube, Facebook, Twitter, and LinkedIn channels.
While the presentation about the top 3 trading techniques and some Q&A will take place on social media, there will also be a second part, when I’m going to do the live market analysis. This second part will take place on Golden Meadow. This will be a free (promotional) event to get more people aboard, so there will be some selling during this event. However, the market analysis will also be done. So, it’s up to you if you’d like to participate.
Also, tomorrow’s analysis is scheduled to include a video analysis, and it will definitely be posted before the live event. Consequently, you will already be informed about my take on the market on that day, and the odds are that everything that you read/see earlier will remain up-to-date while the live event is taking place.
So, this time, I’m not sending “invitations” to the event to all my subscribers, as it seems that it would just be doubling the information that you will already get beforehand and without the sales texts.
However, if you’d like to participate in any or all of the above, you are – of course – very welcome to do so. I already included links to our social media channels above, and as far as the live market coverage is concerned, it’s going to take place here.
I’m scheduling the second part (live market analysis on Golden Meadow) of the event at 11 AM EST (5 PM CET), and as long as there are no technical problems along the way, I expect this second part of the event to start on time and to take 30-40 minutes. Here’s the link to both events, where you can make your selection.
= = = = =
To summarize, despite this week’s upswing in gold and silver (and a much smaller one in mining stocks), the outlook for the following weeks doesn’t look bullish at all. Conversely, as monetary authorities around the world get more hawkish, gold, silver, and mining stocks are likely to move lower.
Having said that, let’s take a look at the market from a more fundamental point of view.
A Hawkish BOJ Sparks a Dovish Bid for Gold
After the Bank of Japan (BOJ) announced an increase to the upper limit of its 10-year interest rate from 0.25% to 0.50% on Dec. 19, Asian stock markets sold off and U.S. equity futures retreated. Moreover, Japanese government bonds tumbled, and a panic bid for the yen sent the USD/JPY into a tailspin.
Yet, the market-moving event ended with equities recovering their losses, while gold, silver and mining stocks rallied sharply. However, investors’ misinterpretation of the policy shift should elicit sharp reversals over the medium term.
For starters, widening the BOJ’s interest rate band is hawkish and only exacerbates the global liquidity drain. Remember, the short-term gold bulls are only focused on the first derivative, which assumes ‘USD Index down, PMs up.’ But, tighter monetary policy is profoundly bearish, and like we’ve mentioned, if QE is bullish, then what it QT?
Second, higher interest rates reduce the fundamental attractiveness of the PMs. Gold, silver and mining stocks are non-yielding assets, and bonds offer higher relative returns when rates rise. Therefore, the PMs’ daily sprint was all about momentum and not the fundamentals.
Third, investors underestimate the degree to which policy actions cascade across markets.
Please see below:
To explain, the red line above tracks the 15-minute movement of the 10-Year Japanese Government Bond (JGB) yield, while the green line above tracks the 15-minute movement of the U.S. 10-Year Treasury yield (10Y).
If you analyze the vertical gray line in the middle of the chart, you can see that the BOJ's monetary policy release sparked a sharp sell-off of the 10-year JGB and the yield soared. Likewise, with the 10Y following suit, American interest rates also rose materially.
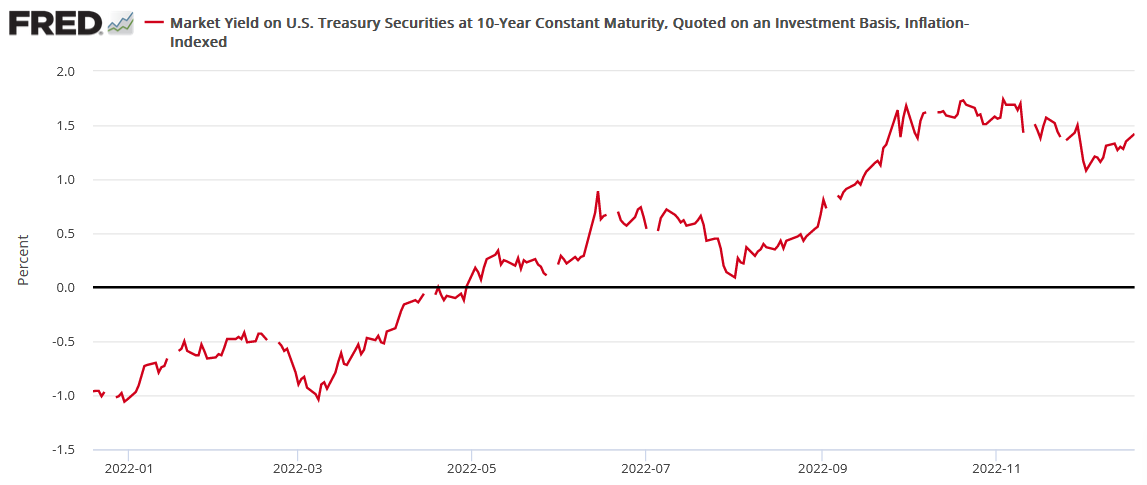
More importantly, the U.S. 10-Year real yield jumped by three basis points on Dec. 20 to settle at 1.45%; and please remember, the metric was at 1.08% on Dec. 2, it's risen by 37 basis points in 18 days, and the development significantly reduces the appeal of risk assets. So, while the momentum investors don't care, the reality is that rising real yields should jolt investors in the weeks and months ahead.
Please see below:
To that point, while we remain short the GDXJ ETF and are more concerned about its movement, the resurgence of the U.S. 10-Year real yield is a highly ominous development.
Please see below:
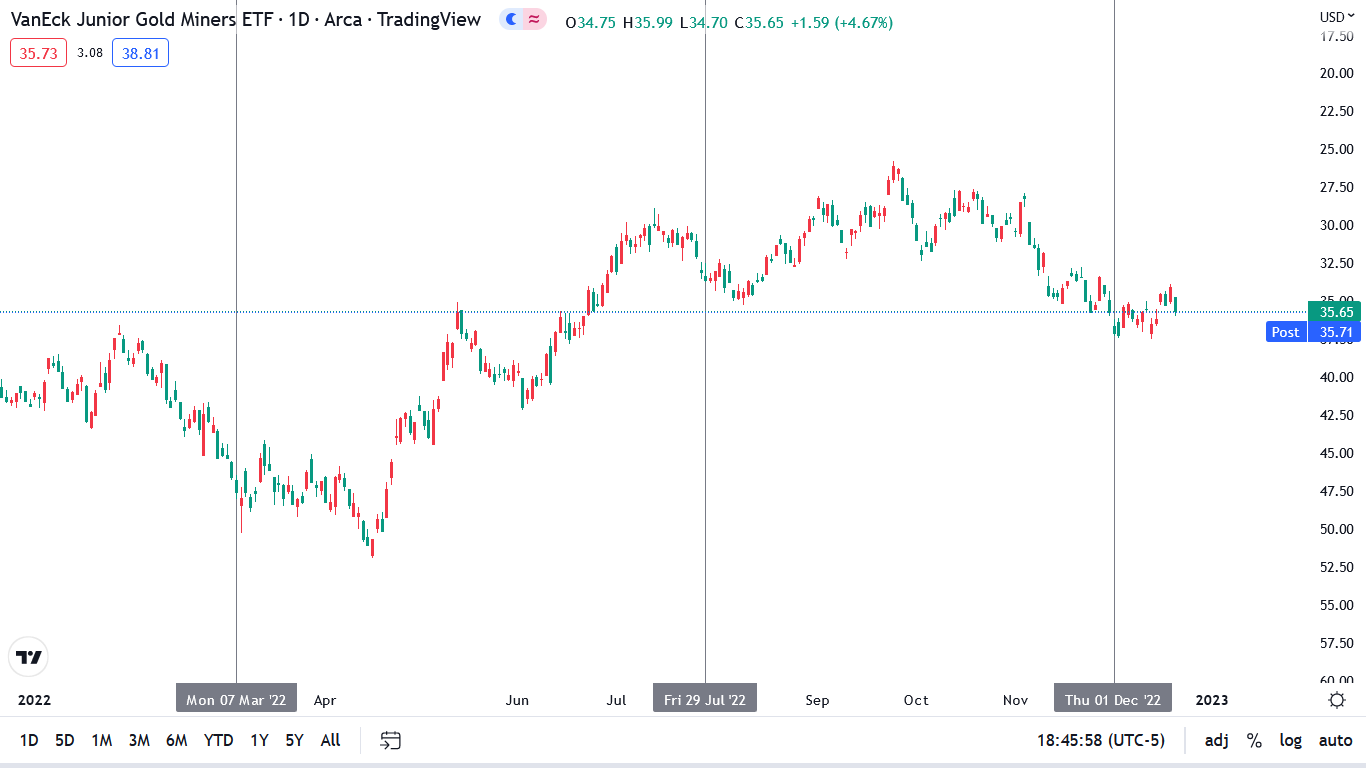
To explain, the candlesticks above track the daily movement of the GDXJ ETF over the last 12 months. For context, we inverted the scale to highlight the symmetry of the negative correlation between the junior miners' index and the U.S. 10-Year real yield. Therefore, upward movement represents lower prices, while downward movement represents higher prices.
The three vertical gray lines also depict the day before the U.S. 10-Year real yield hit notable bottoms over the last 12 months. If you analyze the first instance on the left, you can see that the GDXJ ETF hit an intraday high of $50.29 on Mar. 8, which was only slightly below its Russia-Ukraine-war-induced final intraday high of $51.92 on Apr. 19. Thereafter, a major decline occurred, and the GDXJ ETF lost nearly half of its value.
During the next iteration, the GDXJ ETF recorded an intraday high of $33.83 on Aug. 1, which, again, was only slightly below its final intraday high of $35.26 on Aug. 10. Thereafter, the GDXJ ETF sunk to another 2022 low, falling below $26.
Thus, the third iteration shows that the GDXJ ETF hit an intraday high of $37.42 on Dec. 2, which is only pennies below its current intraday high of $37.48 set on Dec. 13.
As it stands, the important point is that the GDXJ ETF is materially overvalued relative to the U.S. 10-Year real yield; and with the metric inching toward its 2022 highs, the junior miners' index should be inching toward its 2022 lows.
Yet, the high-low dates above demonstrate how the PMs' reaction to the movement of real interest rates isn't instantaneous. In contrast, it takes time for market participants to digest the change. But, when the 'uh oh' moment arrives, sentiment shifts dramatically and the PMs plunge.
Furthermore, please remember that higher real interest rates are required to curb inflation; and while we've been warning for many months that the consensus underestimated (and still does) the measures required to normalize the pricing pressures, a higher U.S. federal funds rate (FFR) and a potential recession are bearish for the GDXJ ETF.
Please see below:
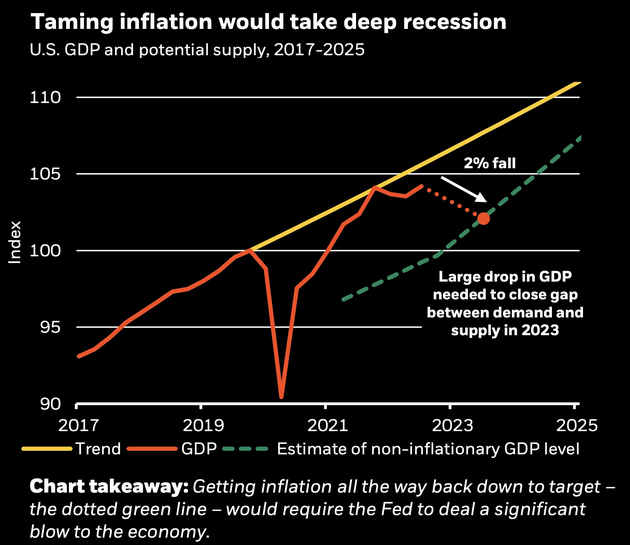
To explain, BlackRock – the largest asset manager in the world – told clients that a “deep recession” is necessary to normalize inflation. If you analyze the intersecting orange and yellow lines above, you can see that trend GDP growth does not support 2% inflation.
Conversely, the dashed green line on the right side represents the demand destruction required to solve the Fed’s inflation conundrum. Consequently, BlackRock’s team wrote:
“Central bankers won't ride to the rescue when growth slows in this new regime, contrary to what investors have come to expect. Equity valuations don't yet reflect the damage ahead.”
So, while the GDXJ ETF and the gold price party like it's the summer of 2020, the fundamentals are profoundly bearish. Likewise, while the greenback's decline distracts them from these ominous developments, a higher FFR and U.S. real yields are bullish for the USD Index.
As such, while the price action suggests otherwise, the crowd is offside once again, and it's likely only a matter of time before they realize their mistake.
Silver Celebrates for All the Wrong Reasons
While silver rallies like QE awaits in 2023, the fundamental backdrop couldn’t be more different. For example, despite misreading inflation throughout 2021 and 2022, the consensus still believes a painless path to 2% will emerge in 2023.
However, with nine of the last 10 bouts of inflation since 1948 ending with recessions, market participants are uninformed about the challenges that lie ahead. For context, we wrote on Dec. 13 :
The crowd's misunderstanding of inflation has them assuming the pricing pressures will ease with little economic damage. But, history contrasts this sentiment, and one can argue that the pandemic-induced imbalances make this bout even worse. As such, pain should confront the believers when reality returns.
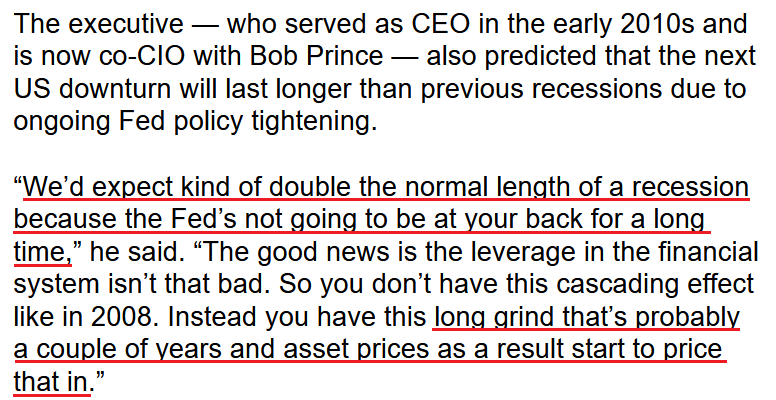
To that point, Bridgewater Associates’ Co-CIO Greg Jensen – who helps manage the world’s largest hedge fund – said on Dec. 15:
“There’s a lot of talk about recession, but very little recession priced in. You’re going to see relatively large moves as you shift from a world that’s fully focused on the Fed to one that’s focused on the recession and dollar squeeze that we see coming into the next year.”
Furthermore, while the consensus assumes that the end of China’s zero-COVID policy will uplift North American and European economies, Jensen noted that demand for cyclical commodities should worsen their inflation issues. He added:
“It’s been such a disinflationary force into a global inflation. China opening and the effect that’s going to have on commodity prices, in competing for raw materials in the world, while the US and Europe are entering recession, will probably make the central banking dilemma worse.”
As a result, while risk assets are priced for a mild deceleration in real GDP growth, the harsh realities of curbing unanchored inflation should result in a substantial sentiment shift in 2023.
Please see below:
To that point, while the crowd has swung and missed at three dovish pivot predictions in 2022, their misreading of inflation and the U.S. labor market highlights why peak FFR predictions kept accelerating. In contrast, the fundamentals have remained consistent with our expectations. We wrote on Aug. 1:
While the consensus assumes the Fed is near the end of its rate hike cycle, the Consumer Price Index (CPI) is on the fast track to 2% and a 3% FFR will be enough to capsize inflation, market participants are living in fantasy land.
For example, demand is much stronger than the consensus realizes. With Americans’ checking account balances at unprecedented all-time highs and the Atlanta Fed’s wage growth tracker hitting an all-time high in June, the FFR needs to go meaningfully above 3%. To explain, we wrote on Jul. 25:
With more earnings calls showcasing how the situation continues to worsen, market participants don’t realize that the U.S. federal funds rate needs to hit ~4.5% or more for the Fed to materially reduce inflation. For context, the consensus expects a figure in the 2.5% to 3.5% range.
So, while the prediction proved prescient, the crowd now assumes that instead of 2.5% to 3.5%, a ~5% FFR is the end of the hawkish road. However, the fundamentals do not support their dovish optimism.
Bank of America’s Chief Investment Strategist Michael Hartnett wrote on Dec. 16:
“Quicker labor markets break, quicker end to bear market, start new Wall St bull market.”
Thus, while he has a way with words, he’s been extremely accurate throughout this inflation cycle; and while we warned repeatedly that bear markets don’t end with the U.S. unemployment rate (UR) near a 50-year low, Hartnett noted that the average UR is 6.2% during that span, which is well above the current reading of 3.7%.
As a result, the Fed needs to “break” the U.S. labor market to break wage and output inflation, and we’re nowhere near that level of demand destruction.
Please see below:
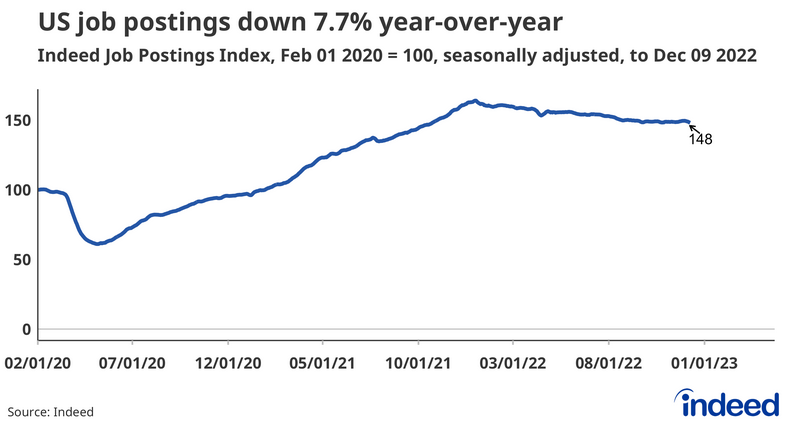
To explain, Indeed updated its job postings data on Dec. 15. For context, it rebranded the metric as the “Indeed Job Postings Index,” and noted that the main difference is the scale, meaning “if the Job Postings Tracker were 40%, the corresponding Indeed Job Postings Index on the same date would be 140.”
Therefore, with the current index value at 148, U.S. job postings on Indeed are still 48% above their pre-pandemic level. Likewise, please focus your attention on the slope of the blue line. Despite 17 25 basis point rate hikes in 2022, the blue line has only declined marginally from its January peak. As it stands, the Fed has not broken the U.S. labor market, and a much higher FFR is needed to normalize inflation.
Moreover, while the S&P 500 may find short-term support amid bullish seasonality, the crowds’ optimism for a soft landing contrasts the harsh historical realities. Furthermore, with outsized market imbalances built up due to the unprecedented stimulus enacted in 2020, a material decline in GDP growth is required to offset that sugar high. In contrast, these issues are far from priced in, and a realization is profoundly bearish for the silver price.
The Bottom Line
Investors shook off the BOJ’s hawkish shift, and a lack of major downside catalysts keeps risk assets uplifted in the short term. Yet, that optimism should wane as investors confront more disappointing economic realities in 2023. Remember, we warned at the end of 2021 that the fundamentals were bearish for risk assets. We wrote on Dec. 23, 2021:
Please note that when the Fed called inflation “transitory,” we wrote for months that officials were misreading the data. As a result, we don’t have a horse in this race. However, now, they likely have it right. Thus, if investors assume that the Fed won’t tighten, their bets will likely go bust in 2022.
Consequently, little has changed. Outside of lower commodity prices and slumping housing activity, the Fed has made little progress in reducing labor demand in 2022. As such, more bullish bets should go bust in 2023.
In conclusion, the PMs rallied on Dec. 20, as the BOJ helped suppress the USD Index. But, the U.S. 10-Year real yield rose, and the metric has quietly soared in December. So, while the GDXJ ETF often reacts with a delay, we shouldn’t have to wait very long for the next drawdown to begin.
Overview of the Upcoming Part of the Decline
- It seems to me that the corrective upswing is over (or about to be over) and that the next big move lower is already underway (or that it’s about to start).
- If we see a situation where miners slide in a meaningful and volatile way while silver doesn’t (it just declines moderately), I plan to – once again – switch from short positions in miners to short positions in silver. At this time, it’s too early to say at what price levels this could take place and if we get this kind of opportunity at all – perhaps with gold prices close to $1,500 - $1,550.
- I plan to switch from the short positions in junior mining stocks or silver (whichever I’ll have at that moment) to long positions in junior mining stocks when gold / mining stocks move to their 2020 lows (approximately). While I’m probably not going to write about it at this stage yet, this is when some investors might consider getting back in with their long-term investing capital (or perhaps 1/3 or 1/2 thereof).
- I plan to return to short positions in junior mining stocks after a rebound – and the rebound could take gold from about $1,450 to about $1,550, and it could take the GDXJ from about $20 to about $24. In other words, I’m currently planning to go long when GDXJ is close to $20 (which might take place when gold is close to $1,450), and I’m planning to exit this long position and re-enter the short position once we see a corrective rally to $24 in the GDXJ (which might take place when gold is close to $1,550).
- I plan to exit all remaining short positions once gold shows substantial strength relative to the USD Index while the latter is still rallying. This may be the case with gold prices close to $1,400 and GDXJ close to $15 . This moment (when gold performs very strongly against the rallying USD and miners are strong relative to gold after its substantial decline) is likely to be the best entry point for long-term investments, in my view. This can also happen with gold close to $1,400, but at the moment it’s too early to say with certainty.
- The above is based on the information available today, and it might change in the following days/weeks.
You will find my general overview of the outlook for gold on the chart below:
Please note that the above timing details are relatively broad and “for general overview only” – so that you know more or less what I think and how volatile I think the moves are likely to be – on an approximate basis. These time targets are not binding nor clear enough for me to think that they should be used for purchasing options, warrants, or similar instruments.
Letters to the Editor
We received a few messages over e-mail, but as we are moving to our new platform, we will be transferring them below the articles as comments – and that’s where we’ll be replying to them.
Asking your questions below the articles or in the spaces called “Ask the Community” or “Position Sizes” directly will help us deliver a reply sooner. In some cases, someone from the community might reply and help even before we do.
Please remember about the Pillars of our Community, especially about the Kindness of Speech Pillar.
Also, if there’s anything that you want to complain about, it’s best to send us a message at [email protected].
Please note that this section is going to go away within the next 1-8 weeks, as you can add comments/questions below the article on Golden Meadow – the platform that we’re using to provide our analyses. Your notification e-mails include an invitation link that allows you to access the “Gold Trading Alerts” space.
Also, if you haven’t had the chance to see the video, in which I’m talking about the new platform and why we essentially moved from Sunshine Profits to Golden Meadow, I strongly encourage you to do so:
Summary
Summing up, it seems that the major bottom in the USD Index is in, while the correction in stocks, gold, silver, and mining stocks is over.
The nature of the recent corrections was mostly technical and rumor-based. The rumor was that the Fed would be making a dovish U-turn soon, and it recently became clear that this was not going to be the case. Consequently, the corrective upswing is likely to be reversed, and medium-term downtrends are likely to resume.
In my opinion, the current trading position is going to become profitable in the following weeks, and quite possibly in the following days. And while I can’t promise any kind of performance, I fully expect it to become very profitable before it’s over and to prolong our 2022 winning streak.
After the final sell-off (that takes gold to about $1,350-$1,500), I expect the precious metals to rally significantly. The final part of the decline might take as little as 1-5 weeks, so it's important to stay alert to any changes.
As always, we'll keep you – our subscribers – informed.
To summarize:
Trading capital (supplementary part of the portfolio; our opinion): Full speculative short positions (300% of the full position) in junior mining stocks are justified from the risk to reward point of view with the following binding exit profit-take price levels:
Mining stocks (price levels for the GDXJ ETF): binding profit-take exit price: $20.32; stop-loss: none (the volatility is too big to justify a stop-loss order in case of this particular trade)
Alternatively, if one seeks leverage, we’re providing the binding profit-take levels for the JDST (2x leveraged). The binding profit-take level for the JDST: $22.87; stop-loss for the JDST: none (the volatility is too big to justify a SL order in case of this particular trade).
For-your-information targets (our opinion; we continue to think that mining stocks are the preferred way of taking advantage of the upcoming price move, but if for whatever reason one wants / has to use silver or gold for this trade, we are providing the details anyway.):
Silver futures downside profit-take exit price: $14.32
SLV profit-take exit price: $13.42
ZSL profit-take exit price: $48.87
Gold futures downside profit-take exit price: $1,504
HGD.TO – alternative (Canadian) 2x inverse leveraged gold stocks ETF – the upside profit-take exit price: $16.47
HZD.TO – alternative (Canadian) 2x inverse leveraged silver ETF – the upside profit-take exit price: $36.87
Long-term capital (core part of the portfolio; our opinion): No positions (in other words: cash)
Insurance capital (core part of the portfolio; our opinion): Full position
Whether you’ve already subscribed or not, we encourage you to find out how to make the most of our alerts and read our replies to the most common alert-and-gold-trading-related-questions.
Please note that we describe the situation for the day that the alert is posted in the trading section. In other words, if we are writing about a speculative position, it means that it is up-to-date on the day it was posted. We are also featuring the initial target prices to decide whether keeping a position on a given day is in tune with your approach (some moves are too small for medium-term traders, and some might appear too big for day-traders).
Additionally, you might want to read why our stop-loss orders are usually relatively far from the current price.
Please note that a full position doesn't mean using all of the capital for a given trade. You will find details on our thoughts on gold portfolio structuring in the Key Insights section on our website.
As a reminder - "initial target price" means exactly that - an "initial" one. It's not a price level at which we suggest closing positions. If this becomes the case (as it did in the previous trade), we will refer to these levels as levels of exit orders (exactly as we've done previously). Stop-loss levels, however, are naturally not "initial", but something that, in our opinion, might be entered as an order.
Since it is impossible to synchronize target prices and stop-loss levels for all the ETFs and ETNs with the main markets that we provide these levels for (gold, silver and mining stocks - the GDX ETF), the stop-loss levels and target prices for other ETNs and ETF (among other: UGL, GLL, AGQ, ZSL, NUGT, DUST, JNUG, JDST) are provided as supplementary, and not as "final". This means that if a stop-loss or a target level is reached for any of the "additional instruments" (GLL for instance), but not for the "main instrument" (gold in this case), we will view positions in both gold and GLL as still open and the stop-loss for GLL would have to be moved lower. On the other hand, if gold moves to a stop-loss level but GLL doesn't, then we will view both positions (in gold and GLL) as closed. In other words, since it's not possible to be 100% certain that each related instrument moves to a given level when the underlying instrument does, we can't provide levels that would be binding. The levels that we do provide are our best estimate of the levels that will correspond to the levels in the underlying assets, but it will be the underlying assets that one will need to focus on regarding the signs pointing to closing a given position or keeping it open. We might adjust the levels in the "additional instruments" without adjusting the levels in the "main instruments", which will simply mean that we have improved our estimation of these levels, not that we changed our outlook on the markets. We are already working on a tool that would update these levels daily for the most popular ETFs, ETNs and individual mining stocks.
Our preferred ways to invest in and to trade gold along with the reasoning can be found in the how to buy gold section. Furthermore, our preferred ETFs and ETNs can be found in our Gold & Silver ETF Ranking.
As a reminder, Gold & Silver Trading Alerts are posted before or on each trading day (we usually post them before the opening bell, but we don't promise doing that each day). If there's anything urgent, we will send you an additional small alert before posting the main one.
Thank you.
Przemyslaw K. Radomski, CFA
Founder, Editor-in-chief


