Briefly: in our opinion, full (250% of the regular position size) speculative short positions in mining stocks are justified from the risk/reward point of view at the moment of publishing this Alert.
Today's Gold & Silver Trading Alert will be mostly technical, but we will still start with one fundamental news. The news is that the US Covid-19 death toll just increased by about 5,000 people (yesterday, we reported about 26k US deaths and it's about 31k today). That's a dramatic increase, and it's likely linked to the fact that the CDC-compiled death toll statistics will now include "probable" cases, not only those that were confirmed by the tests. This is still not enough to measure the true impact of the virus, as for instance many people can't get medical care for other diseases because the healthcare workers are too overwhelmed dealing with Covid-19 patients, many people are dying in their homes without ever being tested and so on. The true impact could be measured by comparing the total deaths in a given week and comparing it to the usual death toll in the past years during the same time in a year.
The above-linked article is quite informative, as it also shows that there are public protests (without proper safety equipment) of people who are fed up with the lockdown. And it's still a long way before the lockdown can be fully (!) lifted... So much for the optimistic assumption of healthcare.org's prediction of the total US death toll being below 100k - the assumption was that people obey the lockdown.
Note: we're not saying whether or not keeping the (national or not) lockdown is the best way to deal with the situation. There are arguments for both sides, and also for the middle ground (where only the particularly vulnerable people would have to self-quarantine). People will probably argue about the best course of action for decades. It is not our responsibility to know that. It is, however, our responsibility, to estimate the likely way in which the situation is going to develop based on the up-to-date data, how the markets are going to respond, and how to make profits on the upcoming price moves in the precious metals sector. Additionally, we might indicate what we think is a good idea as far as prevention is concerned, and based on our research, supplementation with zinc and elderberry seems like a good idea (we're no doctors, though, so that's just an opinion, not a recommendation, and it should be consulted with a doctor).
The bottom line is that the economic implications are likely to be much worse than many (most?) people predict them to be right now. Which is a good fundamental reason for another wave down in the general stock market and another move up in the USD Index.
Having said that, let's turn to charts. In short, they all indicated - in one way or another - that the corrective moves have ended.
Let's start with the USD Index.
The USDX Moves
We'll open up with a quote from yesterday's Alert (by the way, please remember that all charts are expandable/clickable):
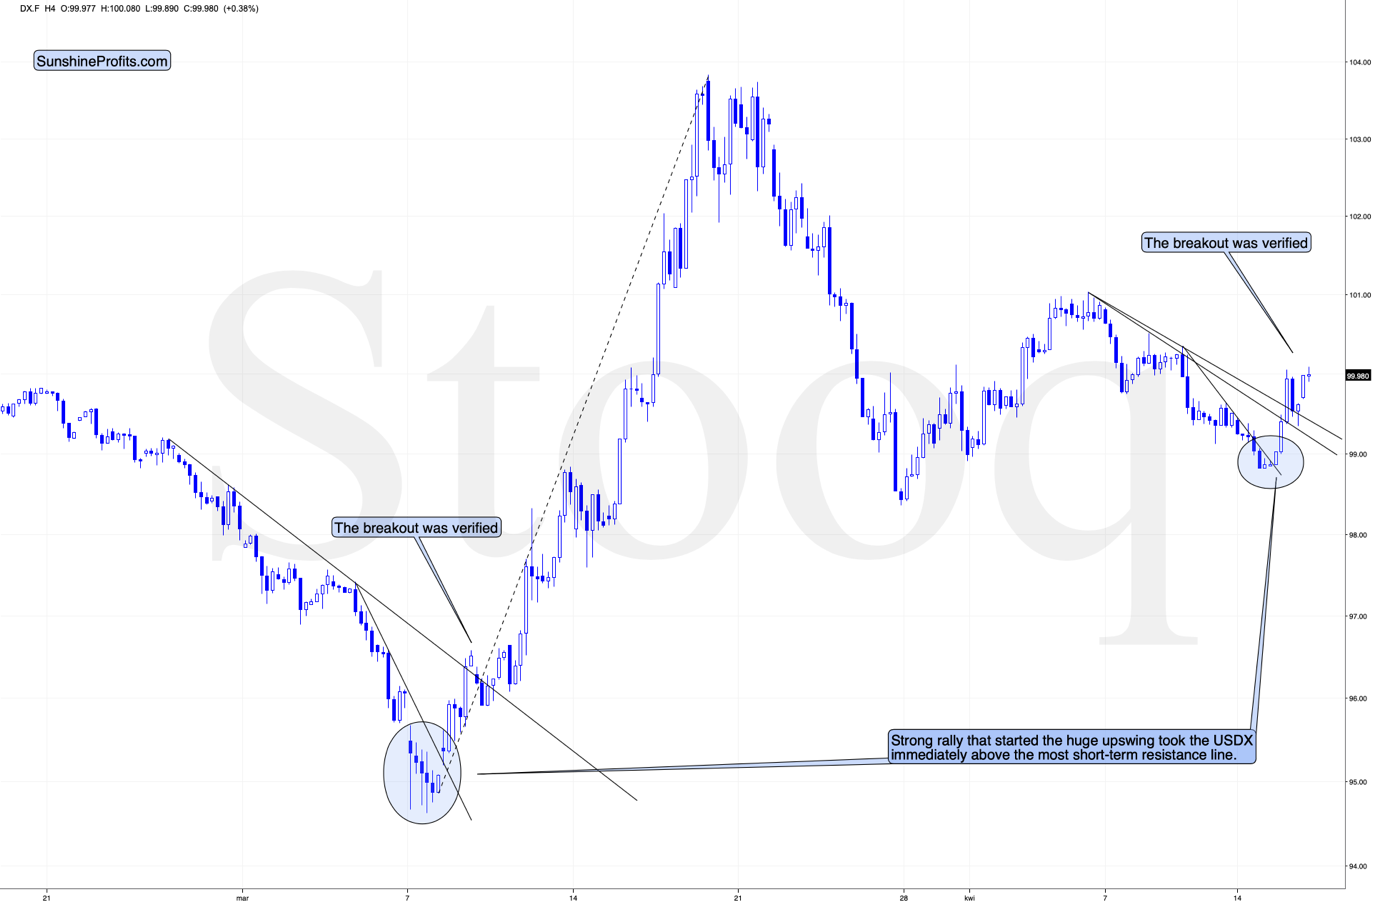
Looking at the 4-hour candlestick chart, we see that the USD Index just formed a reversal and is now testing the previous lows. There were very few 4-hour reversals in the recent days, but when we saw them, big and fast rallies followed. The early-March bottom is particularly similar to the current situation as the USD Index is - just like back then - after a visible decline, and the 4h reversal was followed by a re-test of the intraday low.
What happened next?
The USD Index moved below the intraday low of the reversal and then soared back up - exactly as it did in early March. And just like what it did back then, the USDX rallied immediately after the bottom and it did so in a sharp manner, especially right after breaking above the most short-term declining resistance line.
At the same time, the USD Index invalidated the small breakdown below the April 1st low.
Once the USD Index soars above the upper declining resistance line (currently at about 99.6) it will be relatively clear that the short-term bottom is already in and another big upswing has just begun.
That line will be the final short-term confirmation, though. The most important line is the one that the USX is testing right now. It's the one based on the April 6th and April 8th tops. Once the USDX breaks above it, the short-term odds will be on the bulls' side and it will be clearly visible for many traders, not only for those who pay attention to the price pattern analogies and are able to detect the bottoms earlier (such as us). It could be the case that when you read this, the breakout above this line is already confirmed.
And what happened in the following hours?
The USD Index has indeed broken above all declining resistance lines. And it gets better - the USDX didn't just break below those lines. It then pulled back, verified the previous resistance lines as support and then moved higher once again. That's the perfect breakout, which makes the outlook clearly bullish, and very similar to what happened around March 10.
The implications for the precious metals market are very bearish.
What about the general stock market?
S&P 500 Speaks
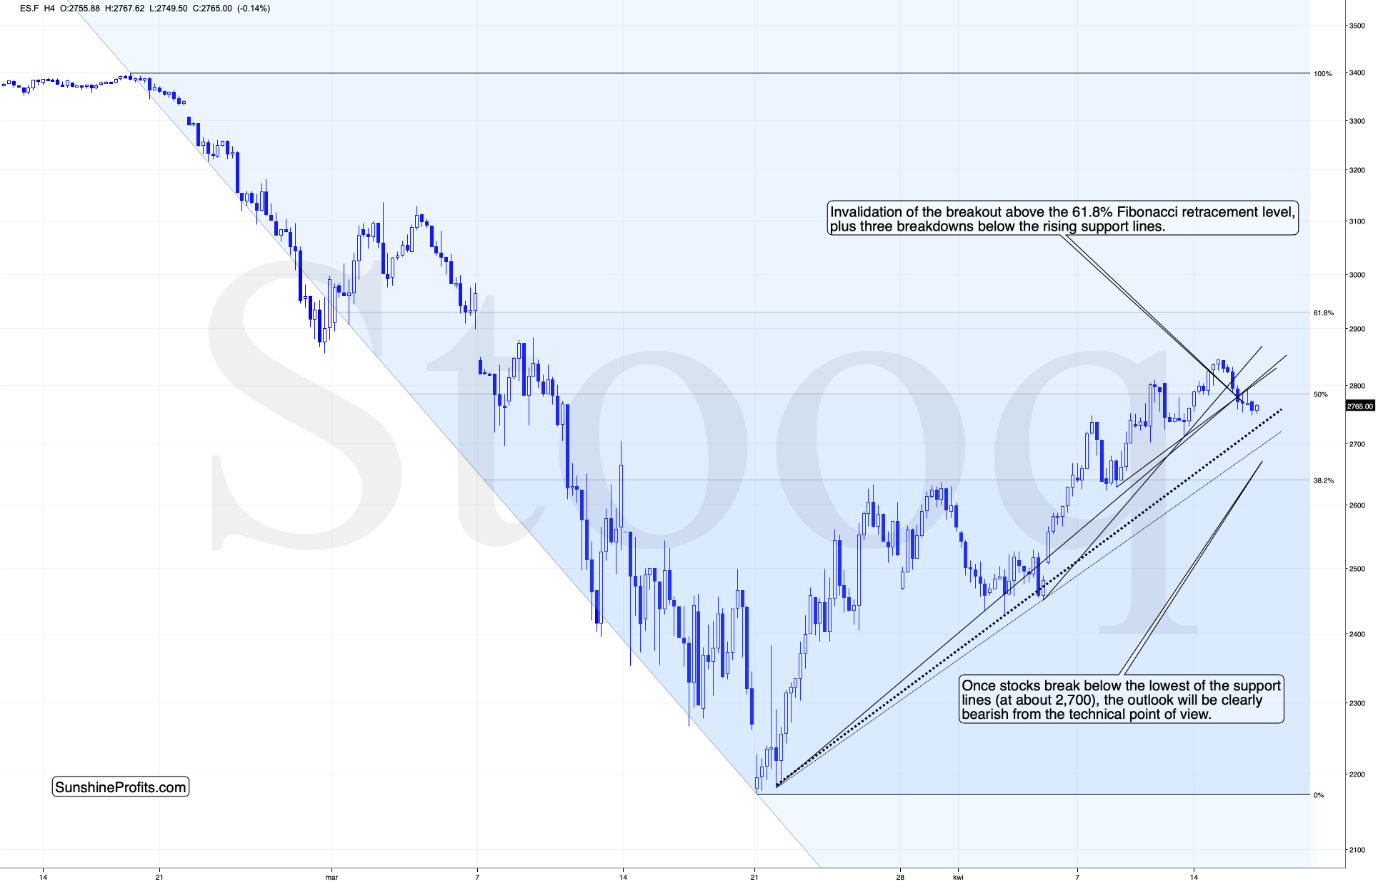
The S&P 500 futures invalidated their small breakout above the 61.8% Fibonacci retracement level, and they broke below three rising support lines. This is a very bearish combination.
There are two other rising support lines that were not broken yet, but it seems that the momentum that's likely to be generated based on the above-mentioned breakdowns, will be enough to get stocks to move to these final two rising support lines. Once we see breakdowns below these lines, the decline is likely co accelerate. The next short-term stop could be at the early April lows - a bit below 2,500.
Declining stocks and - most importantly - rising USD Index, are likely to trigger weakness in gold, silver, and miners.
Let's start with silver, as it's providing us with the clearest indication (we'll analyze gold last, as its chart is the most complex one).
It's PMs' Time Now
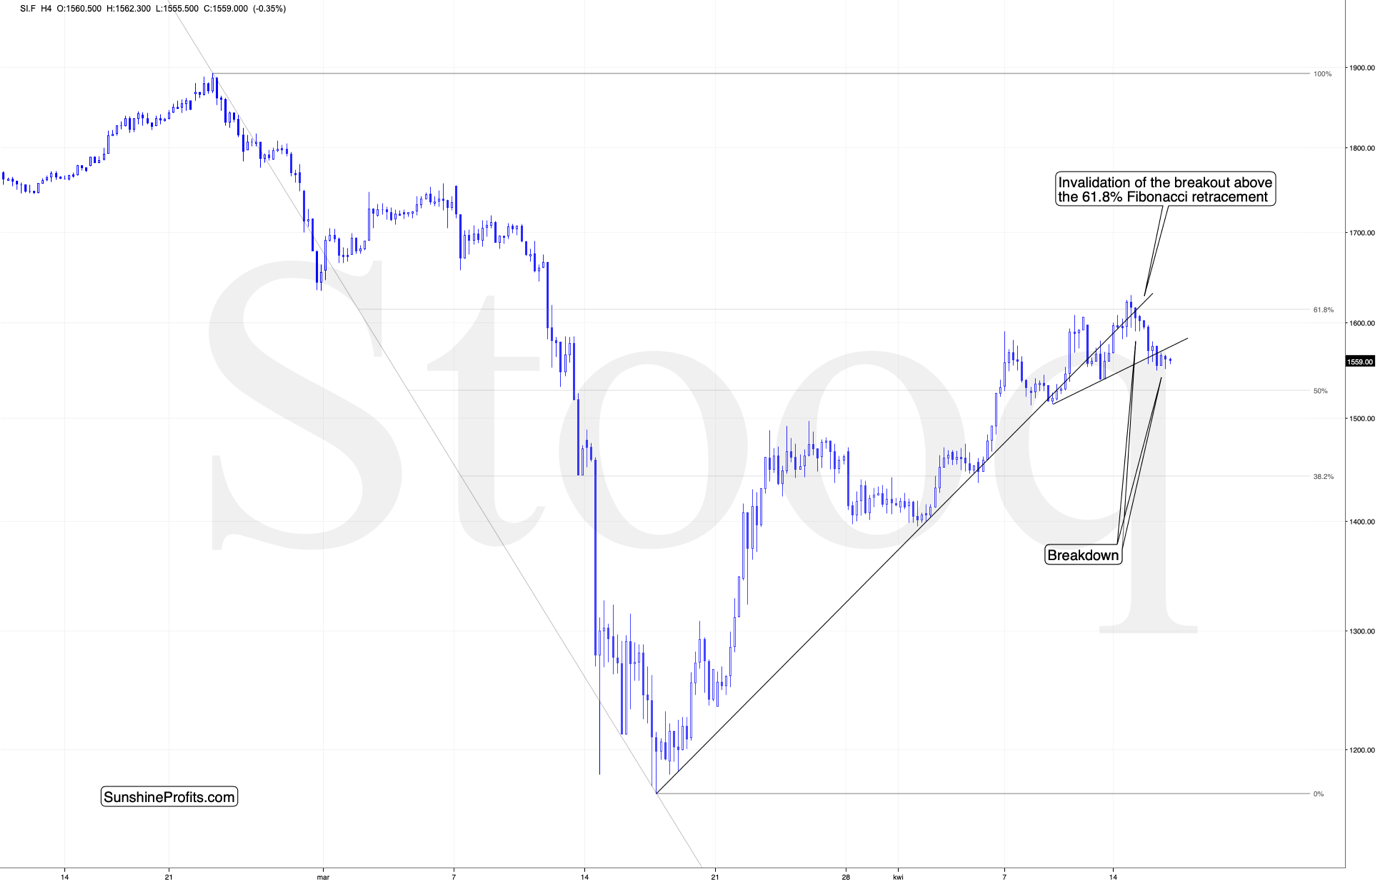
The most important detail is that the white metal broke below the rising support line based on the previous lows. This line was based on three lows (two intraday March lows and one early-April low) and it already served as support twice: on April 6th and April 8th. It's unclear whether this line was broken on April 13th, but it was definitely broken yesterday.
Since this line was based on 3 lows and it already worked as support twice, breaking below it is a big deal.
The second thing is that silver tried to move above both: the $16 level, and the 61.8% Fibonacci retracement level based on the previous decline. And silver invalidated both of these small breakouts.
All the above factors point to lower silver prices in the coming part of the month.
Meanwhile, the mining stocks provide us with a new sell signal.
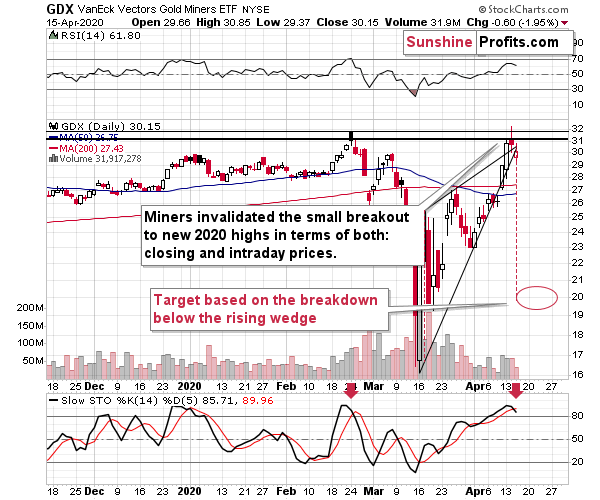
The sell signal comes from the Stochastic indicator. Do you know when we saw the previous sell signal from the Stochastic indicator while it was above 80? It was in late February right after the top, at a very similar price level.
Please note that back in February, there was a pause right after the first daily decline, and it took place on very low volume. We saw exactly the same thing yesterday.
The history seems to be rhyming.
Our yesterday's comments on the above chart remain up-to-date:
On a short-term basis, we see that the GDX ETF just tried to break to new 2020 highs. And it failed to do so. This attempt was made after GDX moved higher on relatively low volume, so it's no wonder that it failed - there was not enough buying power to keep prices at a new yearly high.
The invalidation of the small breakout is a bearish sign. Given the above, along with the pre-market move lower in gold and the general stock market, it seems that miners will move lower today. This move lower is likely to be the breakdown below the rising wedge and the thing about this formation is that once it's broken, it quite often triggers waterfall selling that leads to very volatile price drops.
This would be in perfect tune with the mining stocks responding to a decline in gold and stocks, and to the rally in the USD Index.
Before moving to gold, we have a surprising chart for you.
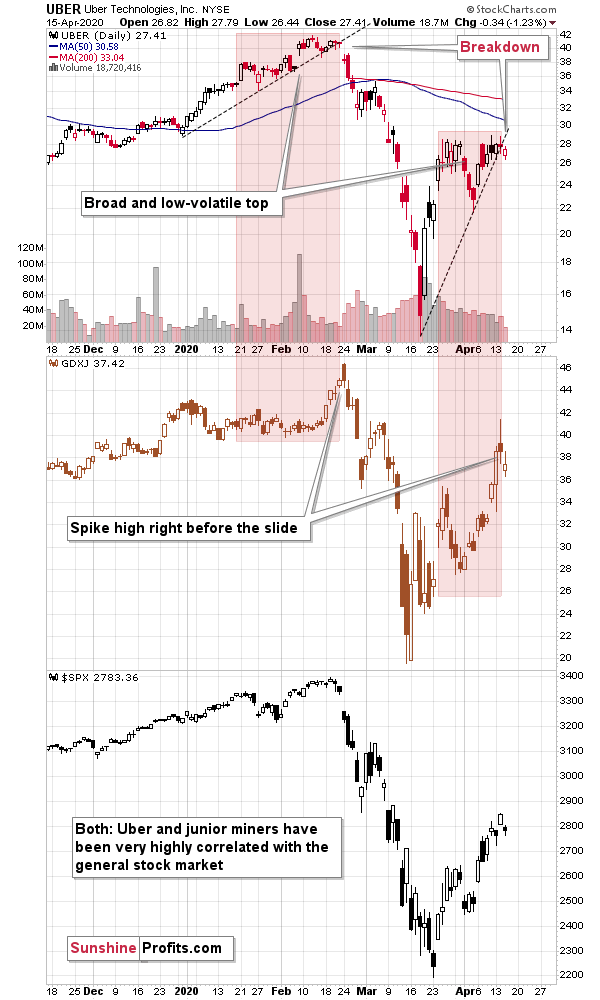
It's UBER (upper part of the chart) compared with the prices of junior mining stocks (middle of the chart).
But why?
Both have very little in common as far as business specifics are concerned, but what makes this comparison useful is that they both move in great tune with the general stock market (bottom of the chart).
If you had just one second to look at the above chart, you'd probably say that it features the same thing three times - they are so similar.
Despite this similarity, there's something very interesting that differentiates them with regard to the shape of their price moves. It's how they form tops. UBER is less volatile and it's forming broad tops. Junior miners are volatile, and they rally before topping. We saw both performances in February. UBER was moving back and forth at relatively elevated levels, and when it finally broke below its rising support line, all hell broke loose even though it was not clear right after the breakdown. Juniors, on the other hand, spiked high and reversed in a profound manner.
And what did we see this month? Exactly the same thing. UBER formed a broad top while junior miners spiked higher, and ended the rally with a clear reversal.
What's more, UBER just broke below its rising support line, indicating that all hell just broke loose. And just like it was the case in late February, it's not clear just yet. Interestingly, we saw low volume yesterday, and we saw relatively low volume also on February 21st.
The implications for the entire trio: UBER, general stock market, and the junior mining stocks are very bearish. And since it's very unlikely that juniors will decline without a decline in the PMs and senior miners, the implications are bearish for them as well.
Having said that, let's move to gold.
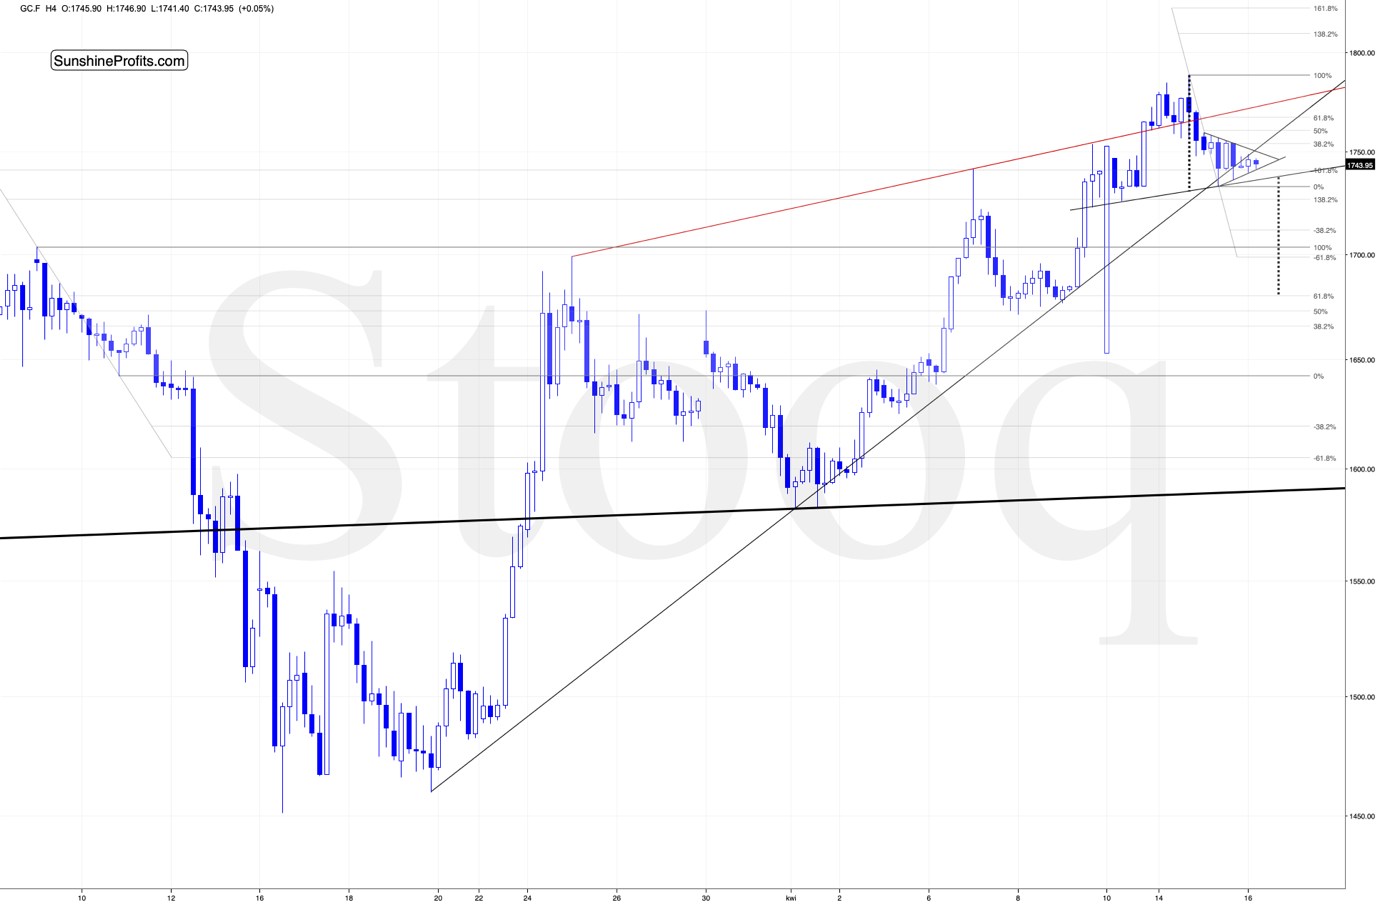
As we indicated earlier today, there are quite a few things visible on the above (4-hour) chart. We'll start by saying that the big white candlestick that we see on April 10th is a data error, so please don't pay attention to it. We'll address the features that we see on the gold chart, starting from the relatively small patterns and then we'll zoom out.
The most short-term pattern is the triangle based on just the last few days. It was broken to the upside since we created the chart, but it's not a big deal because of two things. The first thing is that the vertex of the triangle is just several hours away, so gold would be quite likely to top there. The second thing is that another move lower would be in tune with a bigger pattern - the head-and-shoulders top pattern.
The price action around April 10 would be the left shoulder, the recent top would be the head, and the current consolidation would be the right shoulder. This means that another move to the very recent highs - at about $1,755- $1,760 is relatively normal.
Besides, when gold topped in early March at about $1,700, it declined at a moderate pace at first, and right before the decline accelerated, gold corrected almost 50% of the preceding downswing. The analogous move would take gold to about $1,760 right now.
The head-and-shoulders formation - if completed - will point to the mid-April lows as the next downside target (marked with the dashed line). However, this might not be when the decline stops. In fact, the decline could pause in a more visible way only after gold moves a bit below $1,600. These are the price levels that stopped the declines in late February and in early April.
The decline below $1,600 would also be in tune with where gold declined in 2008 before pausing for a few days.
Back then, gold declined over 11% before pausing. A 11% decline from the recent high would imply gold at $1,592, which perfectly fits the above-mentioned support level.
Please note that gold is also trading very close to its rising support line (based on the March and April lows), which already worked once (on April 8th). Gold has been moving back and forth around it for the last several hours, but once the breakdown is complete and obvious, gold would be likely to slide based on it.
This support line, together with a rising resistance line based on the late-March and early April highs, creates a rising wedge pattern. This means that once gold breaks below it, it would be likely to decline as much as the height of the wedge. The wedge's height is almost $200, and gold would likely break below it at about $1,750, so the above suggests a move to about $1,550.
The time when these lines cross might also be important. They cross... Tomorrow. It could be the case that we'll see some major volatility today and tomorrow and a temporary low before the weekend. Of course, it could also be the case that gold moves higher once again and tops at that time, but based on what we already wrote today, the former scenario seems more likely.
Finally, before summarizing, we would like to reply to questions that we received recently.
From the Readers' Mailbag
Q: Can you please clarify how you come to an estimated JDST price of $14.87 vs current $1.4, i.e. 10 times or up 1000% when you expect GDXJ to decrease to $9.57 from current level of $37.5, i.e. by about 75%?
If JDST is just 2 x leverage of GDXJ, then wouldn't it be correct to consider that JDST can rise only for about 150% from current levels (75% * 2), i.e. to about $3.5 ($1.4 + $1.4x150%)?
A: We updated the targets for JDST and DUST, so we will explain how we arrived at the current JDST target - it's 14.52.
First of all, the calculations that you presented assume that the total move will be multiplied by the factor of 2, which is not how the JDST and DUST work. They don't multiply any move in particular other than the daily price move. If the value of GDXJ keeps declining by 1% per day, for 200 days, this will not mean that it's value will go below zero, as 1% would be a slightly smaller amount each day. After such 200 trading days, the price would be at (1-0.01)^200 = about 13.4% of the original value. In this scenario, how much would the JDST value go, assuming that it perfectly multiplied the daily gains, and there were no other factors?
(1+2x0.01)^200 = 52.48. Yes, the value of the JDST in this case would multiply by over 50 times.
In our case, we estimate the GDXJ would move from 37.42 to 9.57 over 8 trading days. On average, this would imply a decline of about 15.7% per day. This means that JDST would likely move higher by about 31.3% each day. In such a case, after 8 trading days, JDST's price would be equal to about $14.52.
This estimate technique is far from perfect, but much better than assuming that the entire move takes place on just one day (because that's what your calculation actually assumed). The longer the move takes, and the more steady it is, the bigger the final price of the JDST would get. The move will not be as perfectly steady as our model suggests, so it's most important to look at the GDXJ and exit JDST when the GDXJ reaches its own target.
For example, if the same price target in GDXJ was reached in a steady way, but it took 20 trading days instead of 8, the JDST would be likely to move to $19.51. If it took only 4 trading days, however, it would likely move to $10.16.
The closer we get to the target, the more accurate the final price prediction would get, as we would have to forecast shorter and smaller price move. That's why we're periodically updating the target prices.
Also, please note that just because we are featuring JDST and DUST in our Gold & Silver Trading Alerts in addition to featuring GDXJ and GDX, it doesn't mean that they are the best or most appropriate proxy for taking advantage of this decline for each and every investor. The more sophisticated an investor one is, the more investment vehicles they could (relatively) safely use. By that we don't mean guaranteed gains - only that advanced investors would be less likely to hurt themselves based on a given instruments sophistication.
Some will prefer to use futures for gold or silver, and some will prefer to use options, either on metals, or miners. One interesting strategy is to buy put options for the leveraged ETNs that are positioned against the outlook (in this case, it would be buying puts on JNUG). The interesting part of this strategy is that while the time decay and inherent downward drift these ETNs have (after all, by moving up by 50% and then down by 50%, one doesn't break even, but is at a 25% loss) when applied normally (buying JNUG while betting on higher mining stock prices and buying JDST while betting on lower mining stock prices), this effect is reversed in case of put options on the opposite ETN. With a put option, one welcomes the downward drift, as it makes this option more profitable.
Choosing individual vehicles for each investor would be an investment advice and we cannot provide such. We are providing targets for the most popular proxies that many people use, but this doesn't mean that we recommend them or that we are using them ourselves for ourselves and for other accredited investors in our private investment fund.
Similarly, during low or moderately volatile rallies (including the long-term upswings), we will prefer individual mining stock companies over ETFs or ETNs, but their selection goes beyond the scope of this publication - it's where the Golden StockPicker and Silver StockPicker tools come into play.
Also, please don't ask us about the possible strike price or expiry dates for options that one might use - these details could be viewed as an investment advice (in case of options that are particularly risky due to the time decay), so we can't provide them.
Q: Thank you for the update. Can you provide a strategy on buying the bottom. Hitting an exact low number will be difficult. Market will be volatile and will want to minimize downsize risk once the position is placed.
A: Yes, in fact, we already did that in 2017. A lot changed since that time, but the approach toward entering the market remains up-to-date - in general. The above link features the logic behind the strategy that assumes aiming to buy around the top, as the likelihood of the top being in grows.
However, given the current situation and the enormous volatility that we have experienced, and that we are likely to experience shortly, it might be difficult to implement the above strategy, and given that we plan to focus on purchasing mining stocks first, it might be even impossible. In case of the miners, the last bottom took only a few hours, so there was little time to debate whether the probability of the top being in increased a bit or not. Based on the extremely oversold status, we entered the market almost right at the bottom (with the trading capital), and if we do see our downside targets being hit, we might decide to go all-in at that time, instead of entering the market gradually. This would be a direct implementation of being greedy when others will be fearful.
The final strategy that we'll take, will depend on the way in which the market moves lower.
Q: Dear Sir, I understand that JDST will reverse split on 22nd April. What will the impact be for people who have shorted this stock? Please can you help understand? Will it impact us?
A: Direxion has indeed announced a 1 for 25 reverse split for JDST and DUST that will be effective after the markets close on April 22. This doesn't change anything major, as 25 shares on one's account will be substituted with 1 share that's worth 25 times as much. It doesn't imply gains or losses based on that - the company is simply consolidating its shares as it doesn't want their nominal prices to be as low as they are right now. That's what's taking place every now and then, and it's nothing uncommon.
Summary
Summing up, the outlook for the precious metals market remains bearish for the next few weeks, despite the upswing that we saw recently. In fact, based on the way the USD Index moved yesterday and today, it seems that the top in the PMs and miners is already in and the final part of the decline has already started.
The outlook might become bullish, if the strength in the PMs and miners persists and they prove to be able to rally despite falling stock prices and rallying USD Index, but it's much too early to say that this is already the case. Conversely, it seems that another big move lower in the S&P 500 and another big move higher in the USD Index are just around the corner, which would be likely to trigger a sell-off in the precious metals sector.
After the sell-off, we expect the precious metals to rally significantly. The decline might take as little as 1-3 weeks, so it's important to stay alert to any changes.
Most importantly - stay healthy and safe. We're making a lot of money on these price moves (and we'll likely make much more in the following weeks and months), but you have to be healthy to really enjoy the results.
By the way, we recently opened a possibility to extend one's subscription for a year with a 10% discount in the yearly subscription fee (the profits that you took have probably covered decades of subscription fees...). It also applies to our All-Inclusive Package (if you didn't know - we just made huge gains shorting crude oil and are also making money on both the decline and temporary rebound in stocks). The boring time in the PMs is over and the time to pay close attention to the market is here - it might be a good idea to secure more access while saving 10% at the same time.
Important: If your subscription got renewed recently, but you'd like to secure more access at a discount - please let us know, we'll make sure that the discount applies right away, while it's still active. Moreover, please note that you can secure more access than a year - if you secured a yearly access, and add more years to your subscription, each following year will be rewarded with an additional 10% discount (20% discount total). We would apply this discount manually - please contact us for details.
Secure more access at a discount.
As always, we'll keep you - our subscribers - informed.
To summarize:
Trading capital (supplementary part of the portfolio; our opinion): Full speculative short positions (250% of the full position) in mining stocks is justified from the risk to reward point of view with the following binding exit profit-take price levels:
Senior mining stocks (price levels for the GDX ETF): binding profit-take exit price: $10.32; stop-loss: none (the volatility is too big to justify a SL order in case of this particular trade); binding profit-take level for the DUST ETF: $9.82; stop-loss for the DUST ETF: none (the volatility is too big to justify a SL order in case of this particular trade)
Junior mining stocks (price levels for the GDXJ ETF): binding profit-take exit price: $9.57; stop-loss: none (the volatility is too big to justify a SL order in case of this particular trade); binding profit-take level for the JDST ETF: $14.52; stop-loss for the JDST ETF: none (the volatility is too big to justify a SL order in case of this particular trade)
For-your-information targets (our opinion; we continue to think that mining stocks are the preferred way of taking advantage of the upcoming price move, but if for whatever reason one wants / has to use silver or gold for this trade, we are providing the details anyway. In our view, silver has greater potential than gold does):
Silver futures downside profit-take exit price: $8.58
Gold futures downside profit-take exit price: $1,312 (the target for gold is least clear; it might drop to even $1,170 or so)
Long-term capital (core part of the portfolio; our opinion): No positions (in other words: cash)
Insurance capital (core part of the portfolio; our opinion): Full position
Whether you already subscribed or not, we encourage you to find out how to make the most of our alerts and read our replies to the most common alert-and-gold-trading-related-questions.
Please note that the in the trading section we describe the situation for the day that the alert is posted. In other words, it we are writing about a speculative position, it means that it is up-to-date on the day it was posted. We are also featuring the initial target prices, so that you can decide whether keeping a position on a given day is something that is in tune with your approach (some moves are too small for medium-term traders and some might appear too big for day-traders).
Plus, you might want to read why our stop-loss orders are usually relatively far from the current price.
Please note that a full position doesn't mean using all of the capital for a given trade. You will find details on our thoughts on gold portfolio structuring in the Key Insights section on our website.
As a reminder - "initial target price" means exactly that - an "initial" one, it's not a price level at which we suggest closing positions. If this becomes the case (like it did in the previous trade) we will refer to these levels as levels of exit orders (exactly as we've done previously). Stop-loss levels, however, are naturally not "initial", but something that, in our opinion, might be entered as an order.
Since it is impossible to synchronize target prices and stop-loss levels for all the ETFs and ETNs with the main markets that we provide these levels for (gold, silver and mining stocks - the GDX ETF), the stop-loss levels and target prices for other ETNs and ETF (among other: UGLD, DGLD, USLV, DSLV, NUGT, DUST, JNUG, JDST) are provided as supplementary, and not as "final". This means that if a stop-loss or a target level is reached for any of the "additional instruments" (DGLD for instance), but not for the "main instrument" (gold in this case), we will view positions in both gold and DGLD as still open and the stop-loss for DGLD would have to be moved lower. On the other hand, if gold moves to a stop-loss level but DGLD doesn't, then we will view both positions (in gold and DGLD) as closed. In other words, since it's not possible to be 100% certain that each related instrument moves to a given level when the underlying instrument does, we can't provide levels that would be binding. The levels that we do provide are our best estimate of the levels that will correspond to the levels in the underlying assets, but it will be the underlying assets that one will need to focus on regarding the signs pointing to closing a given position or keeping it open. We might adjust the levels in the "additional instruments" without adjusting the levels in the "main instruments", which will simply mean that we have improved our estimation of these levels, not that we changed our outlook on the markets. We are already working on a tool that would update these levels on a daily basis for the most popular ETFs, ETNs and individual mining stocks.
Our preferred ways to invest in and to trade gold along with the reasoning can be found in the how to buy gold section. Additionally, our preferred ETFs and ETNs can be found in our Gold & Silver ETF Ranking.
As a reminder, Gold & Silver Trading Alerts are posted before or on each trading day (we usually post them before the opening bell, but we don't promise doing that each day). If there's anything urgent, we will send you an additional small alert before posting the main one.
Thank you.
Sincerely,
Przemyslaw Radomski, CFA
Editor-in-chief, Gold & Silver Fund Manager


