Briefly: in our opinion, full (300% of the regular position size) speculative short positions in junior mining stocks are justified from the risk/reward point of view at the moment of publishing this Alert.
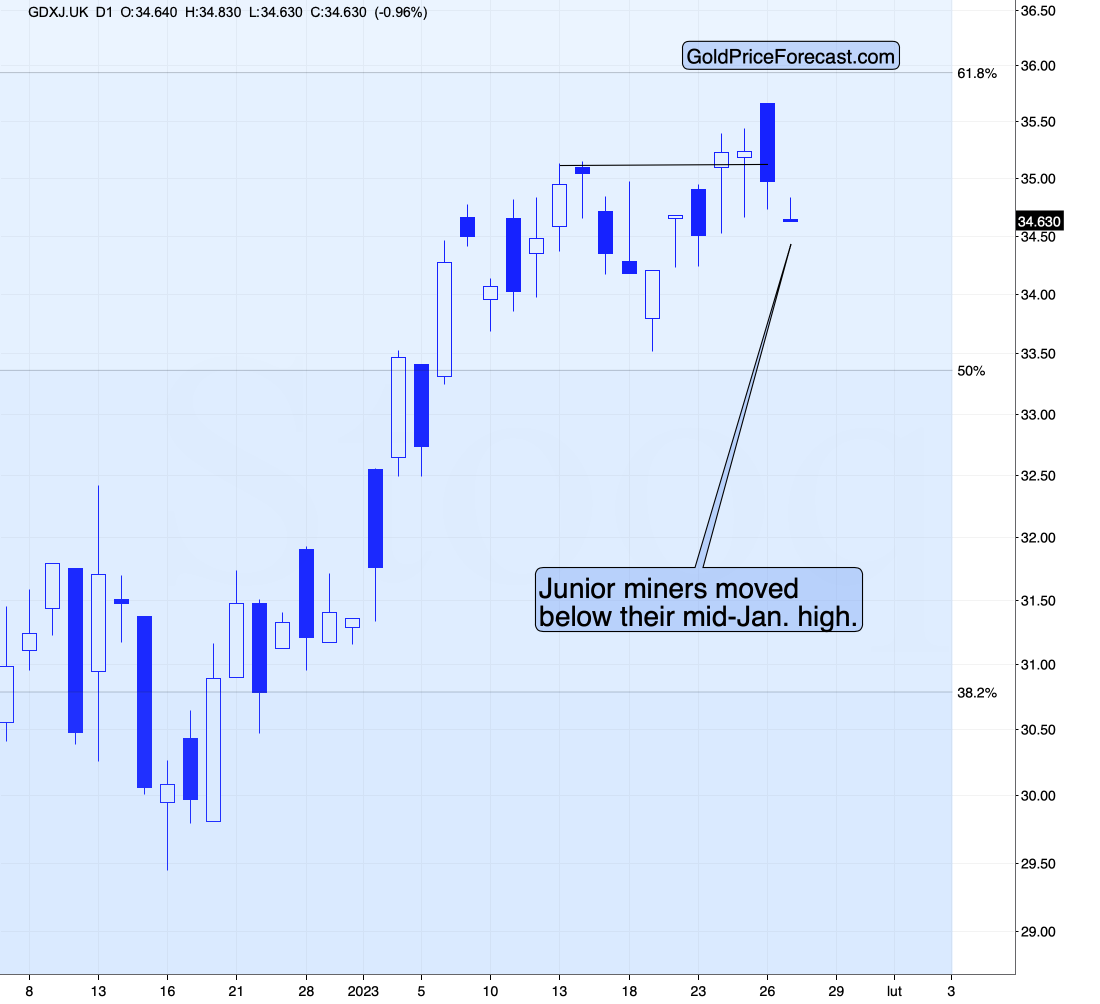
The no-action action continues in the precious metals sector, so there is little to report on the technical front. Gold tried to move higher but failed to hold onto those gains. Silver tried to move higher – above $24 – and it failed too. Junior miners fell back below their recent high, and the decline is expected to continue in today's London trading.
In fact, the GDXJ is now back not only below its 2023 high but even below its January 9. high.
This is a bearish indication that’s definitely worth noting.
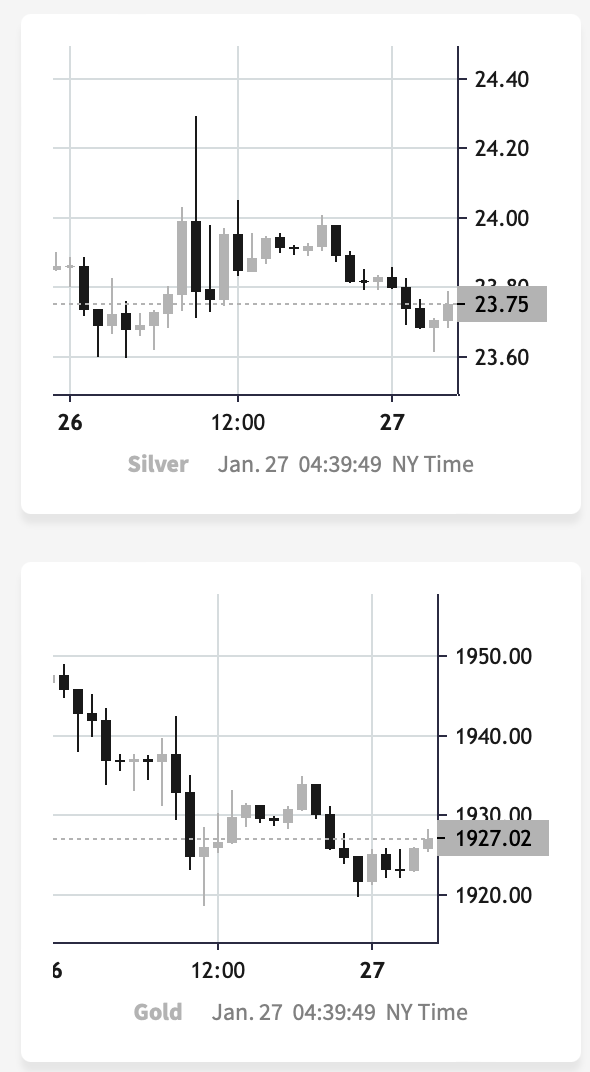
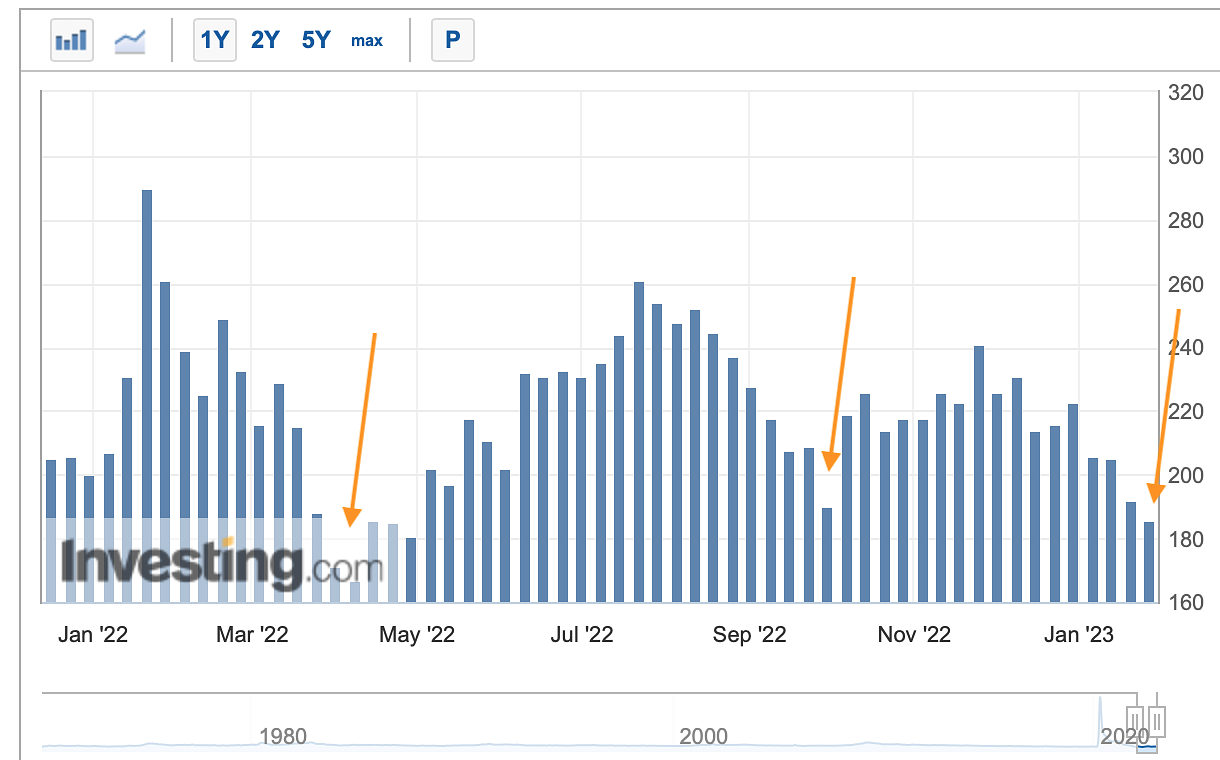
Two additional things that I would like to bring your attention to are the silver intraday outperformance that we saw yesterday and the very low reading in the initial jobless claims report (we’ll cover other fundamental changes in the following part of the analysis).
Please note the peak in the silver price at the beginning of the chart – that’s what we saw early during yesterday’s session. As you may recall, silver’s very short-term outperformance is often a bearish sign for the precious metals market.
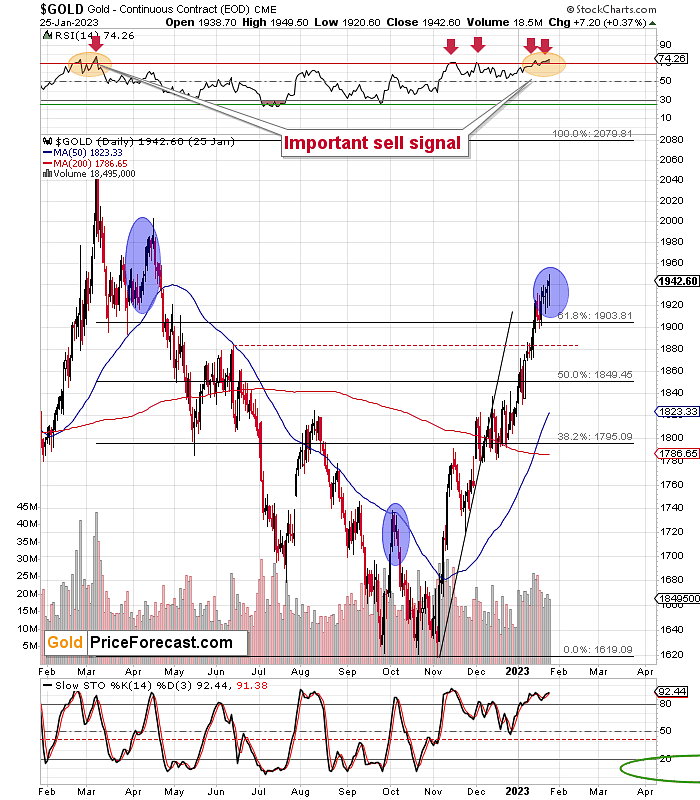
Please examine yesterday’s initial jobless claims - they were well below expectations (which is good for the U.S. economy). I marked the previous situations where the initial jobless claims were very low, and I also marked what - approximately - happened on the gold market at those times (blue ellipses).
In short, that's a bearish indication.
Having said that, let’s take a look at the markets from a more fundamental point of view.
Has Gold’s Upward Momentum Peaked?
While we warned for months that the economic data remained resilient and did not support a dovish pivot, the recession predictors continued to price in rate cuts (and still do); and despite their calls for a dovish 180 in August and October, the narrative still hasn’t borne any fundamental fruit. To explain, we wrote on Dec. 7:
 The red line above tracks the U.S. 10-2 spread, which subtracts the U.S. 2-Year Treasury yield (2Y) from the U.S. 10-Year Treasury yield (10Y). In a nutshell: when the 2Y exceeds the 10Y, it's the bond market's way of warning about a forthcoming recession; and the development occurs because the 2Y is pricing in a higher FFR, while the 10Y is pricing in weaker economic growth.
Also, with yield curve inversion (10Y < 2Y) the talk of the town in recent days, the narrative proclaims that a recession is imminent. But, that's not what we see….
The 10-2 spread turned negative in December 1988, and the recession arrived in July 1990 (~20-month lag). The 10-2 spread also turned negative in February 2000 and the recession arrived in February 2001 (~12-month lag). In addition, the 10-2 spread turned negative in February 2006 and the recession arrived in December 2007 (~22-month lag)….
The moral of the story is that the 10-2 spread needs to turn positive before recession fears are valid.
To that point, with Q4 real GDP outperforming expectations on Jan. 26, the fundamentals have not deviated from our expectations, and the outlook remains bullish for the U.S. federal funds rate (FFR), real yields and the USD Index.
Please see below:
 The official press release read:
“The increase in real GDP reflected increases in private inventory investment, consumer spending, federal government spending, state and local government spending, and nonresidential fixed investment that were partly offset by decreases in residential fixed investment and exports. Imports, which are a subtraction in the calculation of GDP, decreased.”
Now, while the perma-investors scream “lagged” whenever a strong GDP print materializes, please remember that they call the data lagged every quarter. Therefore, Q2 and Q3 were lagged, and now Q4 receives the same criticism.
As its stands, the important point is that demand remains resilient, the U.S. economy and the U.S. labor market have not collapsed, and the fundamentals support higher interest rates. So, while gold, silver and mining stocks have been uplifted by rate-cut optimism, the data continues to contrast that narrative.
In addition, earnings season has arrived, and the results from companies leveraged to the real economy are bullish for inflation and the FFR. For example, ADP – the largest human resources and payrolls firm in the U.S – released its second-quarter earnings on Jan. 25. CFO Don McGuire said during the Q2 conference call:
“With respect to the macro environment, the labor market continues to be strong. We're continuing to see our existing clients add employees.”
VP Danyal Hussain added:
“You could be in an environment where people have job postings and then they decide to pull them. How accurate that is, how great of a leading indicator that is, it's hard to say.
“At the same time, we have live data on pays per control as Don points out. We know with precision how many people are being added week-to-week. That's healthy. The job postings are healthy. Granted there are some signs of deceleration, layoffs and temp, but the bigger picture is still healthy.”
As a result, while we have warned for many months that a lack of demand destruction supports higher interest rates, the crowd still underestimates their prospective peak.
Likewise, Kimberly-Clark – one of the largest personal care products companies in the U.S. – released its fourth-quarter earnings on Jan. 25. CEO Mike Hsu said during the Q4 conference call:
“I would say, demand is holding up pretty well. I know that will be a topic people will want to double-click on. I would say, the elasticities are holding up better than we modeled originally.”
For context, ‘elasticities’ quantify the change in demand when prices increase or decrease; and while Kimberly-Clark racks up the price increases, demand has outperformed the company’s estimates.
More importantly, Hsu added:
“We have a significant portion of carryover pricing that was launched last year that still carries over into this year; and then, we've taken additional pricing actions since then; we've generally announced pricing actions across markets that are taking effect this quarter.”
So, while Kimberly-Clark’s average selling prices rose by 10% in Q4, more “pricing actions” will take effect in Q1.
Please see below:
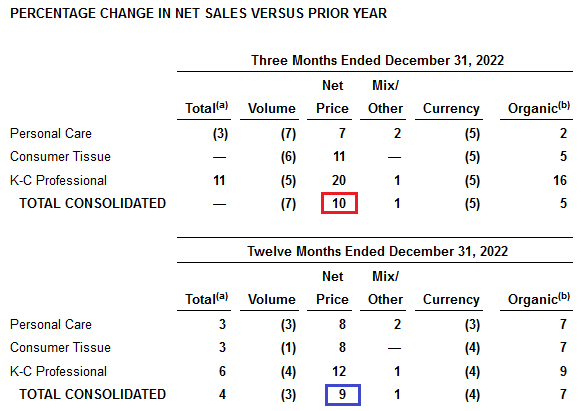 To explain, the red box above shows that net pricing increased by 10% in Q4. Moreover, the blue box above shows that net pricing increased by 9% for the full year, which means that the Q4 price increases exceeded the average from Q1 to Q3. As such, the crowd’s inflation optimism contrasts the data from companies that sell items to everyday Americans.
On top of that, if you focus your attention on the columns to the left of the boxes, you can see that volumes declined across all categories in Q4 and for the full year. As it stands, Kimberly-Clark’s revenue growth was driven solely by price increases, and the dynamic is increasingly widespread.
Continuing the theme, Union Pacific – the second-largest railroad shipping company in the U.S. – released its fourth-quarter earnings on Jan. 24. CFO Jennifer Hamann said during the Q4 conference call:
“For 2023, we expect our all-in inflation to be around 4%, while cost per employee is expected to increase in the mid-single digits as elevated wage inflation is partially offset by productivity…. As we have demonstrated consistently, we expect to generate pricing dollars that exceed inflation dollars in 2023.”
Please see below:
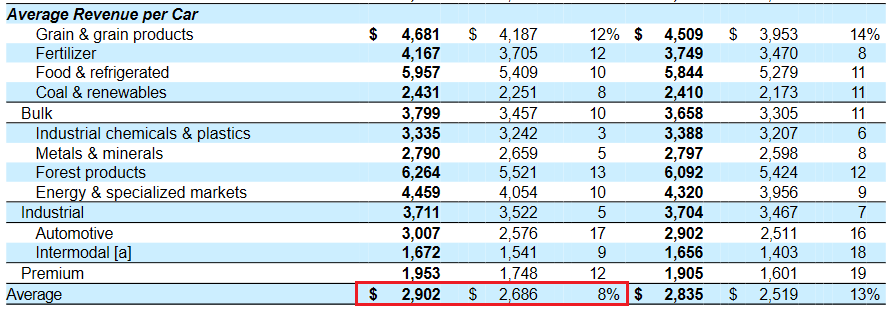 To explain, Union Pacific’s average revenue per car (ARPC) rose by 8% in Q4, and since volume increased by 1%, the company raised its prices by ~7%. In addition, if “all-in inflation” hovers near 4% in 2023 and the group generates “pricing dollars that exceed inflation dollars,” its ARPC should rise by at least 5%. Consequently, these results do not support a 2% inflation rate anytime soon.
Overall, the economic and earnings data remain profoundly hawkish, and the fundamentals continue to align with our expectations; and while the PMs have rallied sharply due to the pivot sentiment, please remember that the crowd spends more time pumping narratives than doing their homework. That’s why their recession calls proved premature. However, higher interest rates should shift the mood music over the medium term, and the PMs should suffer mightily as the drama unfolds.
How can the Fed cut interest rates when inflation, earnings, spending and employment remain resilient? And how can the CPI hit 2% if large corporations are still raising their prices by much more? Is the crowd in for a wake-up call?
Are Hawkish Clouds Hovering Over Silver?
While the long-term outlook for gold, silver and mining stocks remains bright, the medium term is fraught with peril. For example, the crowd has priced in an unrealistic fundamental environment, which assumes that rate cuts, sharply lower inflation and strong corporate earnings will all come to fruition. In reality, though, these developments cannot all occur simultaneously.
So, while corporate earnings may remain uplifted due to resilient demand, that same demand is bullish for inflation and higher interest rates. On Jan. 24, Walmart announced that it will increase its minimum wage by as much as $2, which translates to percentage increases as high as 12% to 17%.
Please see below:
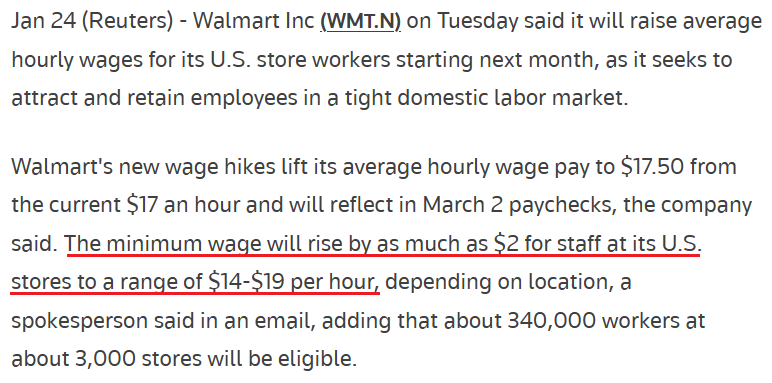 Moreover, while the crowd ignores the ramifications for output inflation, Walmart is the largest employer in the U.S. As a result, its actions are material, and the implications are profoundly hawkish.
Please see below:
 Furthermore, while headline inflation decelerated recently – due to lower oil & gas prices – the slowdown increased real earnings, as wage growth outperformed price growth. In the process, Americans’ spending power increased, which was already buoyed by record-high household checkable deposits.
Please see below:
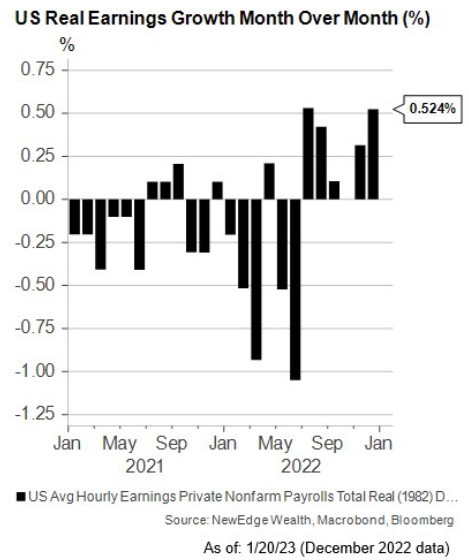 To explain, real average hourly earnings remain negative on a year-over-year (YoY) basis. However, the black bars above show how month-over-month (MoM) growth has been positive recently, which should only spur further demand.
On top of that, while investors’ celebrated the decline in energy prices, we warned that broad-based inflation continues to increase; and with wage growth a significant component, more drama should be on the horizon.
Please see below:
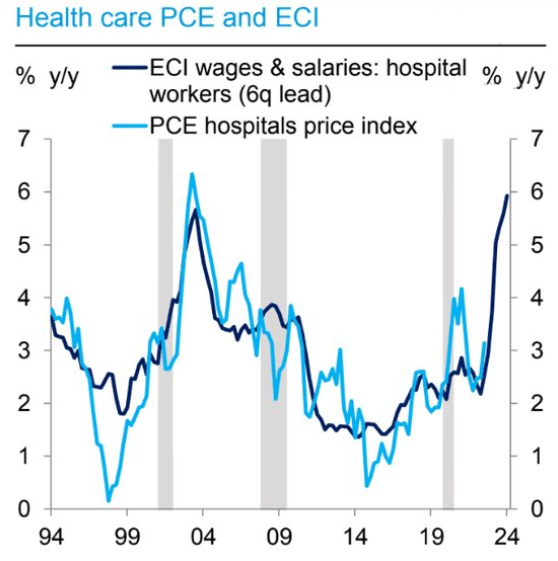 To explain, the dark blue line above tracks the YoY percentage change in the Employment Cost Index (ECI) for hospital workers, while the light blue line above tracks the YoY percentage change in the Personal Consumption Expenditures (PCE) Index hospital price index.
If you analyze the relationship, you can see that higher wages often result in higher inflation; and with the dark blue line on the right side of the chart increasing materially in recent quarters, the light blue line should follow suit in the months ahead. Consequently, interest rates need to rise further to create the demand destruction necessary to curb inflation.
Speaking of which, the Kansas City Fed released its Tenth District Manufacturing Activity Survey on Jan. 26. The headline index increased from -4 in December to -1 in January, and this month’s “special questions” revealed:
“In January, 52% of firms expected demand for their products to be higher in 2023 compared to last year, while 19% of firms expected no change in demand for their products, and 29% of firms expected demand for their products to be lower in 2023 compared to last year.”
Please see below:
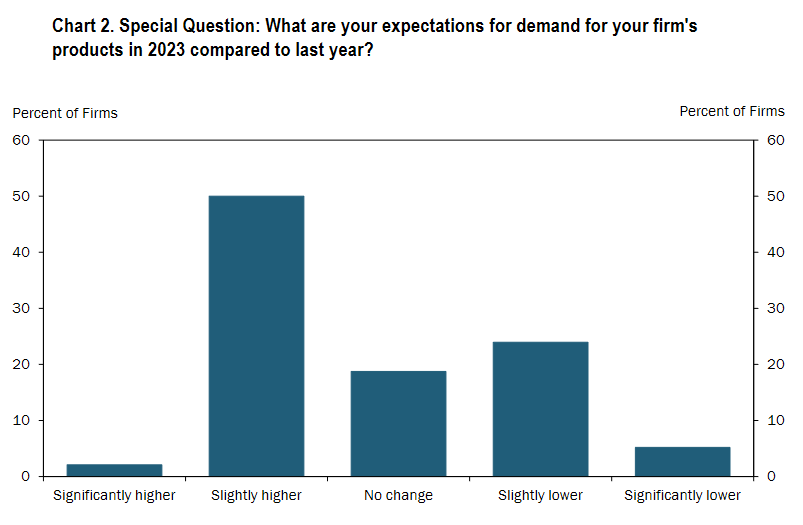 To explain, roughly 65% of KC manufacturing firms expect demand for their products to match or exceed 2022 levels. Furthermore, some of the anecdotal responses read:
“Cost of goods (production inputs) remain extremely high and still going north. This idea that inflation is easing is not true - at least in our industry/segment. Profits taking hit despite price increases. Can't pass through all cost increases to customers - resulting in reduced margins on our side.”
“Our energy costs continue to accelerate at a double-digit pace. We continue to experience a shortage of truck drivers and double-digit inflation in truck driver wages. Driver turnover remains a problem as competitors seek to entice them to work for them with higher pay.”
So, while the consensus expects a smooth pathway to 2% inflation, the realities on the ground are much different. Therefore, we maintain our thesis that jumpy inflation should elicit volatility throughout 2023.
Overall, silver is perched near $24, as the misguided narrative has not changed. However, with the GDXJ ETF mirroring its mid-2021 and 2022 corrective upswings, the prior iterations ended with sharp drawdowns, and this one should be no different. Essentially, while the silver price is supported for now, we expect a much different outcome over the medium term.
Is inflation underestimated by the bulls? How will rising real incomes affect consumption? Will silver’s consolidation end with a breakout or a breakdown?
The Bottom Line
While the S&P 500 continued its recent rise, gold sputtered, and the GDXJ ETF was a noticeable underperformer. Moreover, the USD Index is showing many signs of forming a bottom, while silver is showing many signs of forming a top. Thus, the next major reversal may occur sooner rather than later.
In conclusion, the PMs were mixed on Jan. 26, as silver ended the day in the green. But, the pivot narrative is becoming weaker by the day, as growth remains resilient and MoM inflation has returned. As such, it’s likely only a matter of time before these realities help spark the next bout of panic.
Overview of the Upcoming Part of the Decline
- It seems to me that the corrective upswing is over (or about to be over) and that the next big move lower is already underway (or that it’s about to start).
- If we see a situation where miners slide in a meaningful and volatile way while silver doesn’t (it just declines moderately), I plan to – once again – switch from short positions in miners to short positions in silver. At this time, it’s too early to say at what price levels this could take place and if we get this kind of opportunity at all – perhaps with gold prices close to $1,500 - $1,550.
- I plan to switch from the short positions in junior mining stocks or silver (whichever I’ll have at that moment) to long positions in junior mining stocks when gold / mining stocks move to their 2020 lows (approximately). While I’m probably not going to write about it at this stage yet, this is when some investors might consider getting back in with their long-term investing capital (or perhaps 1/3 or 1/2 thereof).
- I plan to return to short positions in junior mining stocks after a rebound – and the rebound could take gold from about $1,450 to about $1,550, and it could take the GDXJ from about $20 to about $24. In other words, I’m currently planning to go long when GDXJ is close to $20 (which might take place when gold is close to $1,450), and I’m planning to exit this long position and re-enter the short position once we see a corrective rally to $24 in the GDXJ (which might take place when gold is close to $1,550).
- I plan to exit all remaining short positions once gold shows substantial strength relative to the USD Index while the latter is still rallying. This may be the case with gold prices close to $1,400 and GDXJ close to $15 . This moment (when gold performs very strongly against the rallying USD and miners are strong relative to gold after its substantial decline) is likely to be the best entry point for long-term investments, in my view. This can also happen with gold close to $1,400, but at the moment it’s too early to say with certainty.
- The above is based on the information available today, and it might change in the following days/weeks.
You will find my general overview of the outlook for gold on the chart below:
Please note that the above timing details are relatively broad and “for general overview only” – so that you know more or less what I think and how volatile I think the moves are likely to be – on an approximate basis. These time targets are not binding nor clear enough for me to think that they should be used for purchasing options, warrants, or similar instruments.
Letters to the Editor
We received a few messages over e-mail, but as we are moving to our new platform, we will be transferring them below the articles as comments – and that’s where we’ll be replying to them.
Asking your questions below the articles or in the spaces called “Ask the Community” or “Position Sizes” directly will help us deliver a reply sooner. In some cases, someone from the community might reply and help even before we do.
Please remember about the Pillars of our Community, especially about the Kindness of Speech Pillar.
Also, if there’s anything that you’re unhappy with, it’s best to send us a message at [email protected].
Please note that this section is going to go away within the next 1-8 weeks, as you can add comments/questions below the article on Golden Meadow – the platform that we’re using to provide our analyses. Your notification e-mails include an invitation link that allows you to access the “Gold Trading Alerts” space.
Also, if you haven’t had the chance to see the video, in which I’m talking about the new platform and why we essentially moved from Sunshine Profits to Golden Meadow, I strongly encourage you to do so:
Summary
Summing up, it seems that the major bottom in the USD Index is in (or at hand), while the correction in stocks, gold, silver, and mining stocks is over – or very close to being over.
Gold and silver correct about 61.8% of their 2022 decline, while junior miners corrected a bit more than 50% of the decline, but not more than 61.8% thereof. This is exactly how the big 2021 and 2022 declines in junior miners started.
Given the above, gold’s very long-term resistance (the 2011 high!) and the situation in the USD Index, it seems that the next big move lower in the precious metals sector is about to start.
Now, as more investors realize that interest rates will have to rise sooner than expected, the prices of precious metals and mining stocks (as well as other stocks) are likely to fall. In my opinion, the current trading position is going to become profitable in the following weeks, and quite possibly in the following days. And while I can’t promise any kind of performance, I fully expect it to become very profitable before it’s over and to prolong our 2022 winning streak.
After the final sell-off (that takes gold to about $1,350-$1,500), I expect the precious metals to rally significantly. The final part of the decline might take as little as 1-5 weeks, so it's important to stay alert to any changes.
As always, we'll keep you – our subscribers – informed.
To summarize:
Trading capital (supplementary part of the portfolio; our opinion): Full speculative short positions (300% of the full position) in junior mining stocks are justified from the risk to reward point of view with the following binding exit profit-take price levels:
Mining stocks (price levels for the GDXJ ETF): binding profit-take exit price: $20.32; stop-loss: none (the volatility is too big to justify a stop-loss order in case of this particular trade)
Alternatively, if one seeks leverage, we’re providing the binding profit-take levels for the JDST (2x leveraged). The binding profit-take level for the JDST: $22.87; stop-loss for the JDST: none (the volatility is too big to justify a SL order in case of this particular trade).
For-your-information targets (our opinion; we continue to think that mining stocks are the preferred way of taking advantage of the upcoming price move, but if for whatever reason one wants / has to use silver or gold for this trade, we are providing the details anyway.):
Silver futures downside profit-take exit price: $14.32
SLV profit-take exit price: $13.42
ZSL profit-take exit price: $48.87
Gold futures downside profit-take exit price: $1,504
HGD.TO – alternative (Canadian) 2x inverse leveraged gold stocks ETF – the upside profit-take exit price: $16.47
HZD.TO – alternative (Canadian) 2x inverse leveraged silver ETF – the upside profit-take exit price: $36.87
Long-term capital (core part of the portfolio; our opinion): No positions (in other words: cash)
Insurance capital (core part of the portfolio; our opinion): Full position
Whether you’ve already subscribed or not, we encourage you to find out how to make the most of our alerts and read our replies to the most common alert-and-gold-trading-related-questions.
Please note that we describe the situation for the day that the alert is posted in the trading section. In other words, if we are writing about a speculative position, it means that it is up-to-date on the day it was posted. We are also featuring the initial target prices to decide whether keeping a position on a given day is in tune with your approach (some moves are too small for medium-term traders, and some might appear too big for day-traders).
Additionally, you might want to read why our stop-loss orders are usually relatively far from the current price.
Please note that a full position doesn't mean using all of the capital for a given trade. You will find details on our thoughts on gold portfolio structuring in the Key Insights section on our website.
As a reminder - "initial target price" means exactly that - an "initial" one. It's not a price level at which we suggest closing positions. If this becomes the case (as it did in the previous trade), we will refer to these levels as levels of exit orders (exactly as we've done previously). Stop-loss levels, however, are naturally not "initial", but something that, in our opinion, might be entered as an order.
Since it is impossible to synchronize target prices and stop-loss levels for all the ETFs and ETNs with the main markets that we provide these levels for (gold, silver and mining stocks - the GDX ETF), the stop-loss levels and target prices for other ETNs and ETF (among other: UGL, GLL, AGQ, ZSL, NUGT, DUST, JNUG, JDST) are provided as supplementary, and not as "final". This means that if a stop-loss or a target level is reached for any of the "additional instruments" (GLL for instance), but not for the "main instrument" (gold in this case), we will view positions in both gold and GLL as still open and the stop-loss for GLL would have to be moved lower. On the other hand, if gold moves to a stop-loss level but GLL doesn't, then we will view both positions (in gold and GLL) as closed. In other words, since it's not possible to be 100% certain that each related instrument moves to a given level when the underlying instrument does, we can't provide levels that would be binding. The levels that we do provide are our best estimate of the levels that will correspond to the levels in the underlying assets, but it will be the underlying assets that one will need to focus on regarding the signs pointing to closing a given position or keeping it open. We might adjust the levels in the "additional instruments" without adjusting the levels in the "main instruments", which will simply mean that we have improved our estimation of these levels, not that we changed our outlook on the markets. We are already working on a tool that would update these levels daily for the most popular ETFs, ETNs and individual mining stocks.
Our preferred ways to invest in and to trade gold along with the reasoning can be found in the how to buy gold section. Furthermore, our preferred ETFs and ETNs can be found in our Gold & Silver ETF Ranking.
As a reminder, Gold & Silver Trading Alerts are posted before or on each trading day (we usually post them before the opening bell, but we don't promise doing that each day). If there's anything urgent, we will send you an additional small alert before posting the main one.
Thank you.
Przemyslaw K. Radomski, CFA
Founder, Editor-in-chief


