In short: No changes and no positions.
We saw another move lower in gold and the situation basically remains unchanged from yesterday. Please take a look below (charts courtesy of http://stockcharts.com.)
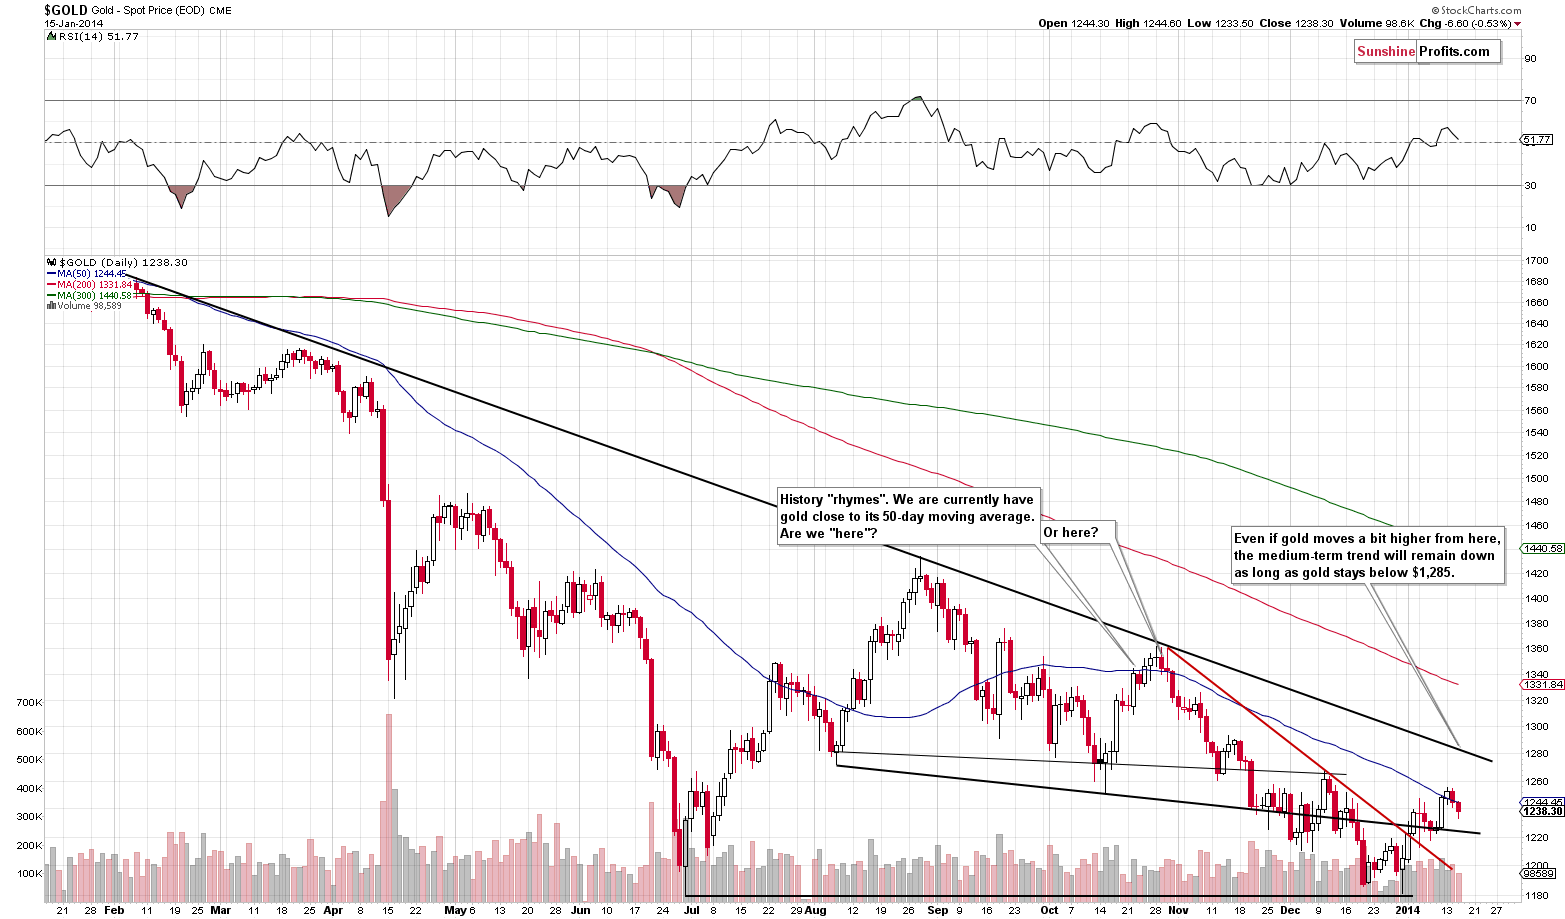
Gold moved lower yesterday (and reversed its direction before the end of the session), which doesn’t imply much at this moment. The price of gold is still "close to the 50-day moving average" and what was unclear yesterday is still unclear today.
Gold corrected after moving above its 50-day moving average and now its less than $1 below it. This could be viewed as a confirmation or an invalidation, depending on how "picky" one decides to be. We’re "picky" in terms of not making decisions until the situation becomes clearer, so we will simply consider the current situation as one in which gold is just "close to its 50-day moving average."
This actually tells us something. The previous time gold was close to this moving average, it was close to its local top. However, it is not clear if we are before it or right at it. This means that the next few days are unclear, but we should see another move to the downside quite soon.
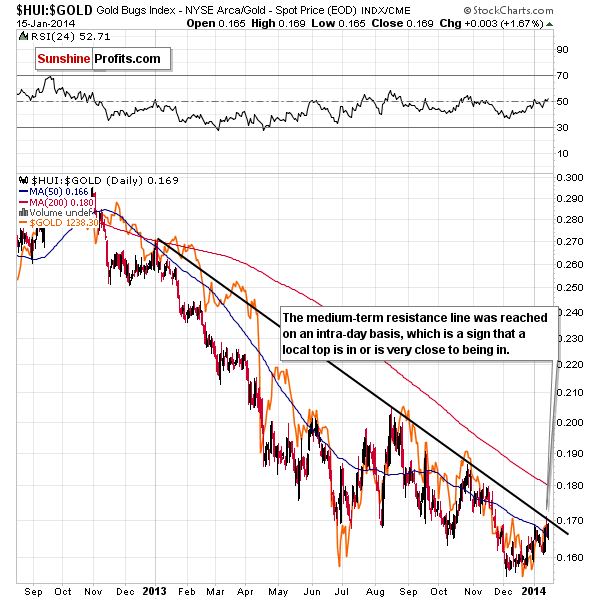
Yesterday, we commented on the gold stocks to gold ratio in the following way:
The medium-term resistance line was reached, which is quite a big deal. The last time that this line was touched, was when metals and miners topped in late October 2013. We’re at the same line once again. More precisely, we were on Tuesday, on an intra-day basis.
The bearish implications of the above remain in place and we would like to note that even though the ratio moved higher yesterday, it didn’t move above the declining resistance line and it didn’t move above the Tuesday intra-day high.
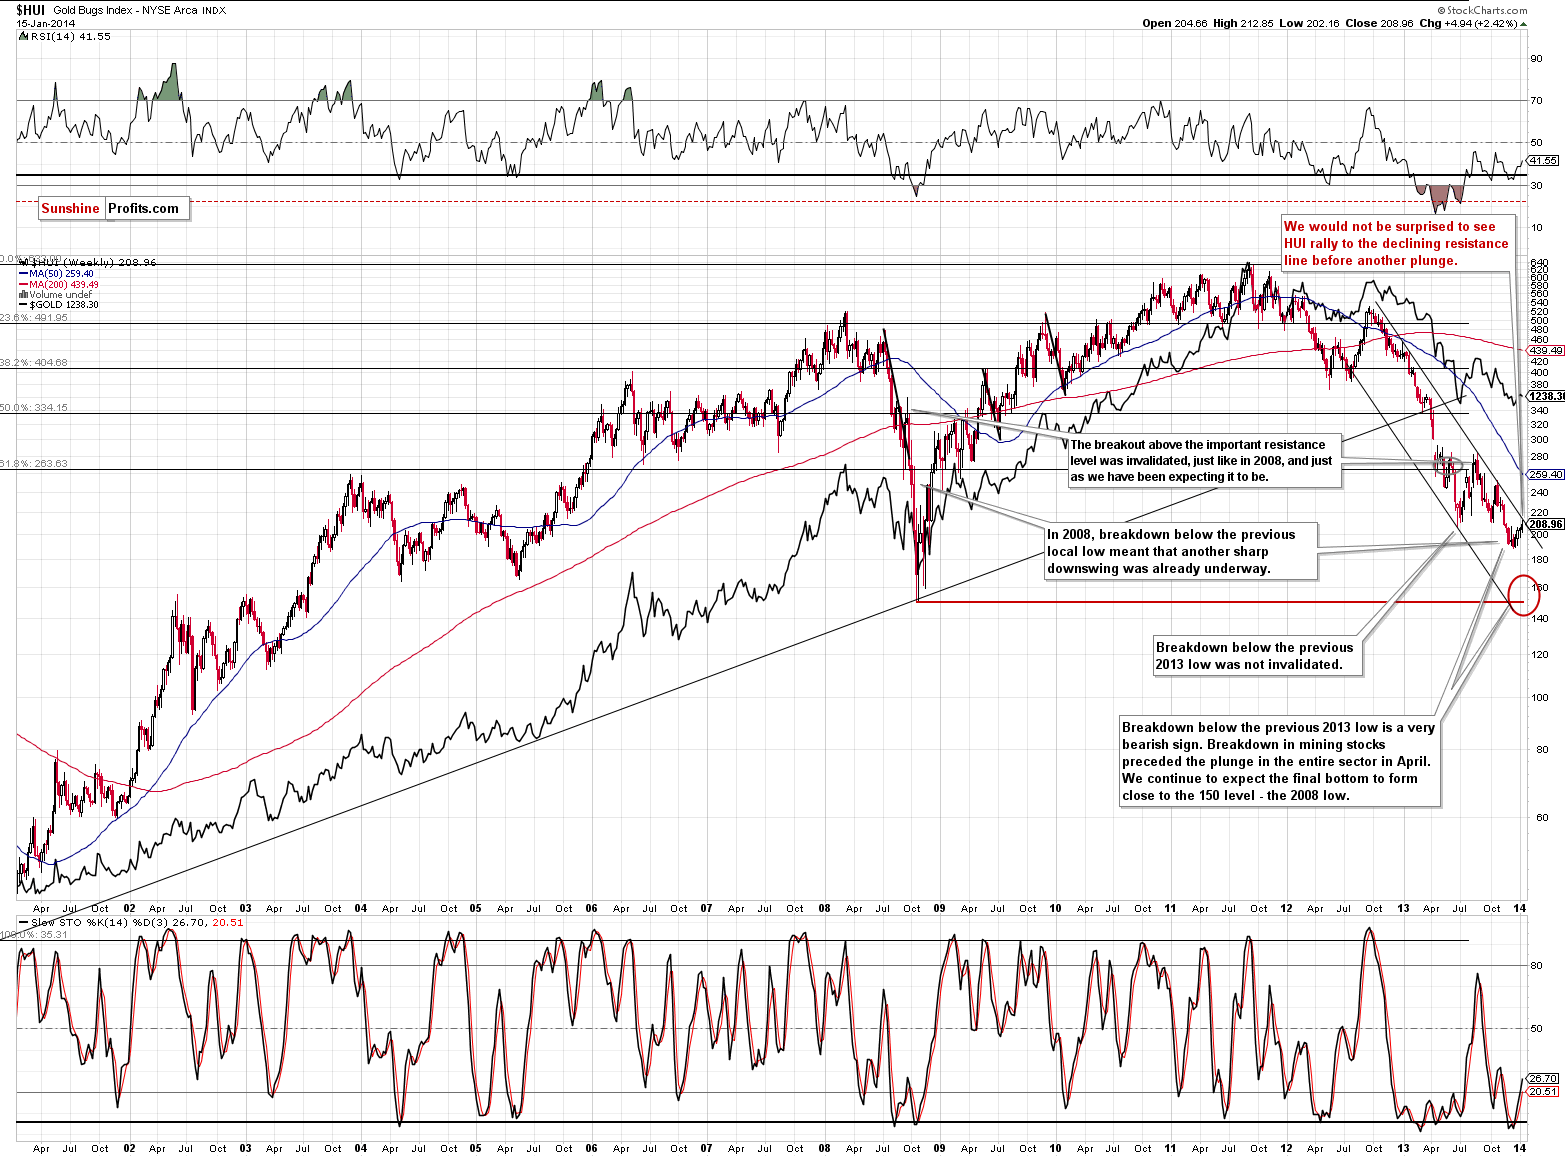
Yesterday we wrote that there was an intra-day reversal, which means that HUI has room for another move higher. The intra-day reversal is a bearish sign by itself, but at the same time it’s not, because gold miners haven’t declined as much as gold has.
Miners moved higher yesterday, which is a bullish sign when combined with gold’s move lower. It seems that gold stocks had another catalyst – a significant daily rally in the stock market. Is this really a sign of strength? It is a bullish sign, but not a very important one, in our view. We don’t view it as a decisive one that makes the overall situation on the precious metals market bullish.
On a short-term basis, we can see a verification of the breakout above the declining resistance line (created by intra-day highs; marked in black on the chart below).
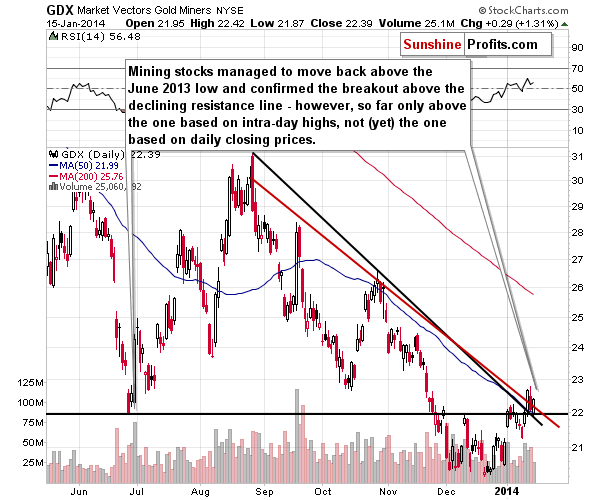
This is a bullish sign, but the long-term resistance line that we can see on the long-term HUI Index chart is much more important, and the breakout above the short-term line is currently of little meaning.
Meanwhile, the palladium market still suggests that we’re at a local top, or at least very close to one.
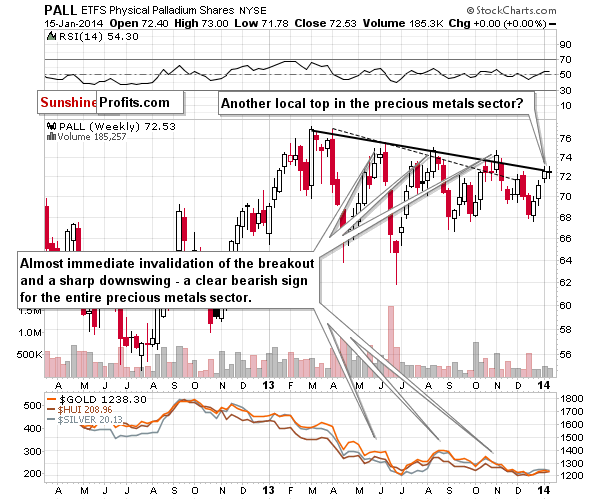
As we mentioned yesterday and in the previous days, the above chart is bearish.
Before we finish off, let’s take a look at the USD Index, to put the above into perspective.
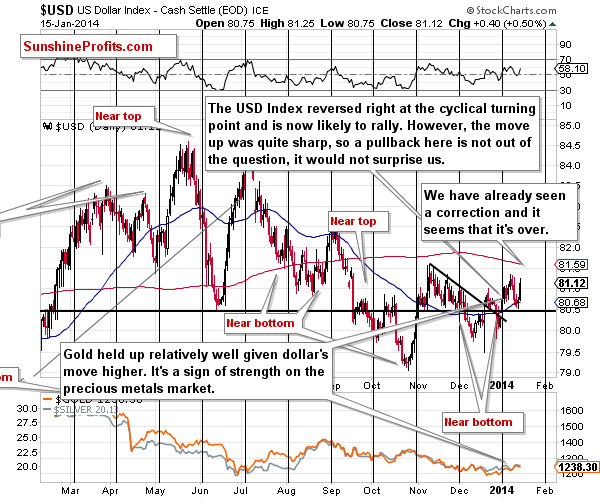
The key thing that we see on the above chart is that the USD Index seems to have finished its post-breakout correction. It rallied once again and it seems to be on a verge of another move higher. As Nadia wrote yesterday, the outlook for the EUR/USD is bearish, which makes it bullish for the USD Index. However, a slight move higher might be necessary before the rally in the USD Index becomes very likely (it’s still likely now).
Moving back to the USD-gold link. Gold didn’t react strongly to the dollar’s rally and miners even managed to go up. This is a sign of strength. However, at this time it’s quite possible that investors were also waiting for the rally in the USD to become more probable before dropping gold and mining stocks.
The good thing is that we are still likely to see higher USD values, which will provide us with lots of information regarding gold and the rest of the precious metals sector. If the USD continues to rally and gold refuses to decline, we will know that another significant move higher will be seen rather soon. However, it seems too soon to say so now, especially that the medium-term trends in the precious metals market remain down.
Taking all of the above into account, we get the same result we got yesterday. The situation is rather unclear for the short term but remains bearish for the medium term. Our best guess is that we will see a decline in the coming weeks but not necessarily right away. We will consider opening speculative short positions once we see some kind of confirmation.
To summarize:
- Trading capital: No positions.
- Long-term capital: No positions.
As always, we'll keep you - our subscribers - updated should our views on the market change. We will continue to send out Market Alerts on a daily basis (except when Premium Updates are posted) and we will send additional Market Alerts whenever appropriate.
The trading position presented above is the netted version of positions based on subjective signals from your Editor, and the automated tools (SP Indicators and the upcoming self-similarity-based tool). You will find more information by following links in the summary of the latest Premium Update.
As a reminder, Market Alerts are posted before or on each trading day (we usually post them before the opening bell, but we don't promise doing that each day). If there's anything urgent, we will send you an additional small alert before posting the main one.
=====
We have an important administrative announcement.
As you have noticed, Market Alerts that we have been sending this week are a bit different from what we used to send previously - they now include updated charts on each day.
In our recent survey, 10 times more subscribers selected the option that mentioned daily alerts + additional alerts whenever the situation requires it, than the option with 1 weekly update + additional alerts whenever the situation requires it.
This got us thinking that perhaps we are not providing our service in the way that is most suitable for you. Naturally, this led us to thinking how we could improve it. If daily alerts are so much more important than weekly updates, then perhaps we should move our focus to them. We thought that instead of 1 weekly update with charts (most of them don't change from one week to the next, for instance the long-term USD Index chart), we would be sending you alerts with charts on each trading day. In this case, we would be providing charts on which something actually happened and we would have something new to say (or we would stress particularly useful parts of previous alerts).
Having charts in front of you when we describe various resistance / support levels and when we discuss potential sizes of given price moves should help to make it clear what we mean and to decide more easily if a given price move is something that you might be interested in trading on. Until this week, you received charts from us on a weekly basis and now you would get them on each trading day. In this way, the daily alerts would be a smaller version of our current Premium Update. It seems to us that 5 small alerts would be much more useful than 1 big one published once a week. However, the decision is up to you. We have already started providing analysis in the "new form", but we can go back to the previous one if you find it less suited to your needs than the previous setup.
We plan to continue sending bigger Market Alerts that include charts... Unless, of course, you tell us that you think the previous system (with charts once a week in Premium Updates) was better. Naturally, we work for you, and we want to provide our analysis in the most convenient form, but we want to be sure we are going in the right direction. If you think that the previous way of providing the analysis was better, please let us know.
So far we received only positive feedback to the above-mentioned change. Thank you.
=====
Thank you.
Sincerely,
Przemyslaw Radomski, CFA


