
We posted the previous update earlier last week and the next update was originally scheduled for this Friday. However, we believe that too much happened since we wrote the previous update not to provide you with a supplementary one.
Let's begin with the long-term interest rates (charts courtesy of http://stockcharts.com). Some time ago we discussed the link between long-term interest rates and stocks and the precious metals sector. In a nutshell, very low rates are positive for both stocks and metals, as they mean that people will be able to obtains and use more money for purchases.
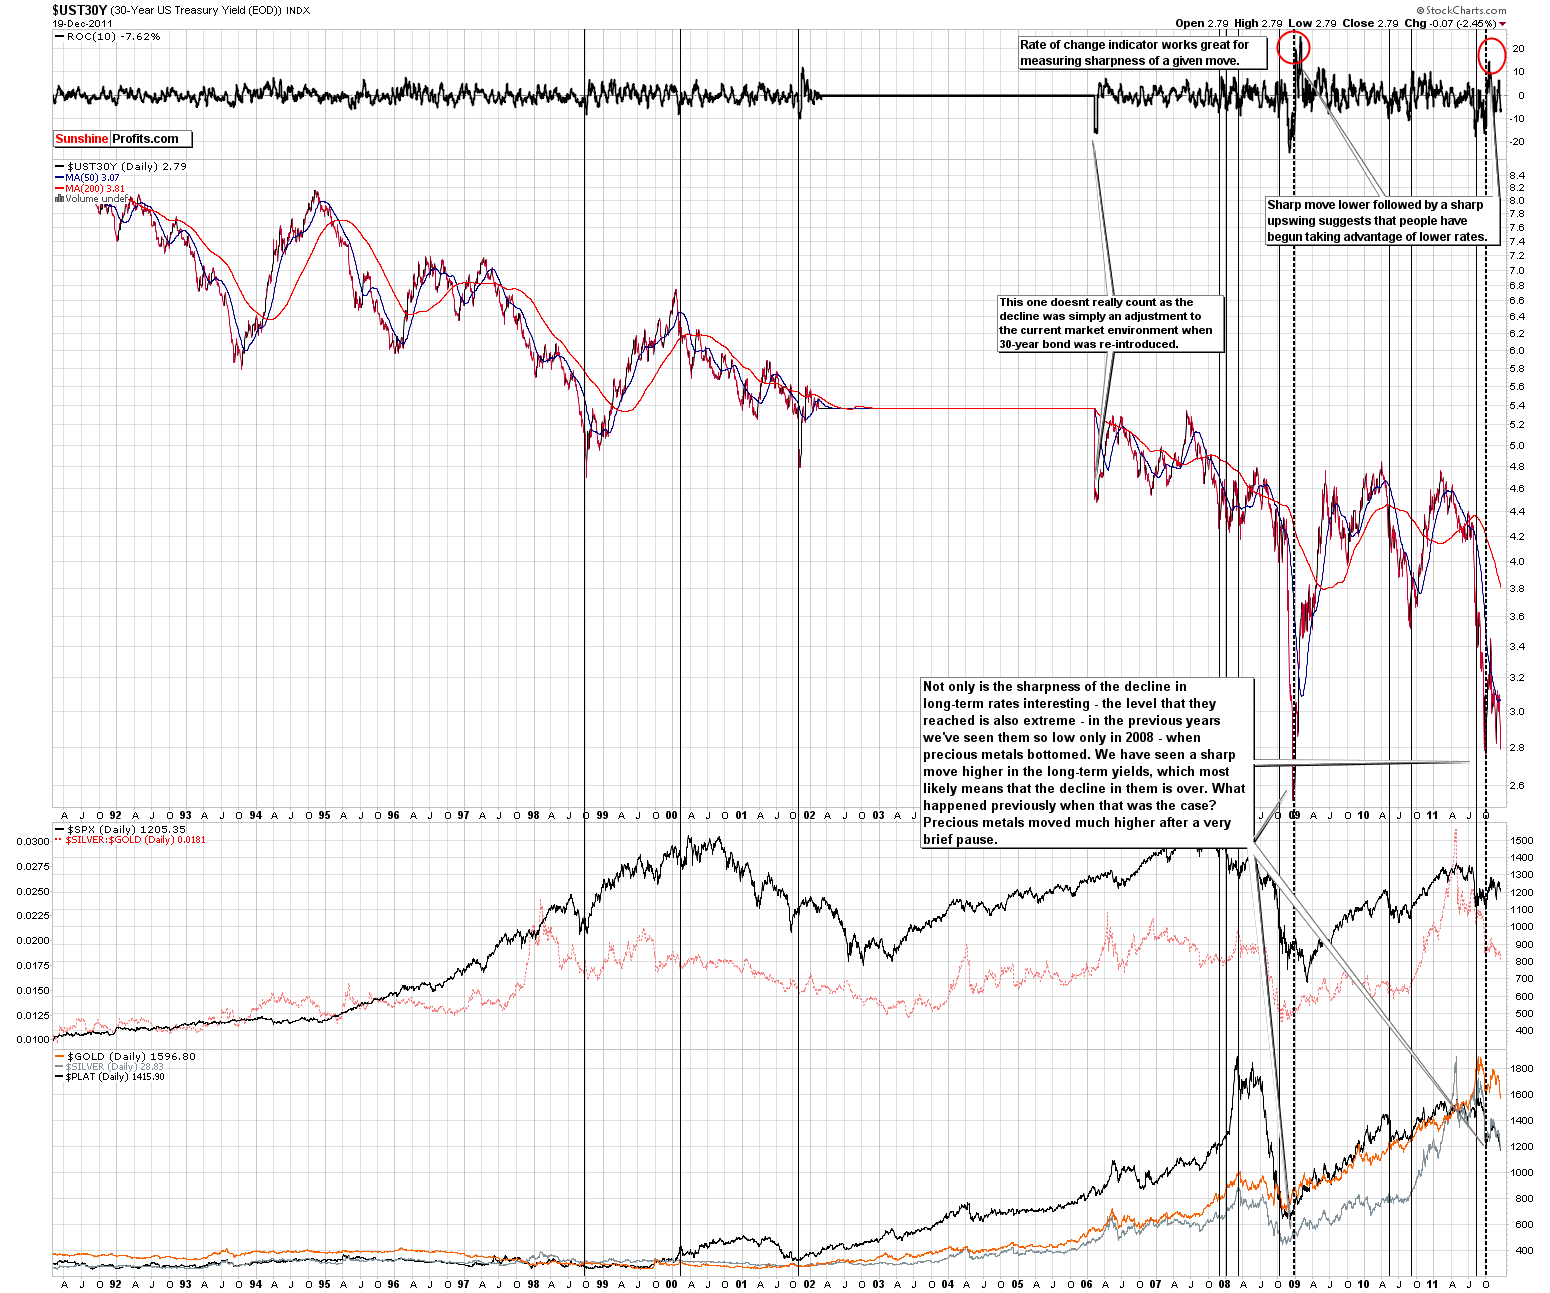
As you can see on the chart above (click to enlarge), the bullish fact is that rates are once again near record lows, which suggests that higher prices are likely to be seen sooner or later in the above-mentioned markets.
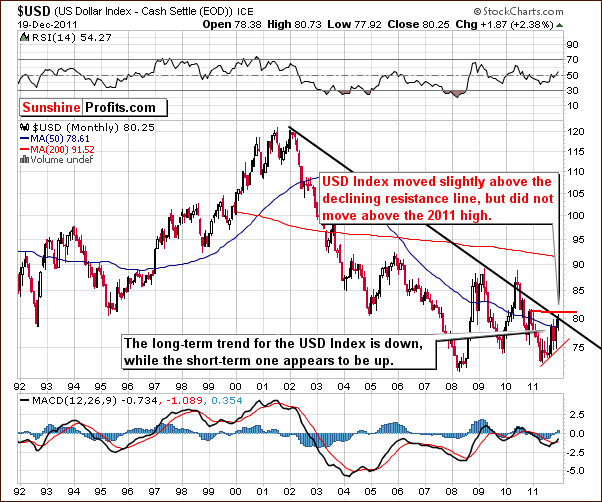
Another "background" chart that we would like to present to you today is the one featuring the USD Index. Actually, there's not that much to discuss here, but we would like to stress that the dollar has not truly broken above the declining long-term resistance line, and it has not moved above the 2011 high. Consequently, one should not be overly bullish on the USD Index just yet.
Having said that, let's move to the main portion of today's update.
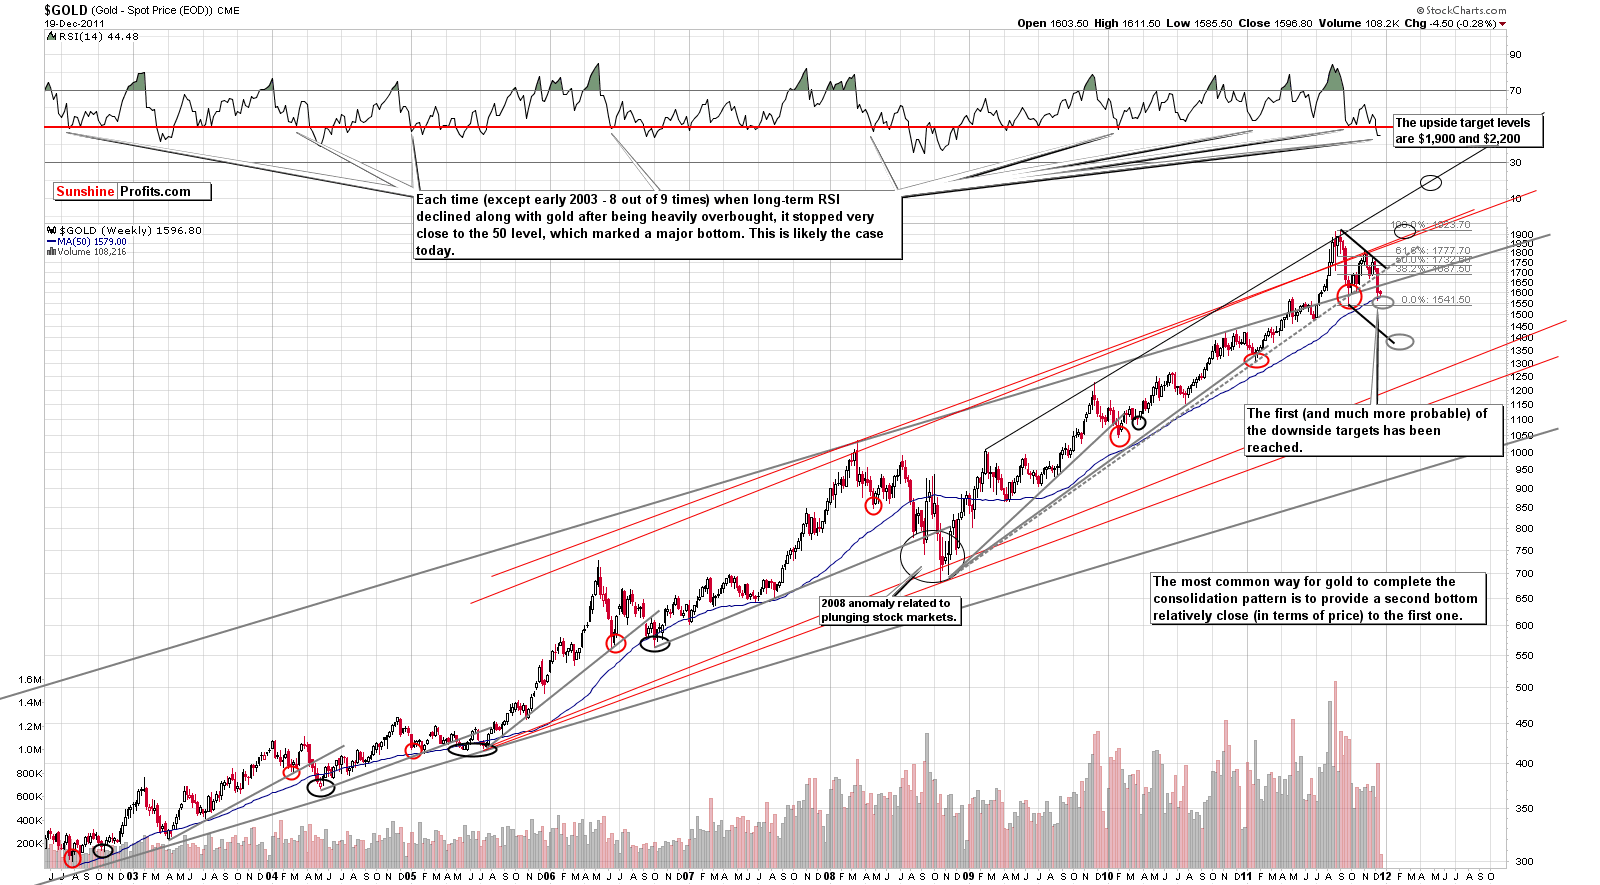
Much has been written recently about gold's breakdown below the rising support line. Some analysts talk about gold's bull market being over because of that. The above chart should provide you with enough proofs to deny this theory. First of all, technical analysis is not something that can decide if a bull market is to continue or not. Yes, it is very useful when determining tops, bottoms and likely price paths, but when it comes to analyzing the very long-term tendencies, we need to consider the fundamental and macroeconomic facts. Did any of the world's economic and political issues were solved recently? No, Europe just bought some time, and nothing else changed. Nothing changed regarding US debt situation, trade and currency “tensions” with China, etc. The fundamental reasons that are responsible for this bull market's existence are still in place.
But, is the technical picture for gold really bearish? No, it's not, and the above chart (please click on the chart to enlarge it) has been created to prove it. One of the reasons is described right on the chart - gold quite often consolidates in a way similar to what we've seen in the past months. We're not in uncharted waters – we're seeing a quite common pattern in play. However, the most important thing – that deals directly with the breakdown mentioned in previous paragraph - is not described on the chart.
The key action that one should do before applying any trading technique is to check if it at least worked in the past. At this moment you might want to take a few seconds and check the bearish gold analyses that you've read recently include chars that cover 10- or at least 5-year time frame. Anyway, this is not the first time that we're seeing a breakdown below a rising medium-term support line. We marked the current support with gray, dotted line. Other gray lines represent analogous lines in the past – the ones that were viewed as key support some time ago. Please take a few moments to examine them and to check what followed the previous “breakdowns”.
What followed was not a plunge that erased the whole bull market. It was not a prolonged consolidation either. The fact is that similar “breakdowns” have been (in all cases seen on the chart) followed by the final bottom of the consolidation (not to far below the line that is has broken), which was in turn followed by a strong rally. In these cases, lower prices were never seen thereafter.
Consequently, from both: fundamental and technical perspectives, gold remains in a bull market, and what we're seeing right now may be the best buying opportunity that we'll see in the following years.
If the above chart doesn't convince you, there's more. Let's see how gold performs relative to corporate bonds.
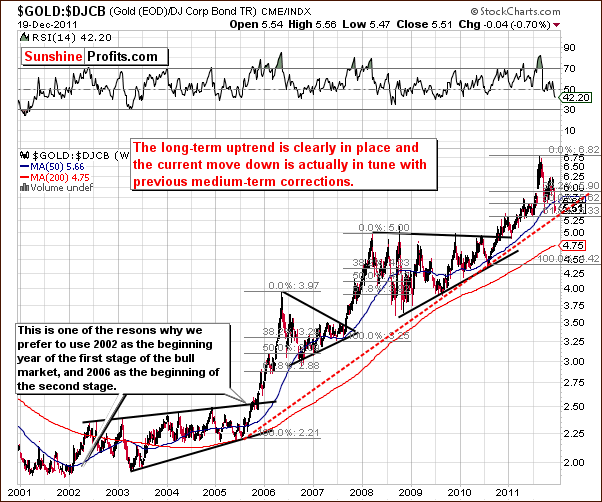
On the above chart we compared the size of the current decline to the previous ones. Again, the recent move down is still in tune with previous price patterns. Please note that the ratio declined about 61.8% of its previous rally – just like in 2006. Moreover, the price is now slightly below the 50-week moving average – just like in 2006. The similarity between these two time-frames is quite striking indeed – please take one more look at the previous chart and compare the shapes of the 2006 and 2011 declines. The implications are clearly bullish.
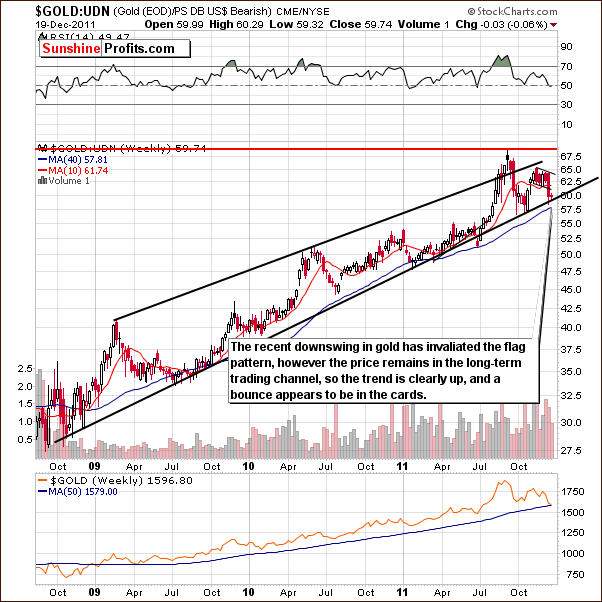
From the non-USD perspective, we see that gold is still within the long-term rising trend channel. The trend is therefore up, not down.
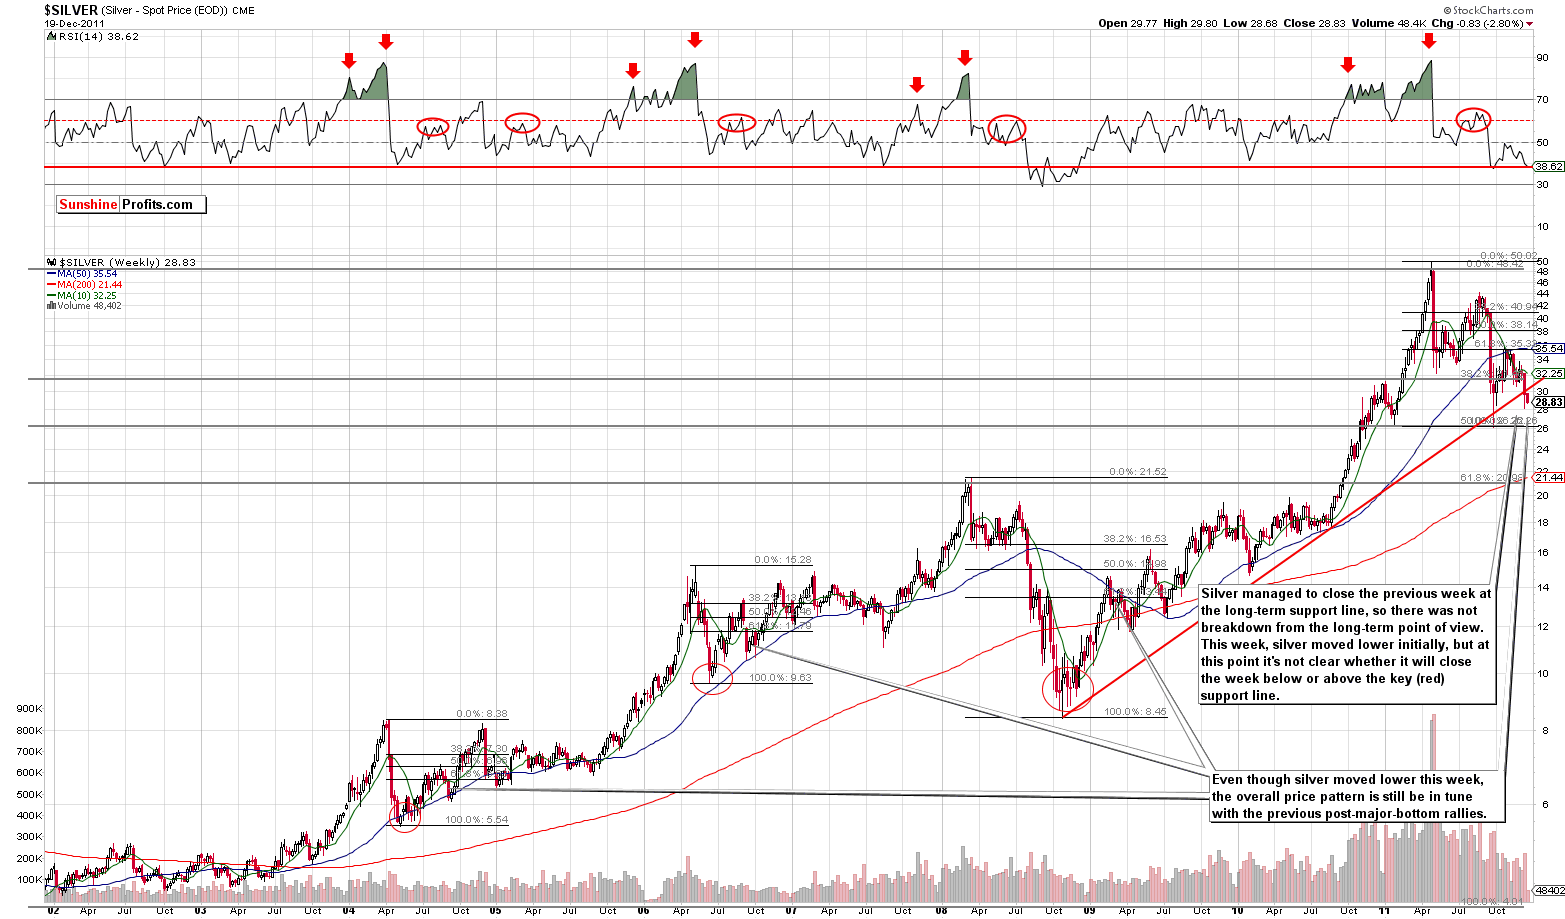
Silver (please click on the chart to enlarge it) doesn't provide us with a bearish picture either. While that is certainly true that silver moved below the rising long-term support line (red) last week, it managed to pull back and close the week right at it. Therefore, no true breakdown has been seen. Silver moved initially lower this week (and is moving back up today), but unless silver closes the week below the red support line seen on the chart above, the situation will remain bullish.
Please keep in mind that silver is right at its long-term cyclical turning point which – combined with the above-mentioned factors – suggests a rally.
The picture for the XAU Index is a bit less bullish.
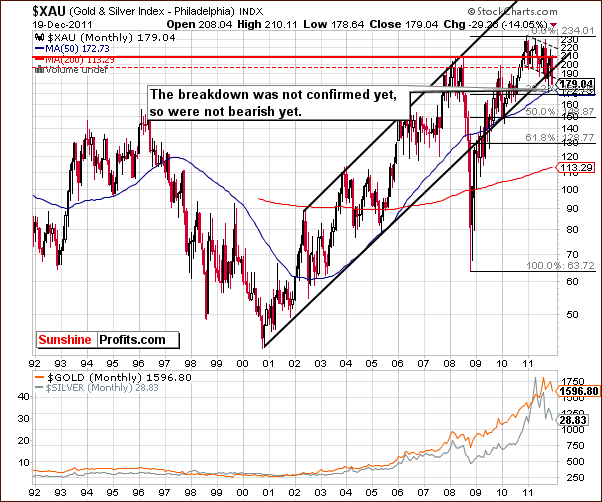
On the above chart we see that the mining stocks have moved slightly below their long-term support line, however the breakdown has not been confirmed. We've seen a similar “breakdown “ just a few months ago that was followed by a sharp rally. Without a confirmation, for example in the form an additional move lower, the above chart will not become truly bearish.
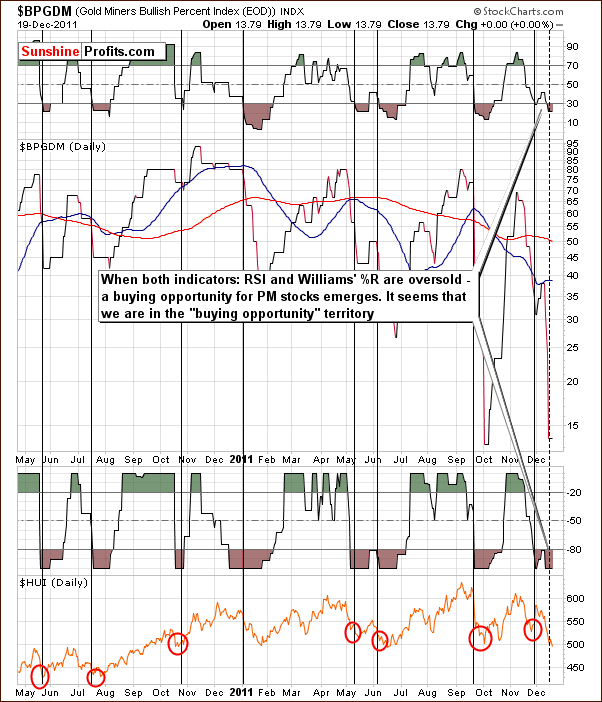
From the short-term perspective, we are clearly in the “buying opportunity” territory. As seen above, both indicators based on the Gold Miners Bullish Percent Index are currently oversold, which is something that we see close to local bottoms.
Finally, let's discuss two of our indicators that have just flashed important signal. The first one is the SP Gold Bottom Indicator.
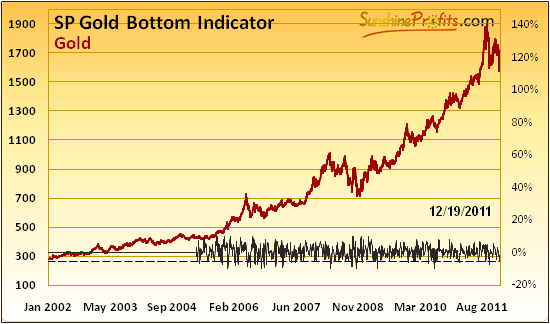
While it's not clearly visible on the above chart (please go to the Premium Charts section and click on it for more detailed view), the indicator moved below its signal (dotted) line. This means that we are at the major, long-term buying opportunity.
The four previous times when we've seen a buy signal (signal line crosses the horizontal dashed line at the bottom of the chart) from this indicator are: 9/27/2011 (the previous major bottom, followed by a $150 rally), 8/26/2011 (right after an important bottom, after which prices rallied over $200), 6/29/2011 (close to $1,500, a few days before a major bottom) and 1/24/2011 (below $1,350, a few days before a major bottom).
On top of that, we have just seen a signal from our SP Gold Stock Extreme Indicator.
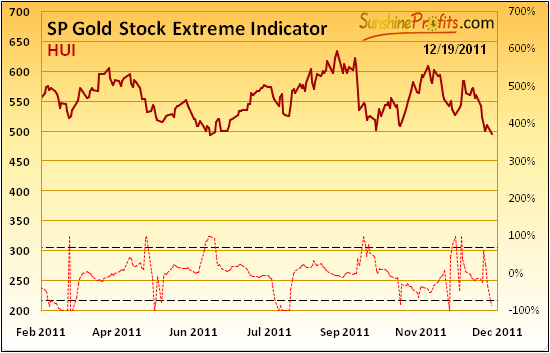
The indicator moved below the lower dashed line, so we have a buy signal.
While the move above the upper dashed line meant a local bottom in 100% of cases since 2008, a move below the lower dashed line did not have the same effect in some cases. In the Nov 2010 - today time frame when the indicator moved below the lower dashed line, declines followed in most cases. The situation would become clearly bullish if we would see a quick move above the upper dashed line in the following days – however this is a confirmation that we don't have right now.
Summing up, the probability of gold moving higher from here (to $1,750) before a big move lower (below $1,550) is seen appears now to be about 70%. A move down to $1,400 or so seems fairly remote with an estimated 10% likelihood at this time. Note that precious metals may move to $1,550 once again, before the rally materializes (and it will not automatically invalidate the above calculations).
Consequently, we believe that betting on a move higher in gold, silver and mining stocks is once again a good idea. In other words, we believe that opening speculative long positions in the precious metals sector right now is a good idea. We will be monitoring the markets for signs of weakness, and will report to you accordingly.
As far as long-term investments are concerned, we continue to believe that being invested is a good idea. If you had sold your long-term investments recently, we strongly suggest getting back into the market.
On a side note, we received a few interesting questions this week (thank you) – we apologize for not being able to include replies in this update, but we would like to post this update (and sent out notifications) as soon as possible. However, we can tell you that we've examined all received questions and even though we did not provide detailed replies, we have taken them into account while preparing the above analysis.
Thank you.
Przemyslaw Radomski

