Briefly: In our opinion, full (150% of the regular full position) speculative short positions in gold, silver and mining stocks are justified from the risk/reward perspective at the moment of publishing this alert.
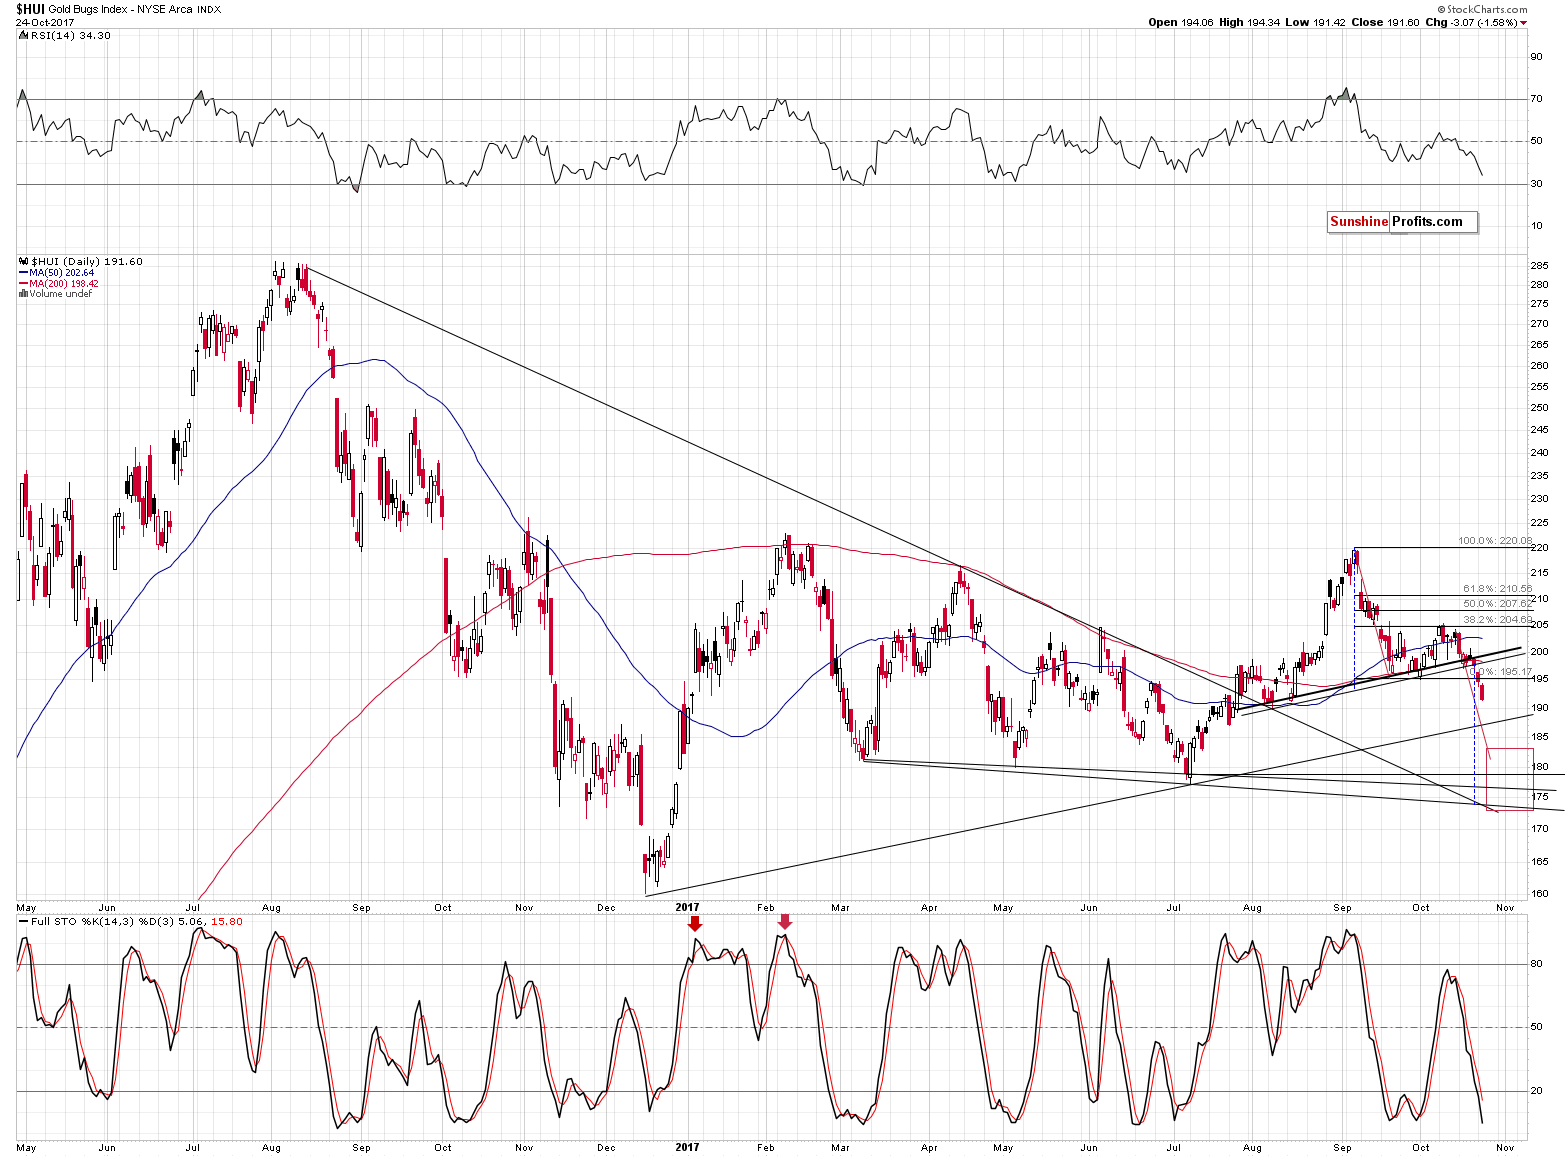
In yesterday’s alert we emphasized the importance of the current signal coming from gold stocks and yesterday’s session further confirmed it. The strength of the signal is now so significant that we need to adjust the price target for the miners for the following days. Namely, we need to move it lower. Let’s take a look at the HUI Index chart for details (chart courtesy of http://stockcharts.com).

Gold stocks closed below the neck level of the head and shoulders formation for the third consecutive time, so the bearish implications are now fully confirmed. The target price based on this formation is the size of the head applied to the breakdown level, which we applied on the above chart through the dashed blue lines. The price target that this technique provides is a little below 175.
Interestingly, this target coincides with the declining support line based on the March and July lows, which makes the proximity of 175 an even stronger support.
The previously broken declining support line (based on the August 2016, April 2017 and June 2017 tops) is currently also close to the 175 level, which strengthens the latter even further.
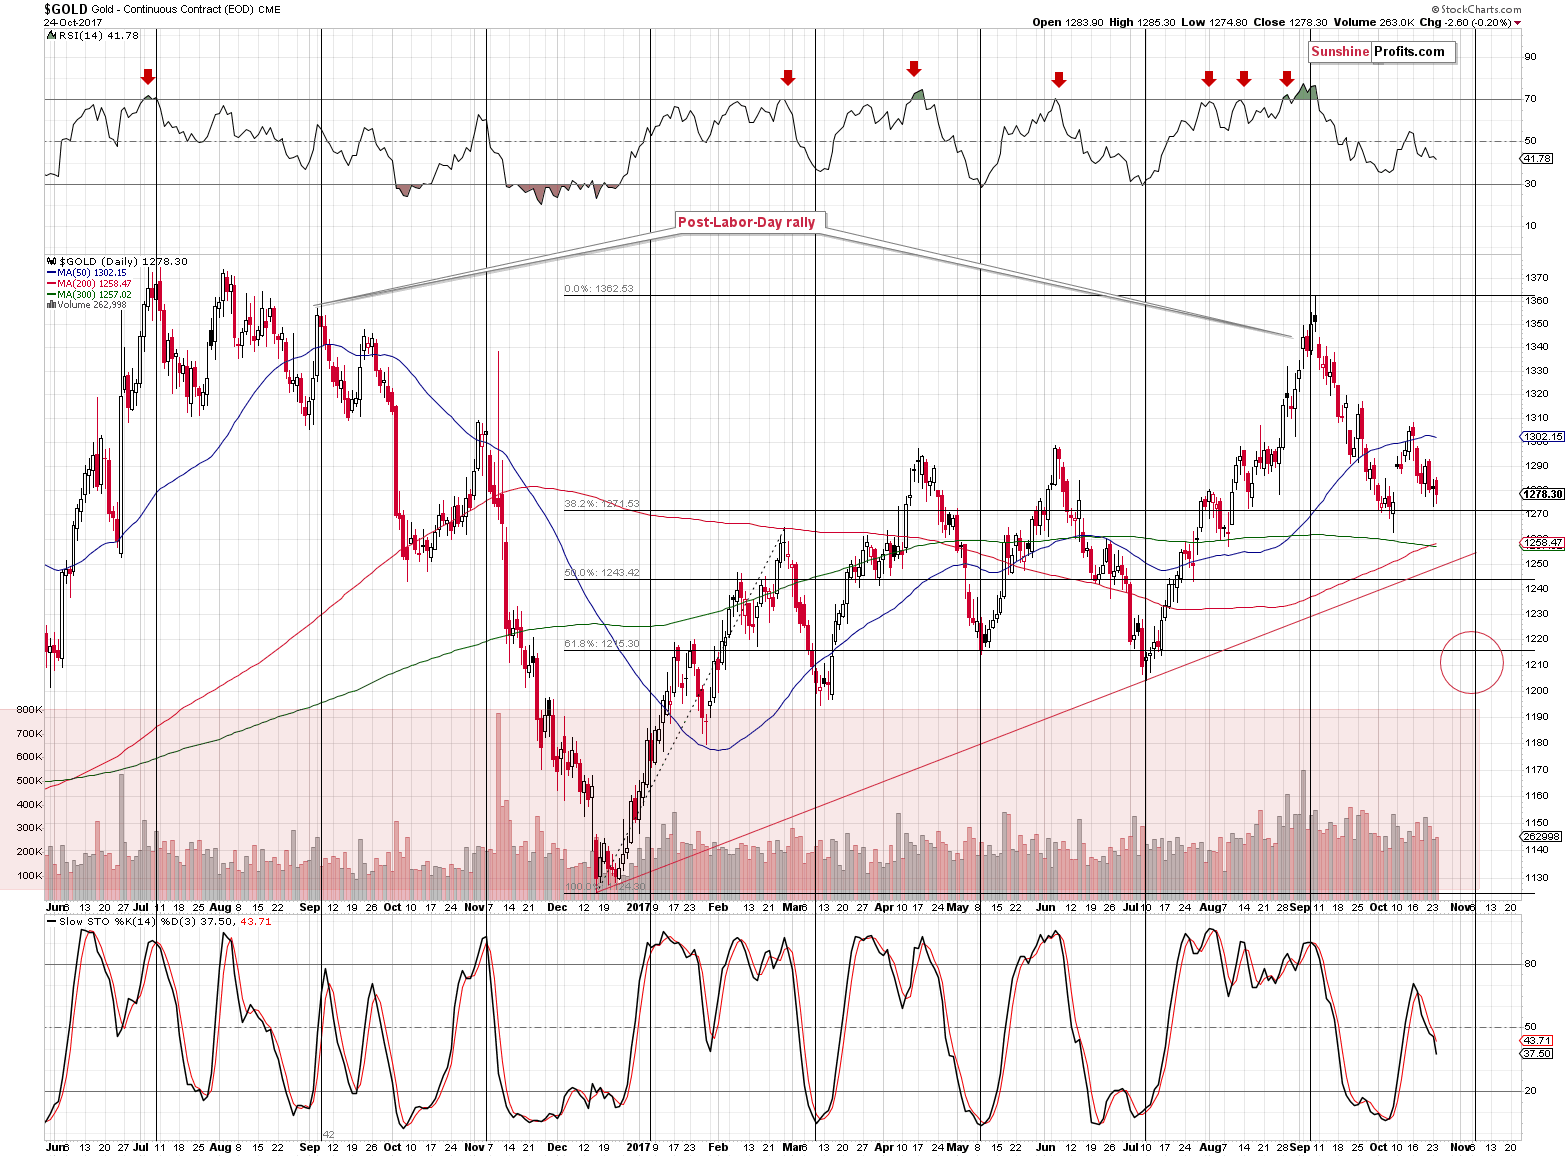
However, the possibility of a rebound from the 175 level is not the only thing that makes it likely. The other factors are the pace of decline (if gold stocks continue to decline as they have done in the past several days, they will reach the 175 level in early November, which is right at gold’s turning point) and the price link to gold.

In order to reach its target price, gold would have to decline more or less about as much as it already has since early September, or a little less than that. If the HUI Index declined as much as it has since early September, it would be below 170. The 175 level corresponds to the mentioned “little less than that” analogy – it’s not precise, but it fits.
Most importantly, however, the above shows that miners most likely need to fall further than to the 187 level or so (the rising support line based on the December 2016 and July 2017 lows).

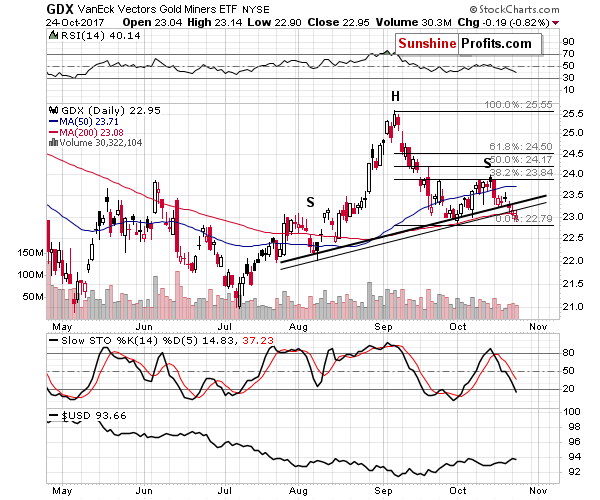
In yesterday’s alert we wrote that the GDX ETF chart showed that the volume was not low, so the decline was likely the true direction, in which miners are currently heading. Today, we can say exactly the same thing.
In yesterday’s alert we followed-up on the price of gold in terms of the Japanese yen and in today’s alert we would like to remind you about another long-term factor that remains in place and that has implications even more profound and more bearish than the ones discussed yesterday.

Namely, the analogy to the to the situation just before the biggest slide of the recent past remains in place. We don’t want to quote the entire article here, but since it remains up-to-date, please read it if you haven’t done so already.
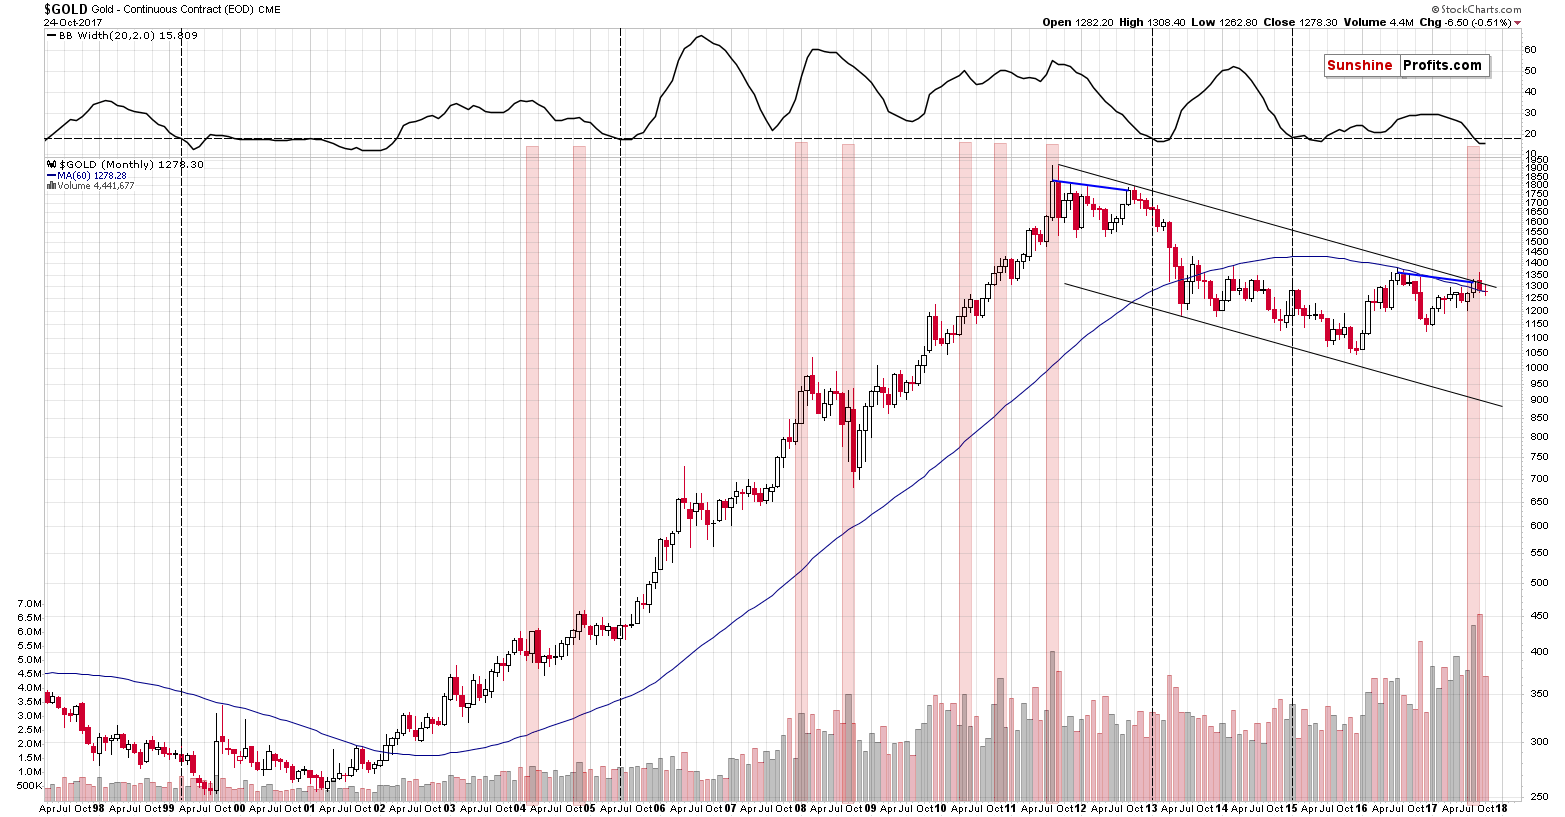
Today, we would not only like to add that the analogy to what happened after the last 2012 top remains in perfect tune – we would also like to say that the sharpest part of the 2013 decline started when the Bollinger Band’s width stopped narrowing. The above is easier to observe when it’s in the form of an indicator, so we put it in the upper part of the above chart as such.
October is not over yet, but since there are only five more sessions remaining, it doesn’t seem that a lot will change from the long-term point of view. Consequently, it seems that we are about to see a halt in the narrowing of the Bollinger Band’s width. In light of what followed back in 2013, the implications are profoundly bearish.
You know what else happened in 2013 right before the sharpest part of the slide? Mining stocks were underperforming to a great extent – they were even declining on their own. Well, that was what we’ve been writing about for most of today’s alert. The implications are clearly bearish for the following months.
Summing up, the outlook for the precious metals market remains bearish for the following months and weeks and there are multiple signs that confirm it: gold’s huge monthly volume, the analogy in the HUI Index, the analogy between the two most recent series of interest rate hikes, the breakout in Nikkei and the RSI signal from gold priced in the Japanese yen.
As far as the following weeks are concerned, it seems that we could see another rebound during the decline, but not likely until gold moves to the $1,200 - $1,220 range, which is likely to take place in the first half of November. The analogous range for the USD Index is 95.5 – 96.5 with the 96 level being the most likely target.
As always, we will keep you – our subscribers – informed.
To summarize:
Trading capital (supplementary part of the portfolio; our opinion): Short positions (150% of the full position) in gold, silver and mining stocks are justified from the risk/reward perspective with the following stop-loss orders and exit price levels / profit-take orders:
- Gold: exit price: $1,218; stop-loss: $1,366; exit price for the DGLD ETN: $51.98; stop-loss for the DGLD ETN $38.74
- Silver: exit price: $15.82; stop-loss: $19.22; exit price for the DSLV ETN: $28.88; stop-loss for the DSLV ETN $17.93
- Mining stocks (price levels for the GDX ETF): exit price: $21.23; stop-loss: $26.34; exit price for the DUST ETF: $29.97; stop-loss for the DUST ETF $21.37
In case one wants to bet on junior mining stocks' prices (we do not suggest doing so – we think senior mining stocks are more predictable in the case of short-term trades – if one wants to do it anyway, we provide the details), here are the stop-loss details and exit prices:
- GDXJ ETF: exit price: $30.28; stop-loss: $45.31
- JDST ETF: exit price: $66.27; stop-loss: $43.12
Long-term capital (core part of the portfolio; our opinion): No positions (in other words: cash)
Insurance capital (core part of the portfolio; our opinion): Full position
Important Details for New Subscribers
Whether you already subscribed or not, we encourage you to find out how to make the most of our alerts and read our replies to the most common alert-and-gold-trading-related-questions.
Please note that the in the trading section we describe the situation for the day that the alert is posted. In other words, it we are writing about a speculative position, it means that it is up-to-date on the day it was posted. We are also featuring the initial target prices, so that you can decide whether keeping a position on a given day is something that is in tune with your approach (some moves are too small for medium-term traders and some might appear too big for day-traders).
Plus, you might want to read why our stop-loss orders are usually relatively far from the current price.
Please note that a full position doesn’t mean using all of the capital for a given trade. You will find details on our thoughts on gold portfolio structuring in the Key Insights section on our website.
As a reminder – “initial target price” means exactly that – an “initial” one, it’s not a price level at which we suggest closing positions. If this becomes the case (like it did in the previous trade) we will refer to these levels as levels of exit orders (exactly as we’ve done previously). Stop-loss levels, however, are naturally not “initial”, but something that, in our opinion, might be entered as an order.
Since it is impossible to synchronize target prices and stop-loss levels for all the ETFs and ETNs with the main markets that we provide these levels for (gold, silver and mining stocks – the GDX ETF), the stop-loss levels and target prices for other ETNs and ETF (among other: UGLD, DGLD, USLV, DSLV, NUGT, DUST, JNUG, JDST) are provided as supplementary, and not as “final”. This means that if a stop-loss or a target level is reached for any of the “additional instruments” (DGLD for instance), but not for the “main instrument” (gold in this case), we will view positions in both gold and DGLD as still open and the stop-loss for DGLD would have to be moved lower. On the other hand, if gold moves to a stop-loss level but DGLD doesn’t, then we will view both positions (in gold and DGLD) as closed. In other words, since it’s not possible to be 100% certain that each related instrument moves to a given level when the underlying instrument does, we can’t provide levels that would be binding. The levels that we do provide are our best estimate of the levels that will correspond to the levels in the underlying assets, but it will be the underlying assets that one will need to focus on regarding the signs pointing to closing a given position or keeping it open. We might adjust the levels in the “additional instruments” without adjusting the levels in the “main instruments”, which will simply mean that we have improved our estimation of these levels, not that we changed our outlook on the markets. We are already working on a tool that would update these levels on a daily basis for the most popular ETFs, ETNs and individual mining stocks.
Our preferred ways to invest in and to trade gold along with the reasoning can be found in the how to buy gold section. Additionally, our preferred ETFs and ETNs can be found in our Gold & Silver ETF Ranking.
As a reminder, Gold & Silver Trading Alerts are posted before or on each trading day (we usually post them before the opening bell, but we don't promise doing that each day). If there's anything urgent, we will send you an additional small alert before posting the main one.
=====
Latest Free Trading Alerts:
Gold comes from the merger of neutron stars. How cool is that?
Gold Comes from Neutron Star Collision
=====
Hand-picked precious-metals-related links:
PRECIOUS-Talk of Fed succession pushes gold to 2-1/2 week low
Investors Are Dumping This Silver ETF at the Fastest Pace Since 2011
=====
In other news:
Dollar lifted by Fed leadership talk, shares tread water
U.K. Growth Surprise Clears Path for Bank of England Rate Rise
First UK interest rate rise in a decade still likely despite modest growth
ECB's Follow-the-Fed Strategy Set to Change on QE Exit Road
Bitcoin Retreats as Another Cryptocurrency Offshoot Appears
Transitional Brexit deal must be agreed this year, City warns government
India just said it's pumping $32 billion into its banks — here's why it matters
=====
Thank you.
Sincerely,
Przemyslaw Radomski, CFA
Founder, Editor-in-chief, Gold & Silver Fund Manager
Gold & Silver Trading Alerts
Forex Trading Alerts
Oil Investment Updates
Oil Trading Alerts


