Briefly: in our opinion, full (300% of the regular position size) speculative short positions in junior mining stocks are justified from the risk/reward point of view at the moment of publishing this Alert.
Gold moved a bit up on Friday, and gold moved a bit down in today’s pre-market trading. And silver once again failed to hold above $24. Did anything actually change?
Yes! The breakout above the $1,900 and 61.8% Fibonacci retracement levels in gold was confirmed, which is bullish.
Yup, that’s a fact, and there’s no denying it. However, does this single bullish fact change the outlook? I don’t think so. Here are a few major reasons why.
The most important one comes from gold’s very long-term chart.
I wrote about the key long-term fact a week ago:
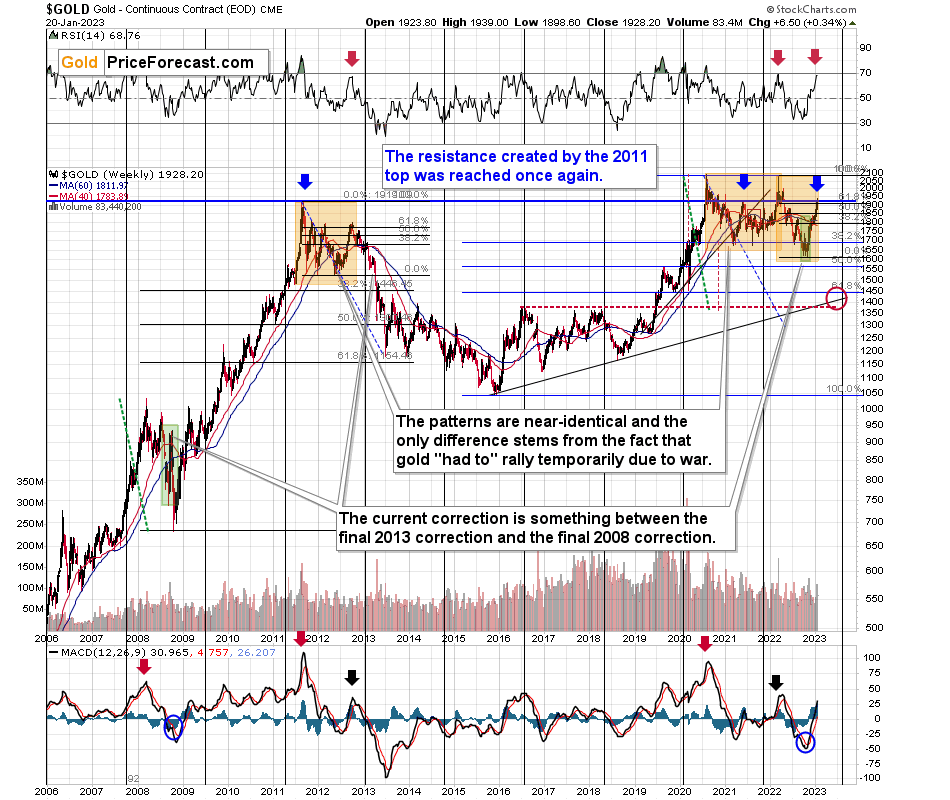
Do you know what levels gold has recently reached? Hint: those are very, very, very important price levels…
Gold just once again reached its 2011 high. The one that triggered reversals either immediately or after an additional rally (but it took a war outbreak in Europe to push gold temporarily (!) above this level). Therefore, the importance of this long-term resistance can’t be overstated.
That’s one thing. Another thing is that, given the major fundamental event that I already mentioned above (the war outbreak), it’s possible for the technical patterns to be prolonged and perhaps even repeated before the key consequence materialized. Similarly to the head-and-shoulders pattern that can have more than one right head before the breakdown and slide happen.
In gold’s case, this could mean that due to the post-invasion top, the entire 2011-2013-like pattern got two major highs instead of one. And thus, the initial decline and the subsequent correction are pretty much a repeat of what we saw in 2020 and early 2021, as well as what we saw in 2011 and 2012.
The particularly interesting fact (!) about the correction that we saw after the 2011-2012 decline (the one that was followed by the huge 2012-2013 decline) is that during it, gold corrected slightly more than 61.8% of the preceding medium-term decline. Consequently, the current situation is just like what happened back then.
And if all the above wasn’t bearish enough, please take a look at the reading of the RSI indicator based on the weekly price changes. It’s now just below 70, and guess where it was at the final top before the 2012-2013 slide? Yes, it was exactly there, too.
That’s also approximately where the RSI was at last year’s top.
Taking all the above into account clarifies that despite Friday’s and the last few weeks’ rallies, the medium-term outlook remains very bearish. Of course, that’s just my opinion, and please feel free to do with your capital what you see fit, but I’m keeping my money where my mouth is and I’m keeping my short position in junior mining stocks intact. All of last year’s trades were profitable, and, while I can’t promise any kind of performance, in my opinion the current one will become profitable (very profitable, actually) as well.
Since gold moved up by just $6.50 last week, the entire above quote remains up-to-date, and so do its bearish implications.
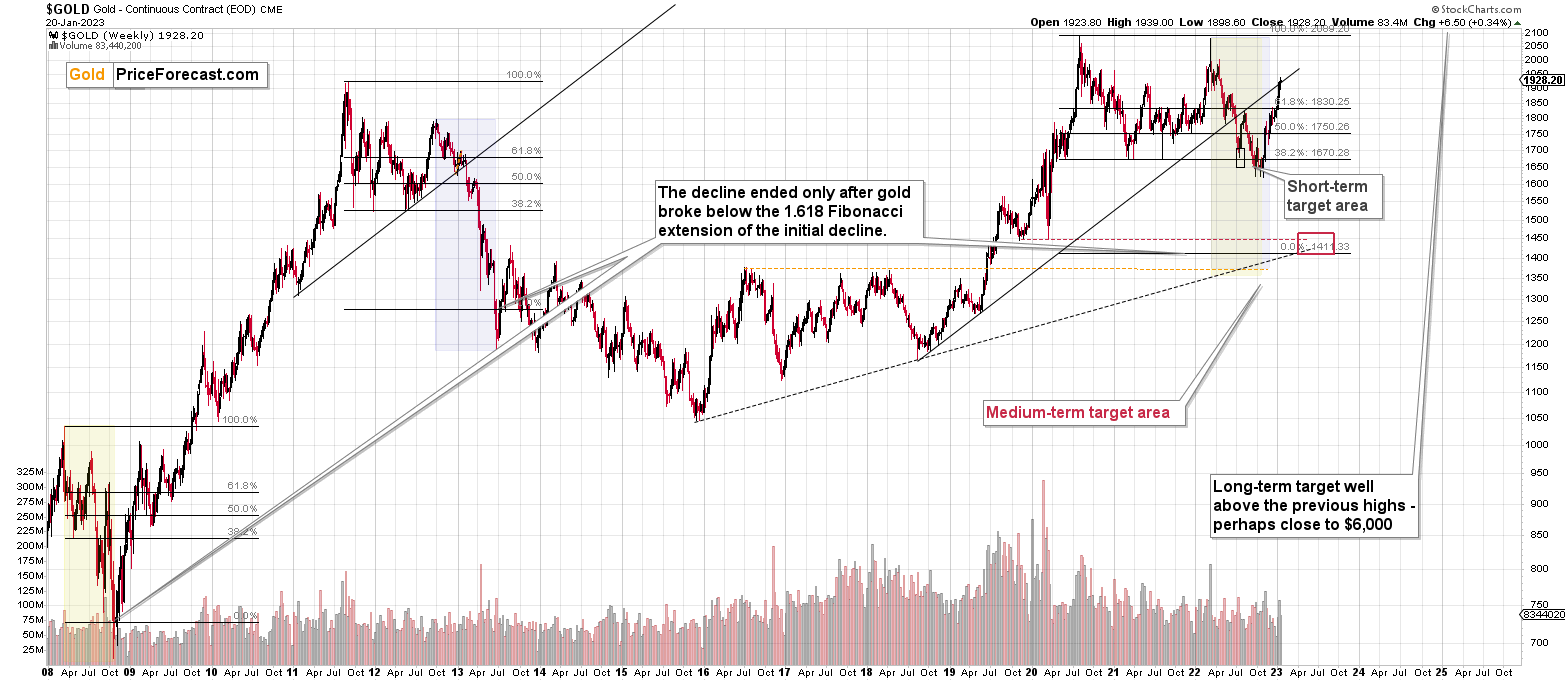
There’s also one more very important resistance level that gold reached that you already saw, but that I didn’t write about. It’s clearly visible on the chart from the “Upcoming…” section that I’m posting in each Gold Trading Alert.
Namely, gold moved to its rising resistance line based on the initial two bottoms of the rally. The important thing about this line is that it has already worked twice: once as support in early 2022 and then as resistance shortly thereafter. It’s now working as resistance once again.
So, these are two important long-term-based bearish indications, and one of them sheds extra light on gold’s move above the 61.8% Fibonacci retracement, pretty much nullifying its bullishness.
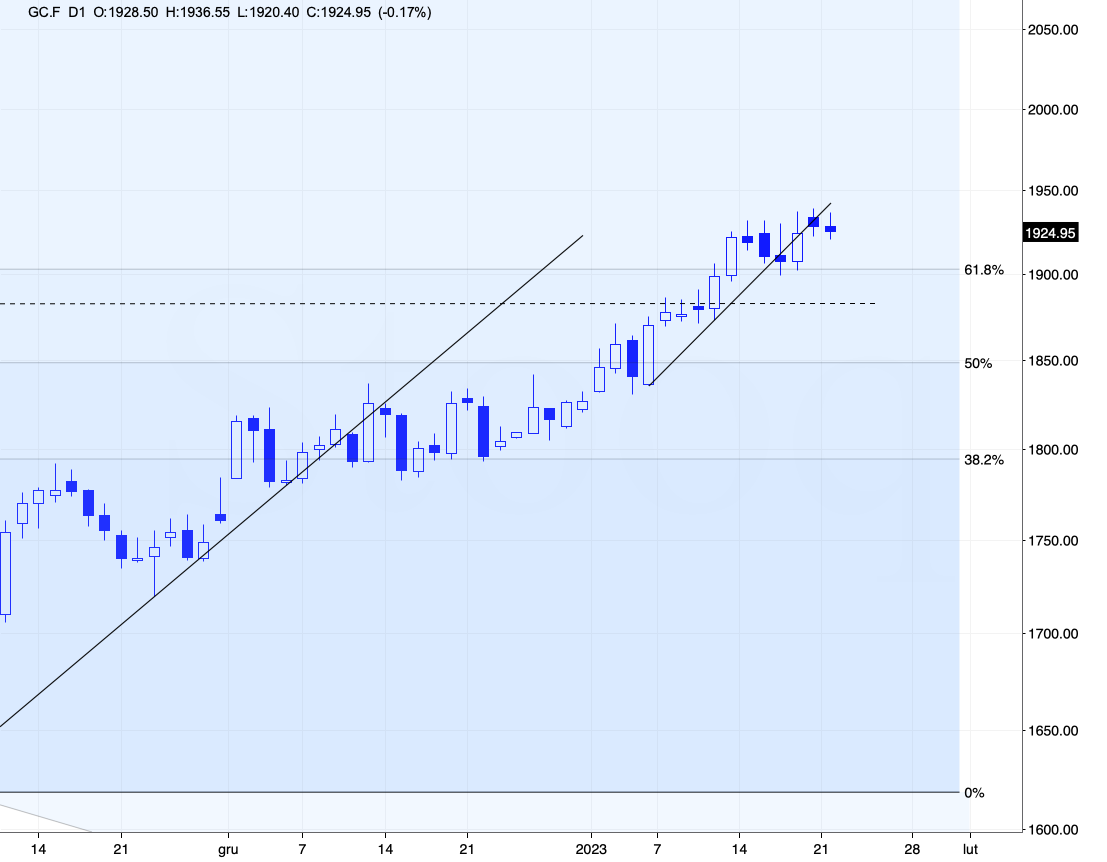
Looking at gold from a different – very short-term – angle reveals that while the moves above $1,900 and the 61.8% Fibonacci retracement were confirmed, the breakdown below the rising support line was also confirmed.
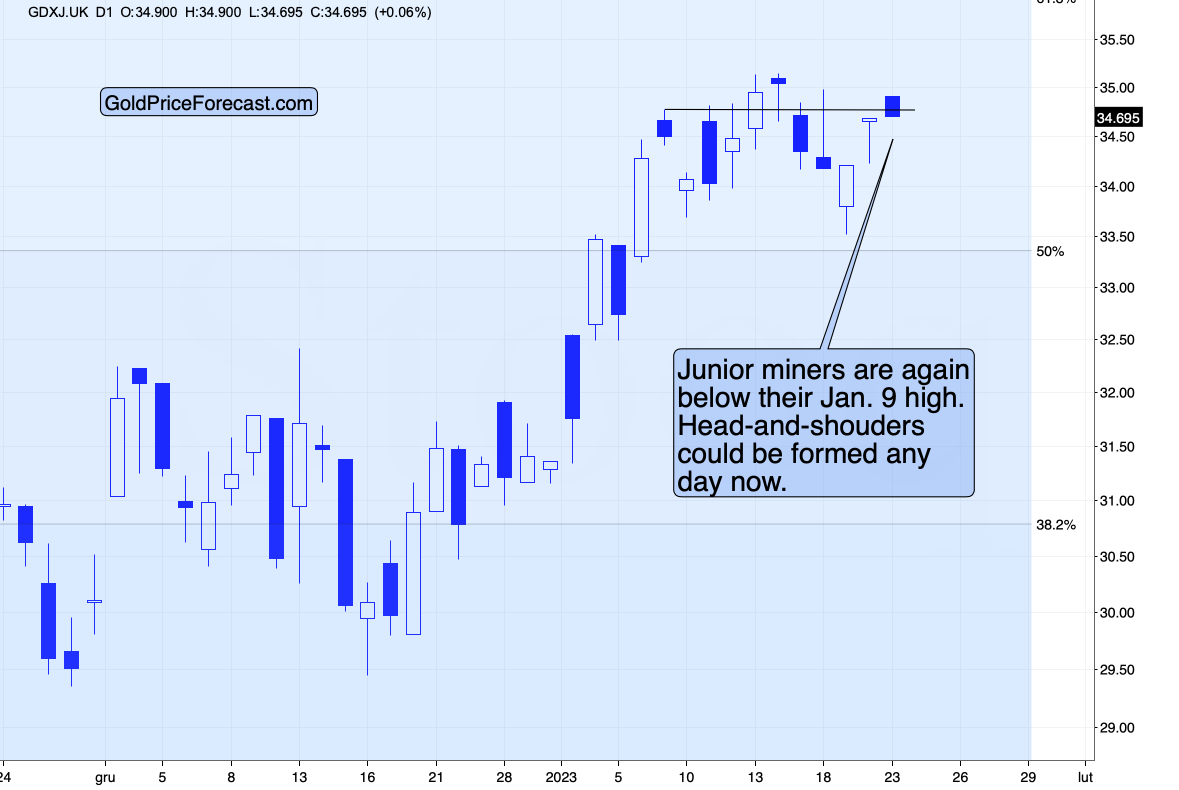
Additionally, gold miners continue to underperform gold. The latter moved to a new intraday high on Friday, but here’s what the GDXJ ETF did.
It didn’t reach new highs. Instead, it moved up and back down. Right now, the GDXJ ETF (in today’s London trading) is below its Jan. 9 high, which doesn’t bode well for the precious metals sector. As I have written many times before, miners’ underperformance means that they are likely leading gold lower.
Besides, if the GDXJ moves lower here, it will create a head and shoulders pattern, where the Jan. 9 high was the left shoulder. This pattern is a topping pattern.
So, all in all, the technical picture for the precious metals sector remains supportive of lower mining stock values in the following weeks and months.
Before moving to the fundamental part of today’s analysis, I’d like to interject a personal note.
Personal Note
On a personal note, I would like to apologize for not being more active in the comments feed below articles lately. The reply to all questions that effectively mean “do you still think that junior miners are going to decline significantly?” is “ yes, I continue to think so, and you’re reading daily updates on that in the Gold Trading Alerts – I will say exactly the same thing in the analysis, in the comment feed, over the phone, in the video, and in person :).”
The transition from Sunshine Profits to Golden Meadow is underway, and since the shift is much bigger than what you saw so far, it requires quite a substantial amount of planning and leadership. Since about 1/3 of the plans are still mostly inside my head, I’m still required to participate personally, even though my brilliant directors take care of most things.
I’m also relocating to a different apartment, and it takes quite a lot of time to review them and pick something great (you don’t want echo in my videos while I’m recording from my home office, right?).
I’m also engaged in a public speaking course, which ends in late March and on top of that, on Friday, I started… studying at Stanford University. You will find more about the Applied Compassion Training that I just joined over here: https://www.appliedcompassionacademy.com (scroll down that page for a familiar face). I’m the first person with the Chartered Financial Analyst designation to ever join the program. For my Capstone Project which I’ll be realizing throughout the year, I plan to create a special course for Golden Meadow that helps to facilitate connections (authors-investors and investors-investors) and conversations and make them even more based on common goals, growth, and compassion than is the case right now. So, yes, I really do want to transform the way investment newsletters and investment education works.
Will Higher Inflation Lead to a Lower Gold Price?
While inflation cooled in recent months, as recession fears rocked risk assets in September and October, the pessimism turned to optimism, and the anxiety has reversed. In the process, the PMs have rallied alongside other risk assets, and the developments loosened financial conditions and helped spur more inflation. To explain, we wrote on Dec. 14:
When a hawkish Fed creates recession anxiety, asset prices fall, which helps reduce inflation. In contrast, when a dovish Fed (or the perception of one) reduces recession anxiety, asset prices rally, which spurs more inflation. That’s why we wrote investors’ hopes for a dovish pivot actually reduce the chances of one occurring.
To that point, with the crowd misunderstanding the relationship between financial conditions and inflation, Bank of America warned on Jan. 20 that the pivot narrative should come under pressure in the months ahead.
Please see below:
To explain, Bank of America’s Chief Investment Strategist Michael Hartnett told clients on Jan. 20 that China’s reopening will uplift commodity demand and help reverse the energy-driven Consumer Price Index (CPI) decline that materialized recently.
Second, while we’ve warned for many months that a resilient U.S. labor market is bullish for wage inflation, Hartnett noted that rate-cut optimism is premature. He wrote:
While markets are bullishly trading two more quarter-point Fed hikes and 200 basis points of cuts over 18 months, a “super-tight labor market (<200k on initial claims) + renewed rise (in) commodity prices (China reopen + MAD geopolitics in Russia/Ukraine)” could lead to a couple of higher-than-expected CPI prints that reverse investors’ expectations for rate cuts.
As a result, while the crowd misses the link between their optimism and its impact on other markets, the December and January sanguinity should have hawkish implications in the months ahead.
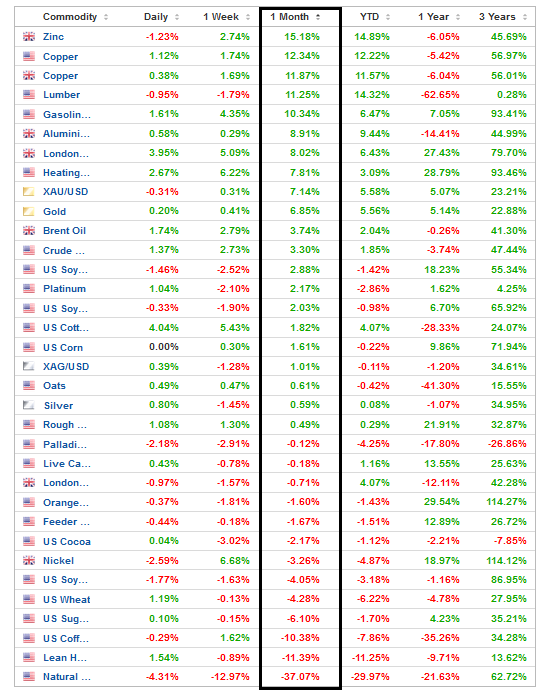
Please see below:
To explain, the black rectangle above shows how several commodities have rallied over the last month, which should put upward pressure on the headline CPI. Furthermore, when China’s reopening gains steam and with Europe escaping the worst of its energy crisis, the outlook for global growth increased; and as economically-sensitive commodities benefit, the backdrop supports a higher peak U.S. federal funds rate (FFR) than what’s priced in.
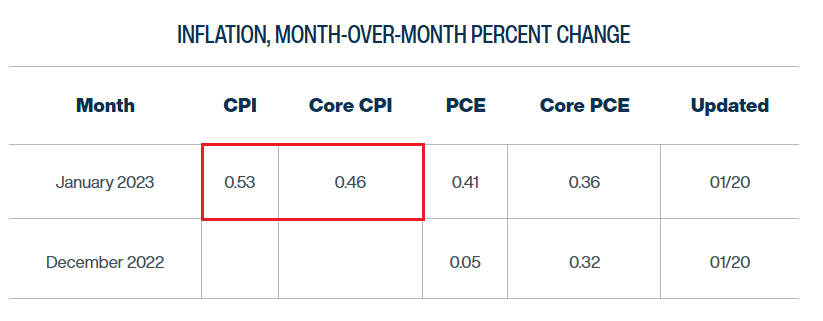
Please see below:
To explain, the Cleveland Fed expects the headline and core CPIs to increase by 0.53% and 0.46% month-over-month (MoM) in January, which annualize to 6.5% and 5.7% year-over-year (YoY), respectively.
Now, analyzing MoM inflation will be useful going forward, as monthly changes allow for annual estimates of where YoY inflation will go if the current trends persist. Therefore, with these MoM figures well beyond what’s needed for the Fed to reach its 2% mandate, the implications are profoundly hawkish.
To put it in context, 2% annual inflation requires MoM prints of less than 0.17%. So, with the current data tracking well above that, a pivot contrasts fundamental logic. As it stands, while we’ve stated this on numerous occasions, a pivot only occurs if the economic data collapses. But, with that far from the current backdrop, the outlook remains highly bullish for the FRR.
As further evidence, we warned on Dec. 14 that recession anxiety drove energy prices lower and made the short-term inflation outlook bearish. We wrote:
The recent decline in oil prices was driven by investors’ misguided fears of an imminent recession. In a nutshell: if the global economy is on the brink of collapse, demand for oil should suffer mightily.
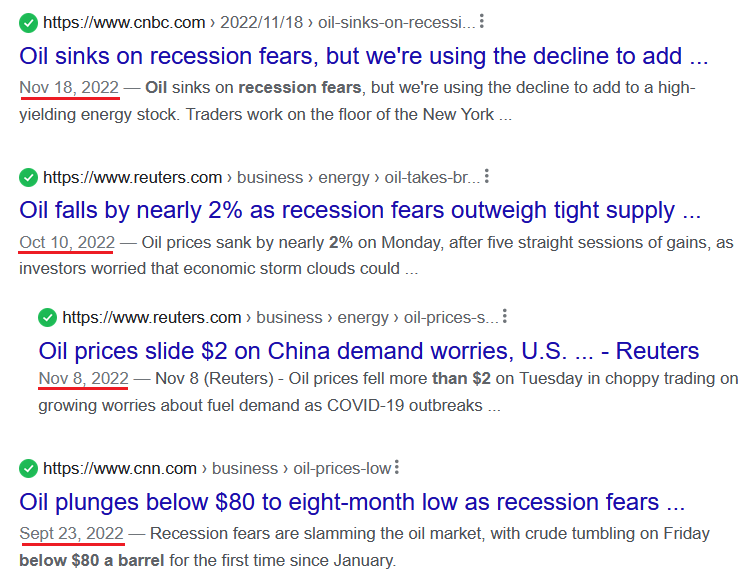
Please see below:
To explain, the various headlines above depict the recession sentiment confronting the oil market since late September. As you can see, “recession fears” have been making the rounds, and these fears helped reduce oil prices, which helped reduce the headline CPI.
Yet, with that pessimism reversing recently, the commodity comeback is bullish for MoM inflation.
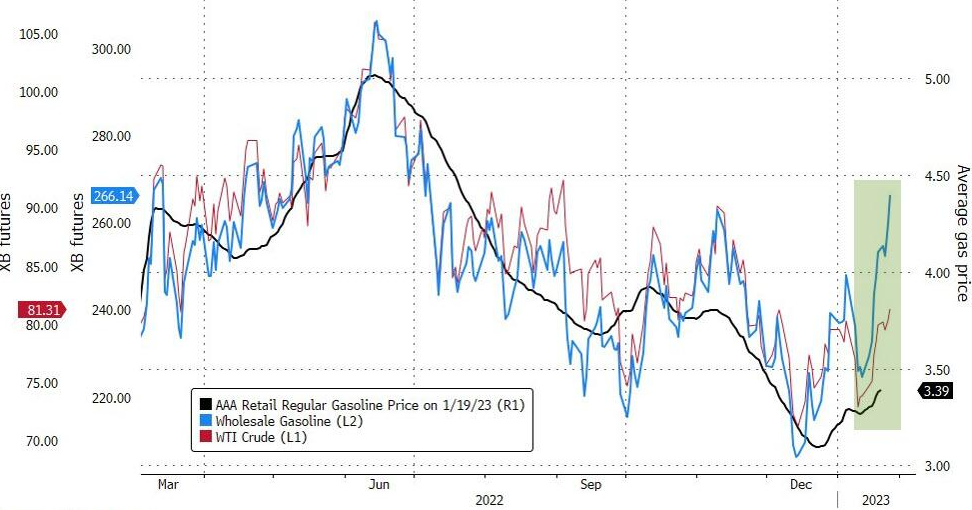
Please see below:
To explain, the red line above tracks the crude oil price, while the blue and black lines above track the wholesale and retail gasoline prices. If you analyze the performances, you can see that all three have declined sharply from their summer peaks, and unsurprisingly, the plunges in December culminated with weak inflation prints.
Conversely, the right side of the chart shows that all three have bounced in January, and China’s reopening should only spur more demand. Consequently, while we’ve warned that inflation does not fall linearly, the more the crowd prices in a pivot, the less likely it is to occur.
Again, a major collapse in GDP growth and employment is the bare minimum for rate cuts; and even the 1970s/1980s showed that the FFR kept rising during three of the four inflation-led recessions. So, with economic growth and employment still resilient and the short-term inflation outlook reversing, our medium-term thesis remains on track.
Please see below:
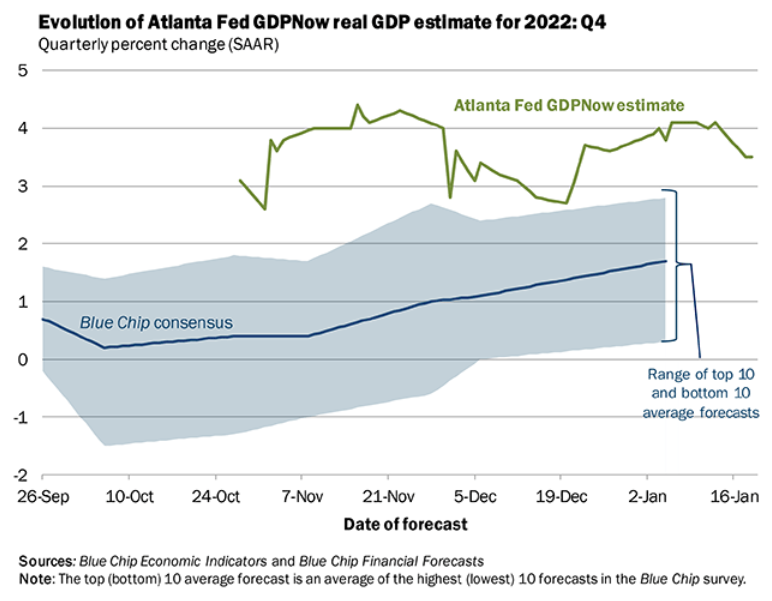
To explain, the Atlanta Fed updated its Q4 real GDP growth estimate on Jan. 20. The report stated:
“The GDPNow model estimate for real GDP growth (seasonally adjusted annual rate) in the fourth quarter of 2022 remains 3.5 percent on January 20. The nowcast was unchanged after rounding following this morning's report from the National Association of Realtors.
“This is the last GDPNow forecast for the fourth quarter. The first GDPNow forecast for the first quarter of 2023 will be on Friday, January 27.”
Please remember that U.S. real GDP growth was running at ~2% pre-pandemic, and the official data is released on Jan. 26. Therefore, while the crowd has been crying recession and pivot since Q2 2022, the fundamentals have not complied. As a result, the medium-term outlook remains bullish for the FFR, real yields, and the USD Index, and while sentiment has shifted materially, little has changed from a fundamental perspective.
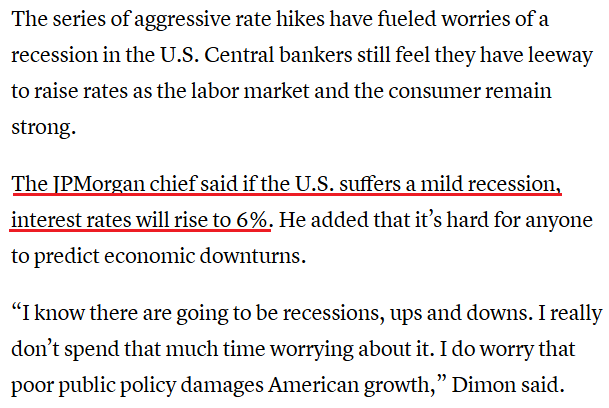
Finally, while the recent data highlights our concerns about jumpy inflation – which means it moves up and down instead of falling linearly – JPMorgan CEO Jamie Dimon said on Jan. 19:
“I actually think rates are probably going to go higher than 5%... because I think there’s a lot of underlying inflation, which won’t go away so quick (…).”
“We’ve had the benefit of China’s slowing down, the benefit of oil prices dropping a little bit,” Dimon said. “I think oil & gas prices probably go up the next 10 years” and “China isn’t going to be deflationary anymore.”
Likewise, Dimon thinks the FFR could hit 6% if only a mild recession unfolds; and not only do his expectations align with ours, but they also align with the historical precedent of where the FFR needs to go to eliminate inflation once and for all.
Overall, while the pivot narrative persists, cracks are starting to form. With short-term inflation metrics now pointing upward, the December and January optimism has loosened financial conditions and unfolded as expected. As such, with the up-and-down nature of MoM inflation poised to show its might, another bout of panic should hit risk assets over the medium term.
Do you agree with Bank of America’s thesis? And how would the PMs react if rate cuts are priced out of the futures market? Also, why has the economic data held up when everyone keeps predicting an imminent recession?
How Will Silver’s Consolidation End?
With the pivot narrative and re-accelerating MoM inflation poised to collide in the months ahead, the QE bulls may suffer a crisis of confidence. Moreover, with QE beneficiaries like silver likely to feel the pain as the drama unfolds, the medium-term outlook is profoundly bearish.
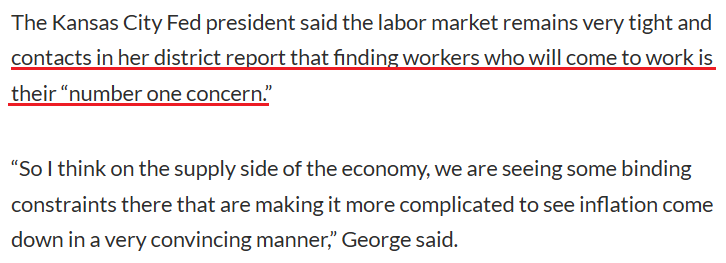
For example, while Kansas City Fed President Esther George often leans dovish, she said on Jan. 20:
“Inflation is still well above the Fed’s target. To be true to the price stability mandate, it looks like we’ll have to be a little more patient to see if we’re on the right trend and going to be there more convincingly to that 2% target.”
Thus, with labor demand still outweighing supply, she noted that it will be difficult to normalize inflation unless the imbalance is rectified.
Please see below:
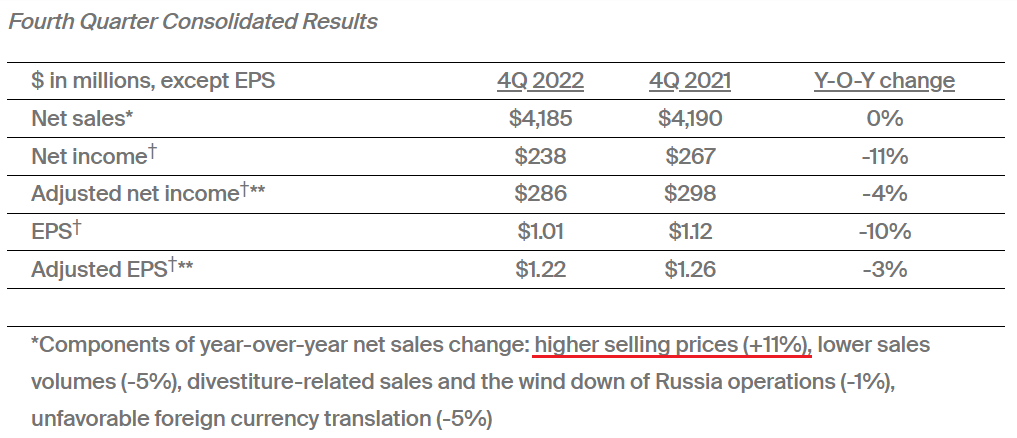
To that point, PPG Industries – a global supplier of paints, coatings and specialty materials – released its fourth-quarter earnings on Jan. 19.
COO Tim Knavish said during the Q4 earnings call that there is “significant inflation outside of raw materials,” and CFO Vince Morales added, “that's why we're doing targeted pricing across our portfolio to compensate for this other inflation that's going to be higher YoY, primarily labor.”
Furthermore, while we warned that wage inflation is the canary in the coal mine, Knavish said that higher prices will be the consequence in Q1:
“We still have pricing momentum. You know, we will have additional price in Q1 targeted by business. We've got some carryover impact in Q1 as well. You know, as for what's happening out there in the world besides PPG, you know, all the coatings companies are facing the same inflation inputs that we are.”
As a result, PPG Industries is an S&P 500 company with more than $4 billion in quarterly net sales, and it raised its selling prices by 11% in Q4; and with labor costs cited as the primary culprit – because shipping costs have plunged and commodity prices dipped – the data highlights why the crowd underestimates the peak FFR.
Please see below:
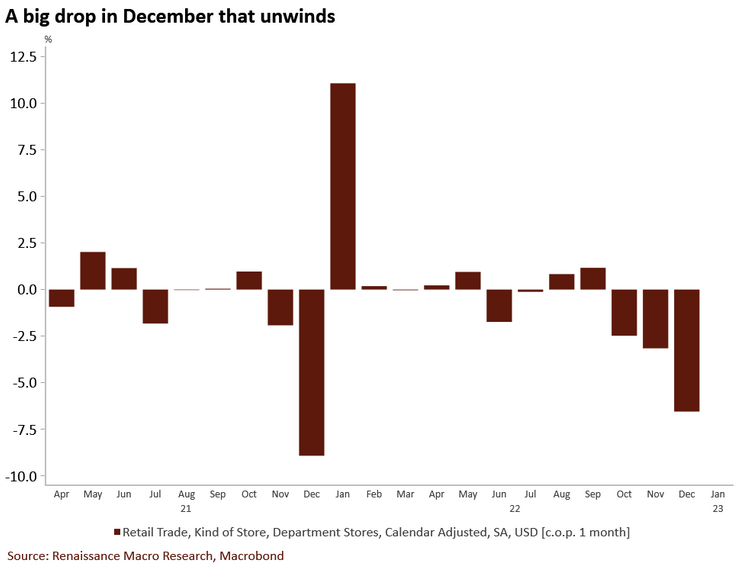
In addition, while the crowd assumes that demand destruction is near, the MoM weakness in December’s retail sales was also present in 2021. To explain, we wrote on Dec. 19:
To explain, U.S. retail sales came in weaker than expected on Jan. 18, and the brown bars on the right side of the chart above show a sharp MoM) deceleration in department store retail sales
Yet, if you analyze the middle of the chart, you can see that while sharp pullbacks were present in November and December 2021 (combined), the weakness reversed materially in January 2022; and while seasonal adjustments often skew the data, the current weakness should show a bullish reversal in the months ahead.
Likewise, with the pivot predictors missing the forest through the trees, consumers’ resiliency was on full display throughout 2022.
Please see below:
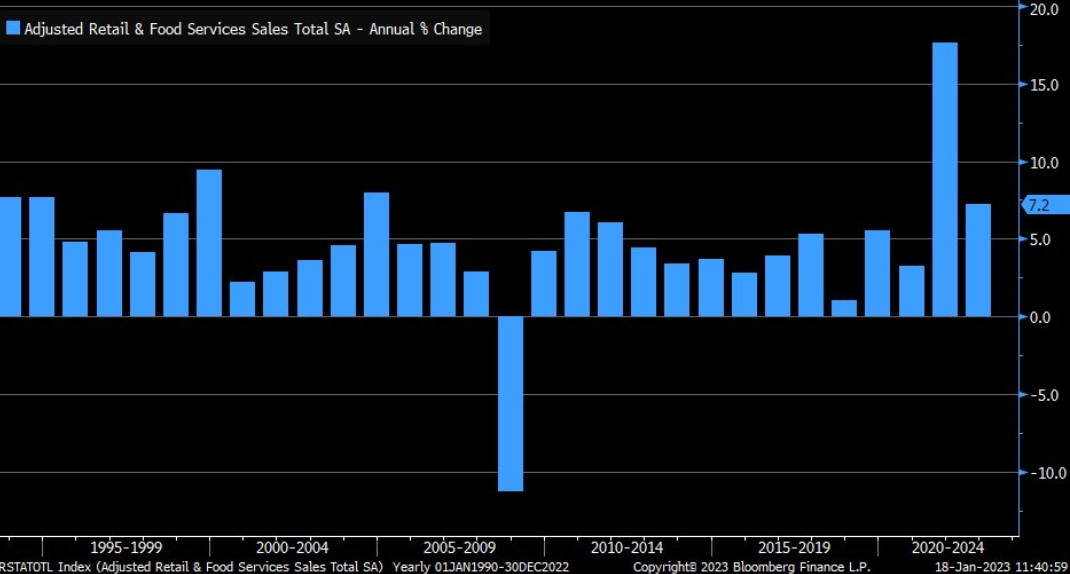
To explain, the blue bars above track the annual percentage change in U.S. retail & food services sales. Excluding 2021, U.S. retail sales posted their largest annual gain since 2004. So, while we warned repeatedly that record-high household checkable deposits and near-record-high wage inflation would keep consumer spending uplifted, little has changed.
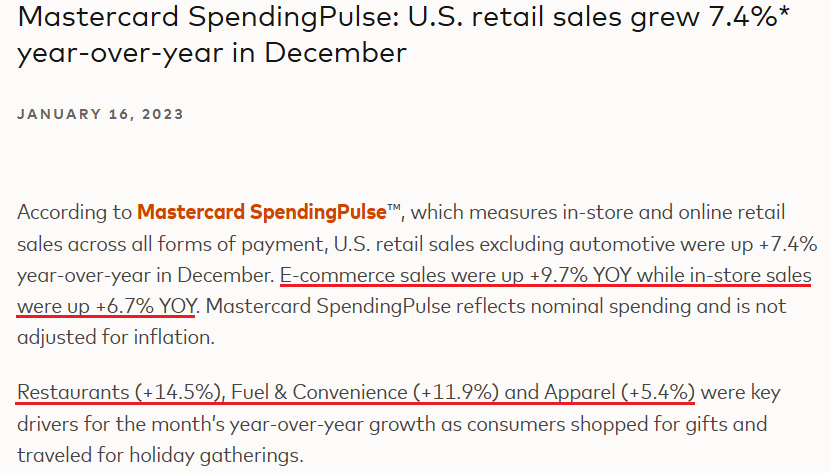
As further evidence, Mastercard released its SpendingPulse U.S. retail sales report on Jan. 16; and relative to December 2021, the results were constructive.
Please see below:
Thus, while it may sound like a broken record, we have been consistent in our thesis that the fundamentals do not support a dovish pivot; and with the data still signaling higher interest rates, the demand destruction prophecies are much more semblance than substance.
In reality, consumers are still flush with cash, and wage inflation for lower-income cohorts is now running ahead of the CPI. As a result, more rate hikes, not less, should dominate the headlines before this bear market ends.
Overall, the pivot narrative is still prevalent, so the silver price remains uplifted. But, sellers continue to rush for the exits near $24, and as the momentum weakens, the inflation backdrop has turned more hawkish. Consequently, it’s likely only a matter of time before a profound pullback occurs.
Do you think the FFR will surpass 5%? Or, will demand destruction arrive sooner? Why should the Fed pivot when companies are still raising their prices and consumer spending is resilient?
The Bottom Line
While the fundamental outlook has not deviated from our expectations, misguided sentiment has uplifted gold, silver and mining stocks. However, overbought conditions are now colliding with more ominous MoM inflation, and the historical lessons of jumpy inflation should keep the FFR elevated in the months ahead. In the process, risk assets should undergo major re-pricings.
In conclusion, the PMs rallied on Jan. 20, as the S&P 500 squeezed higher. Moreover, while the USD Index was flat and the U.S. 10-Year real yield rose, we believe the pair will hit new highs before it’s all said and done.
Overview of the Upcoming Part of the Decline
- It seems to me that the corrective upswing is over (or about to be over) and that the next big move lower is already underway (or that it’s about to start).
- If we see a situation where miners slide in a meaningful and volatile way while silver doesn’t (it just declines moderately), I plan to – once again – switch from short positions in miners to short positions in silver. At this time, it’s too early to say at what price levels this could take place and if we get this kind of opportunity at all – perhaps with gold prices close to $1,500 - $1,550.
- I plan to switch from the short positions in junior mining stocks or silver (whichever I’ll have at that moment) to long positions in junior mining stocks when gold / mining stocks move to their 2020 lows (approximately). While I’m probably not going to write about it at this stage yet, this is when some investors might consider getting back in with their long-term investing capital (or perhaps 1/3 or 1/2 thereof).
- I plan to return to short positions in junior mining stocks after a rebound – and the rebound could take gold from about $1,450 to about $1,550, and it could take the GDXJ from about $20 to about $24. In other words, I’m currently planning to go long when GDXJ is close to $20 (which might take place when gold is close to $1,450), and I’m planning to exit this long position and re-enter the short position once we see a corrective rally to $24 in the GDXJ (which might take place when gold is close to $1,550).
- I plan to exit all remaining short positions once gold shows substantial strength relative to the USD Index while the latter is still rallying. This may be the case with gold prices close to $1,400 and GDXJ close to $15 . This moment (when gold performs very strongly against the rallying USD and miners are strong relative to gold after its substantial decline) is likely to be the best entry point for long-term investments, in my view. This can also happen with gold close to $1,400, but at the moment it’s too early to say with certainty.
- The above is based on the information available today, and it might change in the following days/weeks.
You will find my general overview of the outlook for gold on the chart below:
Please note that the above timing details are relatively broad and “for general overview only” – so that you know more or less what I think and how volatile I think the moves are likely to be – on an approximate basis. These time targets are not binding nor clear enough for me to think that they should be used for purchasing options, warrants, or similar instruments.
Letters to the Editor
We received a few messages over e-mail, but as we are moving to our new platform, we will be transferring them below the articles as comments – and that’s where we’ll be replying to them.
Asking your questions below the articles or in the spaces called “Ask the Community” or “Position Sizes” directly will help us deliver a reply sooner. In some cases, someone from the community might reply and help even before we do.
Please remember about the Pillars of our Community, especially about the Kindness of Speech Pillar.
Also, if there’s anything that you’re unhappy with, it’s best to send us a message at [email protected].
Please note that this section is going to go away within the next 1-8 weeks, as you can add comments/questions below the article on Golden Meadow – the platform that we’re using to provide our analyses. Your notification e-mails include an invitation link that allows you to access the “Gold Trading Alerts” space.
Also, if you haven’t had the chance to see the video, in which I’m talking about the new platform and why we essentially moved from Sunshine Profits to Golden Meadow, I strongly encourage you to do so:
Summary
Summing up, it seems that the major bottom in the USD Index is in (or at hand), while the correction in stocks, gold, silver, and mining stocks is over – or very close to being over.
Gold and silver correct about 61.8% of their 2022 decline, while junior miners corrected a bit more than 50% of the decline. The breakouts above those levels were invalidated recently, and we see another attempt to move higher. Given miners’ weakness relative to gold, gold’s very long-term resistance (the 2011 high!), and the situation in the USD Index, it seems that the next big move lower in the precious metals sector is about to start.
Now, as more investors realize that interest rates will have to rise sooner than expected, the prices of precious metals and mining stocks (as well as other stocks) are likely to fall. In my opinion, the current trading position is going to become profitable in the following weeks, and quite possibly in the following days. And while I can’t promise any kind of performance, I fully expect it to become very profitable before it’s over and to prolong our 2022 winning streak.
After the final sell-off (that takes gold to about $1,350-$1,500), I expect the precious metals to rally significantly. The final part of the decline might take as little as 1-5 weeks, so it's important to stay alert to any changes.
As always, we'll keep you – our subscribers – informed.
To summarize:
Trading capital (supplementary part of the portfolio; our opinion): Full speculative short positions (300% of the full position) in junior mining stocks are justified from the risk to reward point of view with the following binding exit profit-take price levels:
Mining stocks (price levels for the GDXJ ETF): binding profit-take exit price: $20.32; stop-loss: none (the volatility is too big to justify a stop-loss order in case of this particular trade)
Alternatively, if one seeks leverage, we’re providing the binding profit-take levels for the JDST (2x leveraged). The binding profit-take level for the JDST: $22.87; stop-loss for the JDST: none (the volatility is too big to justify a SL order in case of this particular trade).
For-your-information targets (our opinion; we continue to think that mining stocks are the preferred way of taking advantage of the upcoming price move, but if for whatever reason one wants / has to use silver or gold for this trade, we are providing the details anyway.):
Silver futures downside profit-take exit price: $14.32
SLV profit-take exit price: $13.42
ZSL profit-take exit price: $48.87
Gold futures downside profit-take exit price: $1,504
HGD.TO – alternative (Canadian) 2x inverse leveraged gold stocks ETF – the upside profit-take exit price: $16.47
HZD.TO – alternative (Canadian) 2x inverse leveraged silver ETF – the upside profit-take exit price: $36.87
Long-term capital (core part of the portfolio; our opinion): No positions (in other words: cash)
Insurance capital (core part of the portfolio; our opinion): Full position
Whether you’ve already subscribed or not, we encourage you to find out how to make the most of our alerts and read our replies to the most common alert-and-gold-trading-related-questions.
Please note that we describe the situation for the day that the alert is posted in the trading section. In other words, if we are writing about a speculative position, it means that it is up-to-date on the day it was posted. We are also featuring the initial target prices to decide whether keeping a position on a given day is in tune with your approach (some moves are too small for medium-term traders, and some might appear too big for day-traders).
Additionally, you might want to read why our stop-loss orders are usually relatively far from the current price.
Please note that a full position doesn't mean using all of the capital for a given trade. You will find details on our thoughts on gold portfolio structuring in the Key Insights section on our website.
As a reminder - "initial target price" means exactly that - an "initial" one. It's not a price level at which we suggest closing positions. If this becomes the case (as it did in the previous trade), we will refer to these levels as levels of exit orders (exactly as we've done previously). Stop-loss levels, however, are naturally not "initial", but something that, in our opinion, might be entered as an order.
Since it is impossible to synchronize target prices and stop-loss levels for all the ETFs and ETNs with the main markets that we provide these levels for (gold, silver and mining stocks - the GDX ETF), the stop-loss levels and target prices for other ETNs and ETF (among other: UGL, GLL, AGQ, ZSL, NUGT, DUST, JNUG, JDST) are provided as supplementary, and not as "final". This means that if a stop-loss or a target level is reached for any of the "additional instruments" (GLL for instance), but not for the "main instrument" (gold in this case), we will view positions in both gold and GLL as still open and the stop-loss for GLL would have to be moved lower. On the other hand, if gold moves to a stop-loss level but GLL doesn't, then we will view both positions (in gold and GLL) as closed. In other words, since it's not possible to be 100% certain that each related instrument moves to a given level when the underlying instrument does, we can't provide levels that would be binding. The levels that we do provide are our best estimate of the levels that will correspond to the levels in the underlying assets, but it will be the underlying assets that one will need to focus on regarding the signs pointing to closing a given position or keeping it open. We might adjust the levels in the "additional instruments" without adjusting the levels in the "main instruments", which will simply mean that we have improved our estimation of these levels, not that we changed our outlook on the markets. We are already working on a tool that would update these levels daily for the most popular ETFs, ETNs and individual mining stocks.
Our preferred ways to invest in and to trade gold along with the reasoning can be found in the how to buy gold section. Furthermore, our preferred ETFs and ETNs can be found in our Gold & Silver ETF Ranking.
As a reminder, Gold & Silver Trading Alerts are posted before or on each trading day (we usually post them before the opening bell, but we don't promise doing that each day). If there's anything urgent, we will send you an additional small alert before posting the main one.
Thank you.
Przemyslaw K. Radomski, CFA
Founder, Editor-in-chief


