

Briefly: in our opinion, full (300% of the regular position size) speculative short positions in junior mining stocks are justified from the risk/reward point of view at the moment of publishing this Alert.
Remember the one ring to rule them all? Today, we prepared for you the one precious metals chart to rule them all – in terms of importance.
The chart features all key parts of the precious metals sector and one of its two key fundamental drivers: gold, silver, mining stocks, and the USD Index. The other fundamental driver is the level and trend in the real interest rates (which I discussed on Thursday).
Without further ado, here it is.
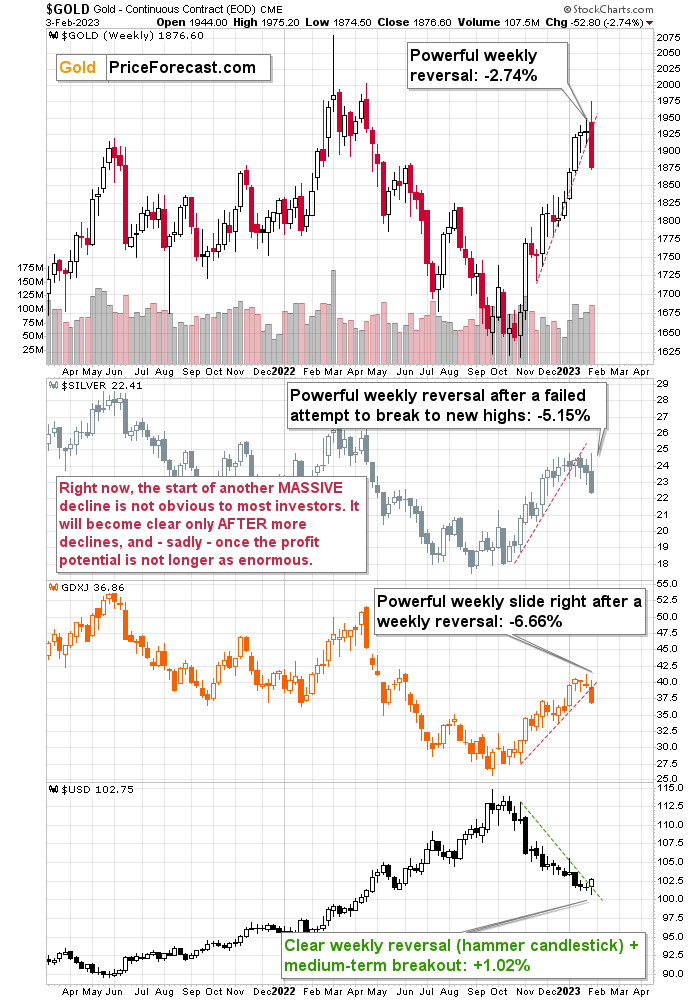
The annotations on the chart already reveal the most important events that occurred. Namely, it’s all about the weekly reversals!
On an intraday basis, prices move back and forth somewhat randomly, somewhat based on events that are temporary or relatively unimportant, and sometimes based on big individual transactions. All in all, those price moves are usually not reliable enough to say much about a change in the trend or about anything else.
Of course, the “experts” out there will always “know” the reason behind all price moves, but in many cases, the “experts” are journalists that are tasked with writing something, and since they have to write something, they will just take the easy road, find an “important statistic” that was released on that day (there are many statistics released on each day, so they will just “pick” one that seems most important), and create a title that says “gold does THIS on THAT,” e.g. “gold soars on increase in Indian gold exports by 0.01%,” just look at the titles of the gold price news.
The problem is that people are mistaking the fact that both events happened on the same day for the causality. Just because they happened almost simultaneously doesn’t mean that one caused the other. In the preceding example, gold could have simply rallied due to a technical pattern (which journalists are rarely aware of) or it could have been a sell-the-rumor-buy-the-fact market reaction to something completely different.
Why am I writing all this? To emphasize that price noise and “news noise” are common, and it’s not easy for someone new to the markets to differentiate between what is important and what isn’t important but is just portrayed as important by people who are pretending to know the reasoning behind a given market’s price moves simply because it’s in their job description. The quality of the source of the information matters, as long as your capital matters to you.
Moving back to the price noise, one way to deal with it is to ignore what’s happening on an intraday basis and look at just the daily closing prices. Some investors and traders prefer to analyze prices from this point of view, completely ignoring intraday price movement. That’s how some charts are created as well.
While daily closing prices eliminate part of the problem with price noise, they too could be pushed by various parties and can sometimes be viewed as not clearly informative.
To be honest, one can never be 100% certain that the price they choose to use is completely accurate, but there are several ways to ensure (precisely: greatly increase chances, as there are no certainties in any market) that one is indeed focusing on what truly matters. These include:
- Focusing on weekly price moves and weekly candlesticks (which include intraweek lows and highs, but one of the key parts in them are the weekly opening and closing prices).
- Focusing on whether markets that should be moving together (here: gold, silver, and mining stocks) are indeed moving together and flashing the same signals.
- Focusing on whether the markets that are likely to drive the prices of other assets are moving in a direction that supports the indications from the main market that one is analyzing (in our case, gold is the main market and the USD Index is the driver).
Keeping all the above in mind, let’s take one more look at the “one chart to rule them all.” In fact, now it’s clear why I called it that. Here are the key facts about the precious metals sector:
- Gold flashed a powerful weekly reversal candlestick and declined by 2.74% last week.
- Silver flashed a powerful weekly reversal candlestick, and it declined by 5.15% last week.
- Mining stocks declined profoundly right after a weekly reversal candlestick, and the GDXJ ETF declined by 6.66% last week. That’s extra bearish, because gold stocks tend to lead gold, so the fact that the bearish indication flashed one week earlier in the case of miners is an additional bearish sign.
What about one of the key drivers of the gold price – the USD Index?
It formed a powerful weekly reversal candlestick, called a “hammer candlestick.” Not only that – at the same time it broke above its declining medium-term resistance line (marked with green). This is a perfect confirmation of the bearish indications coming from gold, silver, and mining stocks. The USD Index is inversely correlated with gold, thus a bullish reversal in the USDX is a strong bearish sign that confirms the bearish reversal across the precious metals market.
Do these weekly indications work? Yes, they do. It doesn’t mean that they are a 100% certain tool for making gold price forecasts. Of course not – there are no such tools, and one needs to apply many of the useful and time-tested tools before entering into a trading position. While I cannot guarantee anything, I can tell you that all four of my trades in the previous year that were based on this type of indicator were profitable (two of them were long trades in the precious metals sector and two were short trades). My current trade remains open, and its potential – in my opinion – is truly enormous.
Now, after this dramatic slide that took gold about $100 lower in less than 48 hours, it’s normal for the precious metals market to take a breather, and we see it in today’s pre-market trading (chart courtesy of SilverPriceForecast.com)
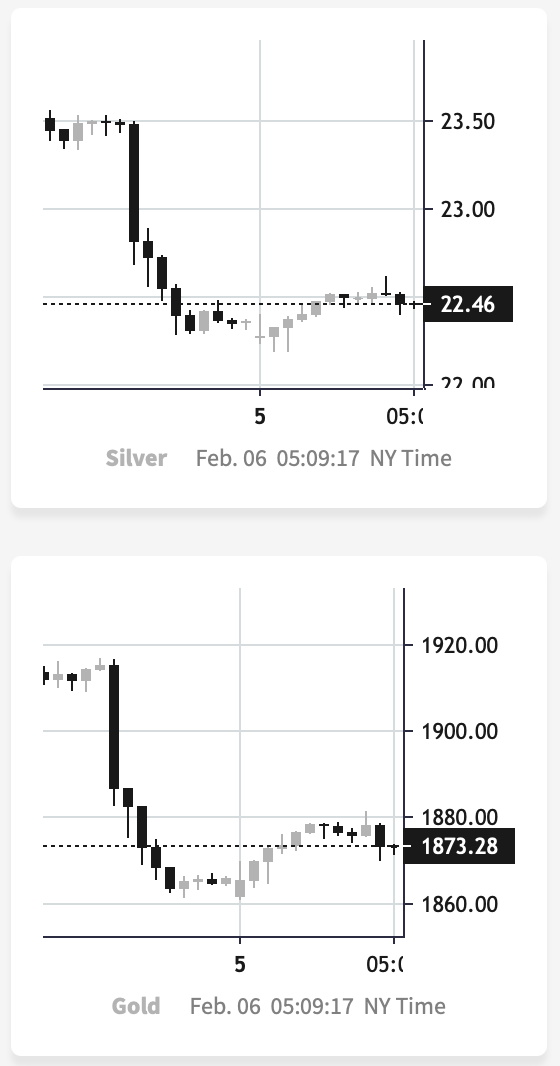
Both metals are up, but it’s “small potatoes” compared to the size of Friday’s decline. It’s not bullish – it’s a regular reaction. If you see some kind of “gold soars on XYZ statistic,” well, the odds are that it could be far from reality, as today’s rebound is something that was likely to happen based on just the size and sharpness of Friday’s downswing – no other reason is necessary for this.
In my view, the real interest rates are up and about to soar higher, the USD Index has most likely bottomed, and the precious metals have topped in a spectacular manner. The rally in gold, silver, and miners was indeed sizable, but… It’s over.
What’s next? Something exciting or something scary – depending on how positioned and informed one chooses to be.
Having said that, let’s take a look at the markets from a more fundamental point of view.
Gold Shows Its Flawed Fundamentals
Despite our repeated warnings that the economic data contrasted the pivot narrative, sentiment continued to diverge from the fundamentals. However, after another wake-up call on Feb. 3, the bullish narrative should shift in the months ahead. To explain, we wrote before the opening bell:
While the crowd assumes that inflation will decline smoothly to 2%, its propensity to jump around should collapse this narrative and enhance volatility. Again, it’s not that inflation will hit new highs; it’s that it won’t return to 2% without immense demand destruction; and since that demand destruction is not present now, interest rates need to rise to suppress consumption and rebalance the U.S. labor market.
To that point, with U.S. nonfarm payrolls smashing expectations on Feb. 3, the fundamentals continue to unfold as expected.
Please see below:
 To explain, the U.S. added 517,000 jobs in January, which was well above the consensus estimate of 185,000. Thus, while we have been bullish on the U.S. labor market for many months, it’s another indication that the U.S. federal funds rate (FFR) is not high enough to suppress demand.
Furthermore, with employment outperformance present for the last several months, the crowd’s calls for demand destruction have been unwisely premature.
Please see below:
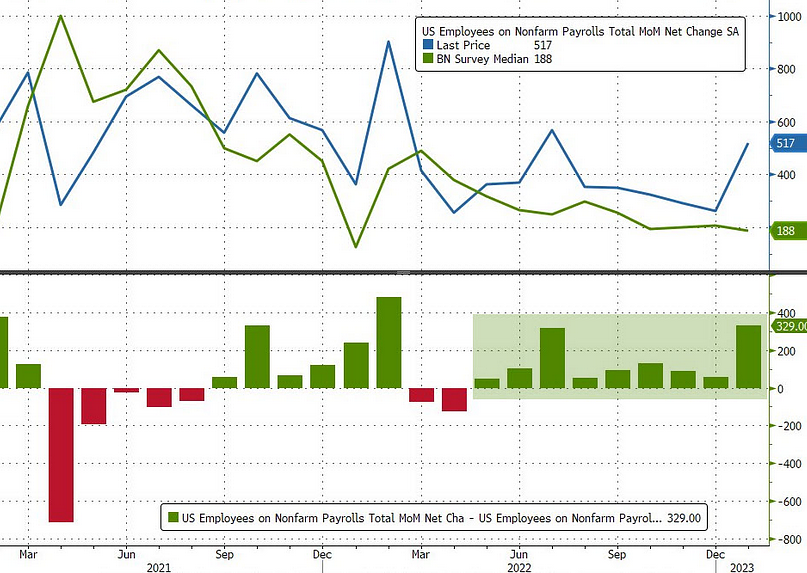 To explain, the blue line above tracks realized nonfarm payrolls, while the green line above tracks the consensus estimate. If you analyze the right side of the chart, you can see that the blue line has remained above the green line for many months, which indicates how the consensus has been too bearish on the U.S. labor market.
In contrast, we have warned on numerous occasions that the material supply/demand imbalance is bullish for wage inflation, which in time, should uplift the FFR, real yields and the USD Index.
Speaking of which, average hourly earnings (AHE) also outperformed expectations on Feb. 3.
Please see below:
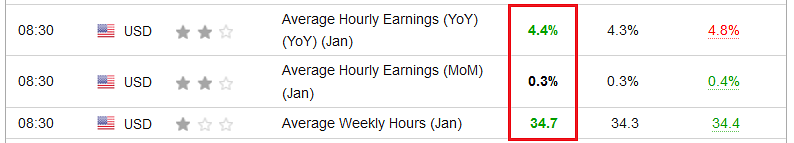 To explain, AHE came in at 4.4% year-over-year (YoY) versus 4.3% YoY expected, and average weekly hours also outperformed, which means higher pay and longer work weeks. As such, with the resilient results coinciding with the U.S. unemployment rate hitting its lowest level since 1969, the pivot narrative did, and still does, lack credibility.
As further evidence, permanent and temporary layoffs also moved lower in January.
Please see below:
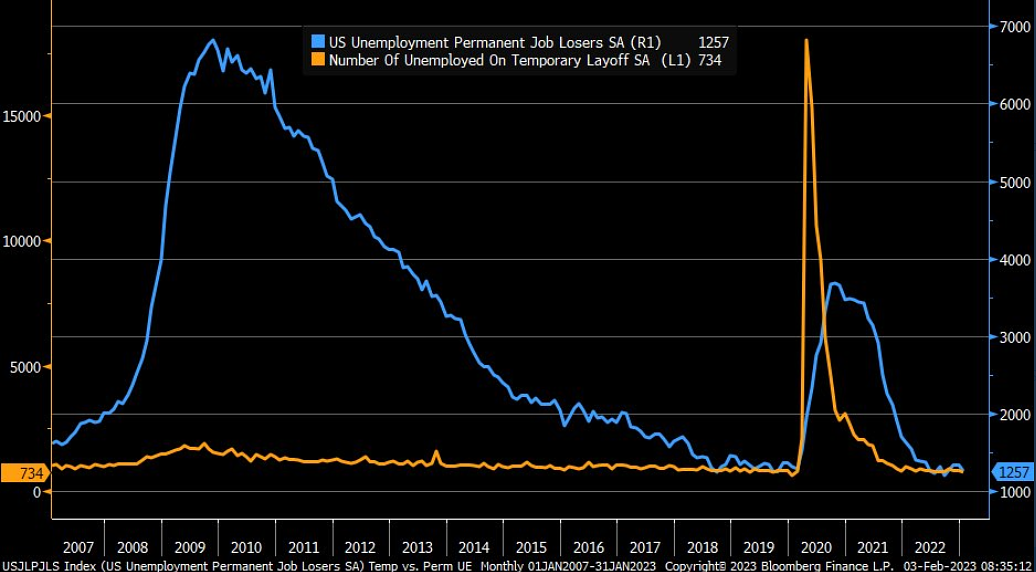 To explain, the blue and orange lines above track permanent and temporary job losses. If you analyze the right side of the chart, you can see that both metrics are historically low, and when you compare the blue line’s current performance to 2008, these are not the kind of readings that occur alongside dovish pivots.
Piecing it all together, the hawkish employment outperformance on Feb. 3 resulted in a material increase in rate-hike expectations.
Please see below:
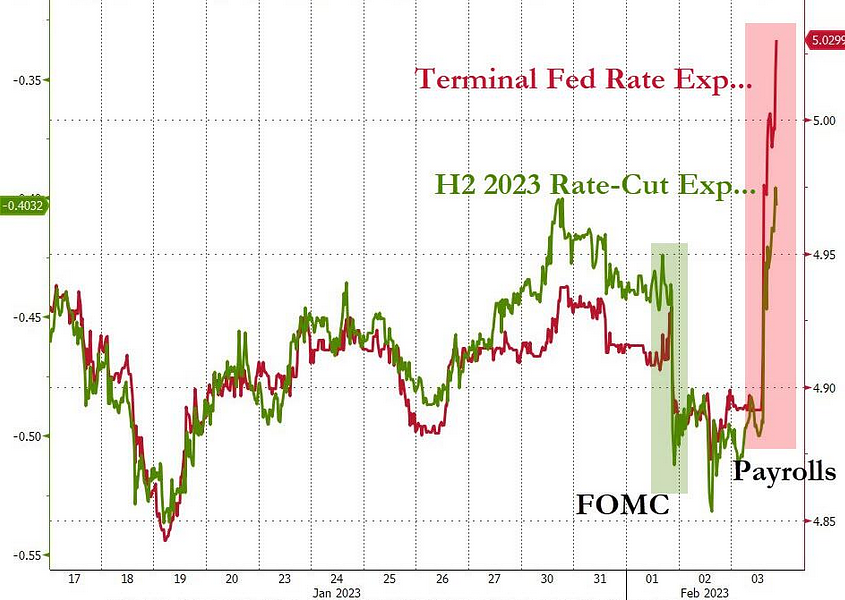 To explain, the red line above tracks the peak FFR implied by the futures market, while the green line above tracks the inverted (down means up) number of rate cuts priced in thereafter. If you analyze the right side of the chart, you can see that the payrolls print helped push the implied FFR peak from below 4.90% to above 5%. Likewise, rate-cut expectations also declined, as evidenced by the green line moving higher.
So, the end result was a hawkish re-pricing of Fed expectations, and we warned on Jan. 20 that a reality check was forthcoming. We wrote:
Please see this Bloomberg headline from Jan. 19:
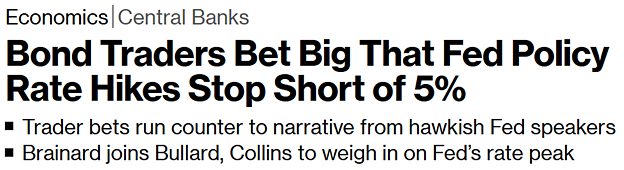 …. Silver remains uplifted because the crowd has placed ‘big bets’ that the Fed will pivot in the months ahead. Yet, their optimism contrasts inflationary history, and the current economic conditions also signal a much different outcome. Consequently, we expect risk assets to re-price substantially over the medium term.
Ironically, if you analyze the peak FFR expectations chart above, you can see that Jan. 19 essentially marked the bottom in dovish re-pricing (the low red line). Therefore, with the technicals and the fundamentals continuing to align with our expectations, more downside should confront gold, silver and mining stocks in the months ahead.
Also noteworthy, S&P Global released its U.S. Composite PMI on Feb. 3; and with the data bullish for the FFR, interest rates should continue their ascent before this bear market ends. An excerpt read:
“Employment across the service sector increased further during January, thereby extending the current sequence of job creation that began in July 2020. That said, the pace of growth slowed to only a slight pace.”
In addition:
“Cost pressures intensified in the opening month of 2023, thereby bringing an end to a seven-month sequence of easing input price inflation. Higher cost burdens were often linked to increased material prices, but service providers also commonly mentioned upticks in wage bills.”
As it stands, while output inflation did not rise to the same extent as input inflation (but should later as businesses adjust), employment growth continued and companies noted further wage pressures.
Conversely, the Fed needs the unemployment rate to rise to normalize wage and output inflation, and that’s not happening.
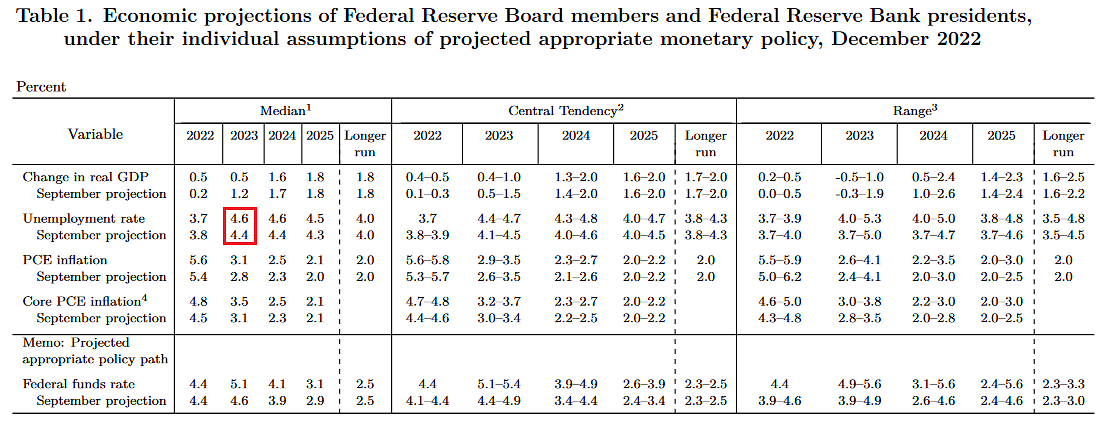
If you analyze the FOMC’s latest Summary of Economic Projections (SEP) below, you can see that in December, the median participant expected the unemployment rate to hit 4.6% in 2023. Although, the metric fell to 3.4% on Feb. 3. As such, it’s moving in the opposite direction, and these are not the kind of results that eliminate wage inflation.
 Overall, the fundamental backdrop is bearish for the PMs because the FFR is not high enough to stifle demand. We warned that despite the misguided narrative, the U.S. labor market was resilient, consumers were flush with cash and the Sticky CPIs kept hitting new highs; and today, little has changed. So, while inflation may not hit new highs, the crowd materially underestimates the demand destruction required for it to hit 2%.
How does the FOMC reconcile its 2023 unemployment rate projection with the current figure? Can inflation hit 2% without the unemployment rate rising? Where do you expect the FFR to peak?
Silver Suffers Severe Losses
With silver plunging by more than 5% on Feb. 3, the white metal’s consolidation ended in dramatic fashion, and we warned that a breakdown was on the horizon. We wrote on Jan. 31:
While the S&P 500 suffered a material correction, silver continued its sideways price action. However, as time passes and silver stagnates, its 50-day moving average continues to rise. As a result, the white metal needs to rally soon, or a breakdown could occur in the coming days; and with the latter more likely than the former in our view, an S&P 500 drawdown could provide the necessary fuel.
Thus, with both the S&P 500 and silver suffering on Feb. 3, the ominous technical and fundamental realities ruled the day. Moreover, while the index’s short-term outlook remains neutral, more pain should confront stocks over the medium term.
For example, Bank of America’s Chief Investment Strategist Michael Hartnett told clients on Feb. 3 that the recent rally is like an “apocalypse postponed,” as an inflation reacceleration and a deeper-than-expected recession should materially shift sentiment in the months ahead. Likewise, he expects the market to peak as soon as Valentine’s Day (Feb. 14).
Please see below:
 On top of that, the divergence between the U.S. stock market and bank reserves is an ominous sign for equities.
Please see below:
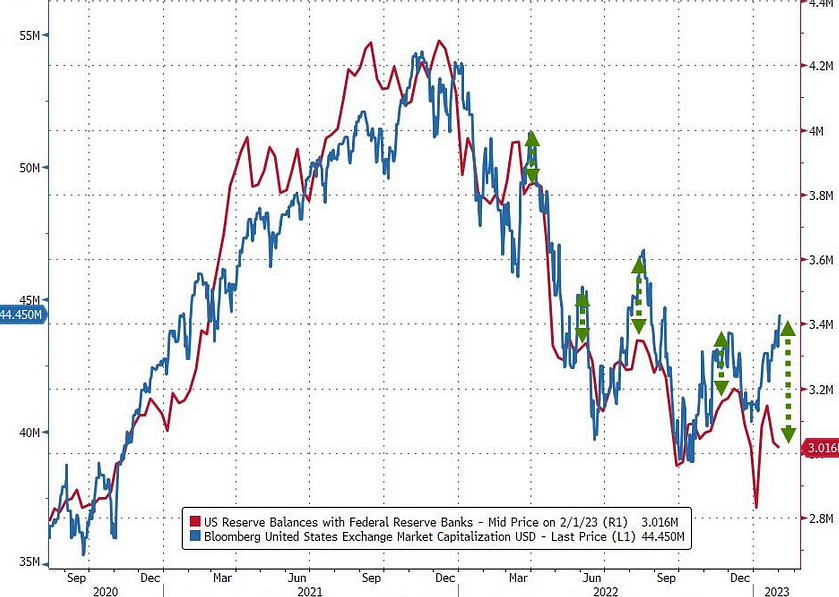 To explain, the red line above tracks U.S. commercial bank’s cash holdings, while the blue line above tracks the market cap of U.S. stocks. If you analyze the relationship, you can see that higher cash balances are often put to work in the market, which helps keep U.S. stocks uplifted.
Conversely, the red line has dipped on the right side of the chart while the blue line has risen. Therefore, with overbought conditions present and payrolls delivering a hawkish wake-up call, stocks could suffer as they catch down to liquidity.
On top of that, we’ve cited the importance of real yields on numerous occasions, but it’s not only the PMs that suffer when they rise.
Please see below:
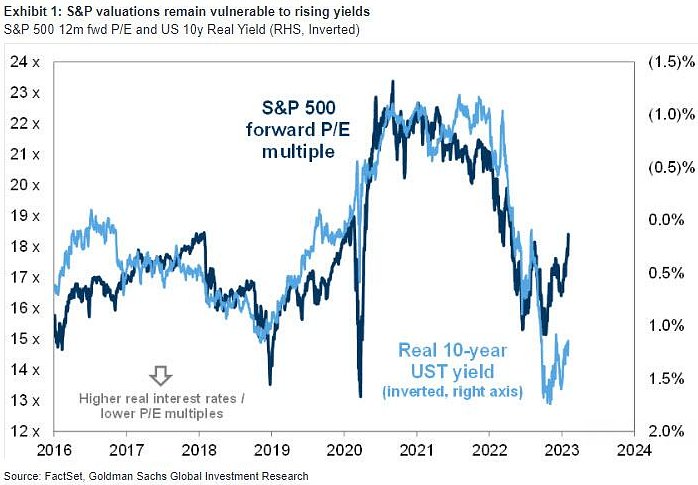 To explain, the dark blue line above tracks the S&P 500’s forward price-to-earnings (P/E) ratio, while the light blue line above tracks the inverted (down means up) U.S. 10-year real yield. If you analyze the relationship, you can see that higher real yields compress multiples because cash and bonds become more attractive relative to stocks.
Similarly, while the U.S. 10-Year real yield has pulled back from its peak, an S&P 500 P/E multiple north of 18x is still too rich; and with higher real interest rates needed to combat inflation, the valuation impact implies more pain should confront the equity bulls over the medium term.
Finally, the Institute for Supply Management (ISM) released its U.S. Services PMI on Feb. 3. An excerpt read:
“ISM's New Orders Index registered 60.4 percent, up 15.2 percentage points from the seasonally adjusted December reading of 45.2 percent. New orders grew after contracting in December for the first time after 30 consecutive months of growth. Comments from respondents include: ‘Increased production due to new customers’ and ‘January is typically higher for us than December, as it's the start of a new year versus a holiday month.’
So, with the rise in new orders another sign of resilient demand, the economic backdrop supports higher, not lower, interest rates. As such, even though the payrolls outperformance helped increase hawkish expectations, investors are still pricing in rate cuts later in 2023.
Now, when the magnitude of those expected rate cuts declined on Feb. 3, the impact on the PMs was material; and if those cuts get priced out altogether – which should occur due to resilient growth and inflation – the hawkish shift could result in a further exodus from gold, silver and mining stocks.
Remember, we warned that Commodity Trading Advisors (CTAs) were extremely overweight the PMs, and their positioning is driven by momentum, not the technicals or the fundamentals. But, momentum cuts both ways; and while their continuous bid helped push the PMs higher, the Feb. 3 sell-offs highlight how quickly sentiment can change.
As a result, we expect more meaningful drawdowns in the months ahead, as evaporating liquidity, higher real yields, and a resurgent USD Index pressure several risk assets.
How meaningful was silver’s breakdown? Does the white metal recoup its 50-day MA ($23.38) or fall below its 200-day MA ($21.10)? Do you agree with Hartnett that the S&P 500 peaks by Valentine’s Day?
The Bottom Line
Technical and fundamental realities spooked the PMs on Feb. 3, as momentum reversed and the algorithms were in sell mode. Moreover, the ferocity of the liquidations highlights how little medium-term faith these traders have in the PMs. Furthermore, with the GDXJ ETF plunging by nearly 5%, the junior miners’ index has declined by more than 10% from its Jan. 25 close. Consequently, while short-term consolidations may ensure, we expect more significant slides over the medium term.
In conclusion, the PMs declined on Feb. 3, as fast-money traders raced to get out of their gold, silver and mining stock positions. Conversely, the USD Index and the U.S. 10-Year real yield rallied, and the payrolls outperformance provided more fundamental fuel for our thesis. Therefore, we maintain our view that resilient demand should keep the pressure on the Fed in 2023.
Overview of the Upcoming Part of the Decline
- It seems to me that the corrective upswing is over (or about to be over) and that the next big move lower is already underway (or that it’s about to start).
- If we see a situation where miners slide in a meaningful and volatile way while silver doesn’t (it just declines moderately), I plan to – once again – switch from short positions in miners to short positions in silver. At this time, it’s too early to say at what price levels this could take place and if we get this kind of opportunity at all – perhaps with gold prices close to $1,500 - $1,550.
- I plan to switch from the short positions in junior mining stocks or silver (whichever I’ll have at that moment) to long positions in junior mining stocks when gold / mining stocks move to their 2020 lows (approximately). While I’m probably not going to write about it at this stage yet, this is when some investors might consider getting back in with their long-term investing capital (or perhaps 1/3 or 1/2 thereof).
- I plan to return to short positions in junior mining stocks after a rebound – and the rebound could take gold from about $1,450 to about $1,550, and it could take the GDXJ from about $20 to about $24. In other words, I’m currently planning to go long when GDXJ is close to $20 (which might take place when gold is close to $1,450), and I’m planning to exit this long position and re-enter the short position once we see a corrective rally to $24 in the GDXJ (which might take place when gold is close to $1,550).
- I plan to exit all remaining short positions once gold shows substantial strength relative to the USD Index while the latter is still rallying. This may be the case with gold prices close to $1,400 and GDXJ close to $15 . This moment (when gold performs very strongly against the rallying USD and miners are strong relative to gold after its substantial decline) is likely to be the best entry point for long-term investments, in my view. This can also happen with gold close to $1,400, but at the moment it’s too early to say with certainty.
- The above is based on the information available today, and it might change in the following days/weeks.
You will find my general overview of the outlook for gold on the chart below:
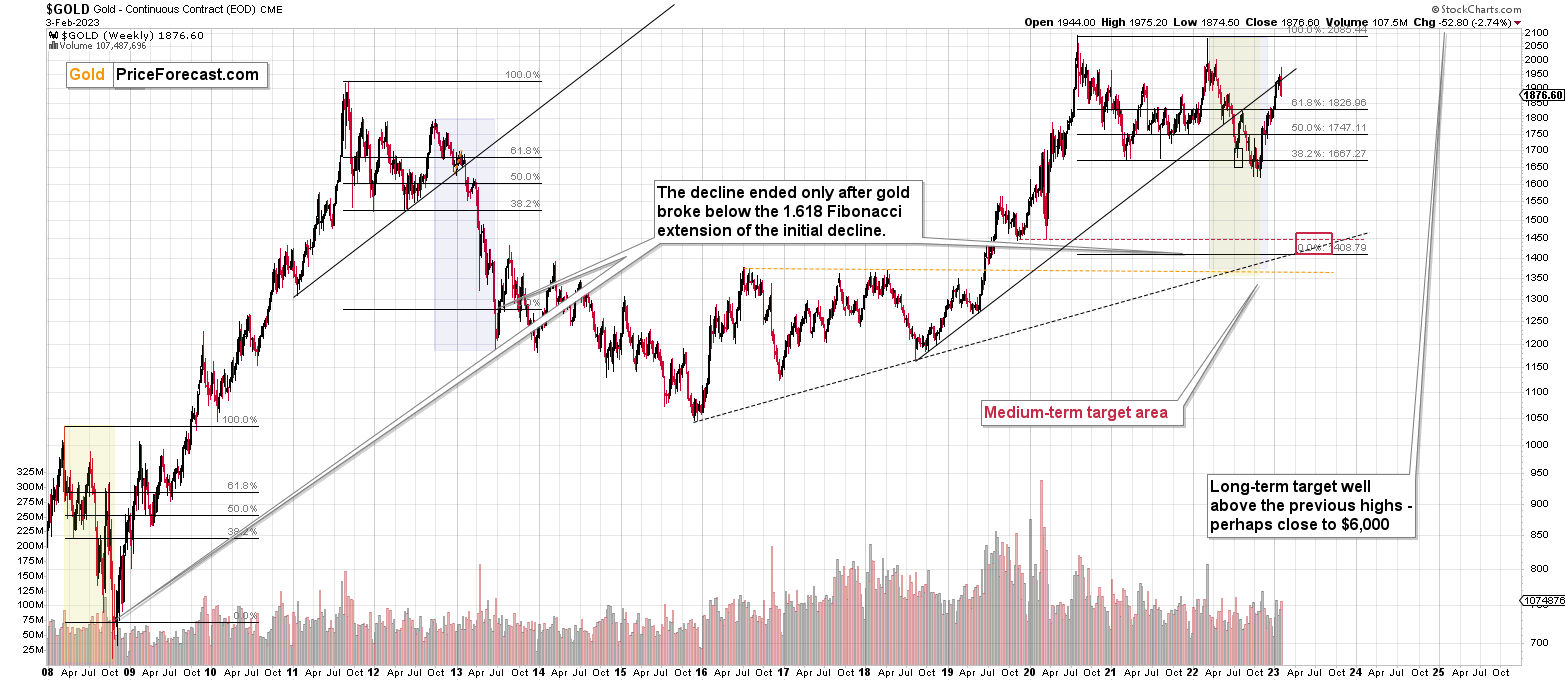
Please note that the above timing details are relatively broad and “for general overview only” – so that you know more or less what I think and how volatile I think the moves are likely to be – on an approximate basis. These time targets are not binding nor clear enough for me to think that they should be used for purchasing options, warrants, or similar instruments.
Letters to the Editor
We received a few messages over e-mail, but as we are moving to our new platform, we will be transferring them below the articles as comments – and that’s where we’ll be replying to them.
Asking your questions below the articles or in the spaces called “Ask the Community” or “Position Sizes” directly will help us deliver a reply sooner. In some cases, someone from the community might reply and help even before we do.
Please remember about the Pillars of our Community, especially about the Kindness of Speech Pillar.
Also, if there’s anything that you’re unhappy with, it’s best to send us a message at [email protected].
Please note that this section is going to go away within the next 1-8 weeks, as you can add comments/questions below the article on Golden Meadow – the platform that we’re using to provide our analyses. Your notification e-mails include an invitation link that allows you to access the “Gold Trading Alerts” space.
Also, if you haven’t had the chance to see the video, in which I’m talking about the new platform and why we essentially moved from Sunshine Profits to Golden Meadow, I strongly encourage you to do so:
Summary
Summing up, it seems that the major bottom in the USD Index is in (or at hand), while the correction in stocks, gold, silver, and mining stocks is over – or very close to being over.
Gold and silver correct about 61.8% of their 2022 decline, while junior miners corrected a bit more than 50% of the decline, but not more than 61.8% thereof. This is exactly how the big 2021 and 2022 declines in junior miners started.
Given the above, gold’s very long-term resistance (the 2011 high!) and the situation in the USD Index, it seems that the next big move lower in the precious metals sector is about to start.
Now, as more investors realize that interest rates will have to rise sooner than expected, the prices of precious metals and mining stocks (as well as other stocks) are likely to fall. In my opinion, the current trading position is going to become profitable in the following weeks, and quite possibly in the following days. And while I can’t promise any kind of performance, I fully expect it to become very profitable before it’s over and to prolong our 2022 winning streak.
After the final sell-off (that takes gold to about $1,350-$1,500), I expect the precious metals to rally significantly. The final part of the decline might take as little as 1-5 weeks, so it's important to stay alert to any changes.
As always, we'll keep you – our subscribers – informed.
To summarize:
Trading capital (supplementary part of the portfolio; our opinion): Full speculative short positions (300% of the full position) in junior mining stocks are justified from the risk to reward point of view with the following binding exit profit-take price levels:
Mining stocks (price levels for the GDXJ ETF): binding profit-take exit price: $20.32; stop-loss: none (the volatility is too big to justify a stop-loss order in case of this particular trade)
Alternatively, if one seeks leverage, we’re providing the binding profit-take levels for the JDST (2x leveraged). The binding profit-take level for the JDST: $22.87; stop-loss for the JDST: none (the volatility is too big to justify a SL order in case of this particular trade).
For-your-information targets (our opinion; we continue to think that mining stocks are the preferred way of taking advantage of the upcoming price move, but if for whatever reason one wants / has to use silver or gold for this trade, we are providing the details anyway.):
Silver futures downside profit-take exit price: $14.32
SLV profit-take exit price: $13.42
ZSL profit-take exit price: $48.87
Gold futures downside profit-take exit price: $1,504
HGD.TO – alternative (Canadian) 2x inverse leveraged gold stocks ETF – the upside profit-take exit price: $16.47
HZD.TO – alternative (Canadian) 2x inverse leveraged silver ETF – the upside profit-take exit price: $36.87
Long-term capital (core part of the portfolio; our opinion): No positions (in other words: cash)
Insurance capital (core part of the portfolio; our opinion): Full position
Whether you’ve already subscribed or not, we encourage you to find out how to make the most of our alerts and read our replies to the most common alert-and-gold-trading-related-questions.
Please note that we describe the situation for the day that the alert is posted in the trading section. In other words, if we are writing about a speculative position, it means that it is up-to-date on the day it was posted. We are also featuring the initial target prices to decide whether keeping a position on a given day is in tune with your approach (some moves are too small for medium-term traders, and some might appear too big for day-traders).
Additionally, you might want to read why our stop-loss orders are usually relatively far from the current price.
Please note that a full position doesn't mean using all of the capital for a given trade. You will find details on our thoughts on gold portfolio structuring in the Key Insights section on our website.
As a reminder - "initial target price" means exactly that - an "initial" one. It's not a price level at which we suggest closing positions. If this becomes the case (as it did in the previous trade), we will refer to these levels as levels of exit orders (exactly as we've done previously). Stop-loss levels, however, are naturally not "initial", but something that, in our opinion, might be entered as an order.
Since it is impossible to synchronize target prices and stop-loss levels for all the ETFs and ETNs with the main markets that we provide these levels for (gold, silver and mining stocks - the GDX ETF), the stop-loss levels and target prices for other ETNs and ETF (among other: UGL, GLL, AGQ, ZSL, NUGT, DUST, JNUG, JDST) are provided as supplementary, and not as "final". This means that if a stop-loss or a target level is reached for any of the "additional instruments" (GLL for instance), but not for the "main instrument" (gold in this case), we will view positions in both gold and GLL as still open and the stop-loss for GLL would have to be moved lower. On the other hand, if gold moves to a stop-loss level but GLL doesn't, then we will view both positions (in gold and GLL) as closed. In other words, since it's not possible to be 100% certain that each related instrument moves to a given level when the underlying instrument does, we can't provide levels that would be binding. The levels that we do provide are our best estimate of the levels that will correspond to the levels in the underlying assets, but it will be the underlying assets that one will need to focus on regarding the signs pointing to closing a given position or keeping it open. We might adjust the levels in the "additional instruments" without adjusting the levels in the "main instruments", which will simply mean that we have improved our estimation of these levels, not that we changed our outlook on the markets. We are already working on a tool that would update these levels daily for the most popular ETFs, ETNs and individual mining stocks.
Our preferred ways to invest in and to trade gold along with the reasoning can be found in the how to buy gold section. Furthermore, our preferred ETFs and ETNs can be found in our Gold & Silver ETF Ranking.
As a reminder, Gold & Silver Trading Alerts are posted before or on each trading day (we usually post them before the opening bell, but we don't promise doing that each day). If there's anything urgent, we will send you an additional small alert before posting the main one.
Thank you.
Przemyslaw K. Radomski, CFA
Founder, Editor-in-chief

