Briefly: In our opinion, full (150% of the regular full position) speculative short positions in gold, silver and mining stocks are justified from the risk/reward perspective at the moment of publishing this alert.
The precious metals market seems to have once again reacted to increased tensions from North Korea. The issue is quite complex, so we dedicated a large part of our monthly Market Overview analysis to it. This month, we are making the report available to all Gold & Silver Trading Alert subscribers as it has important implications for the situation on the charts and thus the outlook. You can read the latest monthly report using this link.
Long story short, there is historical evidence that the effect that the North Korean tensions are not the thing that is likely to change anything on a sustainable basis. The short-term moves are possible, but they should not be treated with the same reliability as price moves that are based on other events or – in particular – those that take place without a direct reason.
So, can the most recent price moves be trusted and should the price moves be viewed as confirmed? Not really and not yet. Not really, because the breakouts are not significant, and not yet because since the North-Korean tensions are still taking the spotlight, the price moves may not reflect markets’ true intentions.
Before moving to charts we would like to add that we have also seen a lot of non-price and non-volume confirmations that an important top is being formed – the number of messages with questions regarding gold (and the wording that was used in them) that we received (including phone calls from friends that are generally not interested in the markets at all) was not typical. The interest in gold has definitely increased in the last week or so. We have just discussed the implications of the increase in the monthly volume levels in gold and the above is yet another development that makes the move above $1,300 similar to gold’s move above $1,900 several years ago.
Having said that, let’s take a look at the charts (chart courtesy of http://stockcharts.com).

Before discussing the most recent price action, let’s consider the current time of the year. In other words, let’s check gold’s performance after the Labor Day in the past several years:
- 2011: gold plunged about $300
- 2012: gold moved higher at the beginning of September and shortly thereafter formed the key top – the one that started the biggest decline of the past decades
- 2013: gold declined about $200
- 2014: gold’s decline was underway, but still declined over $100 after the Labor Day
- 2015: rather sideways trading followed by a sharp decline in the final part of the year
- 2016: daily rally right after the Labor Day that started a $200+ decline.
The implications here are clearly bearish – almost always huge declines started either immediately or shortly after the Labor Day. This kind of efficiency alone is something that should make one considering opening the short positions in the precious metals market even without taking into account the situation in the USD Index.
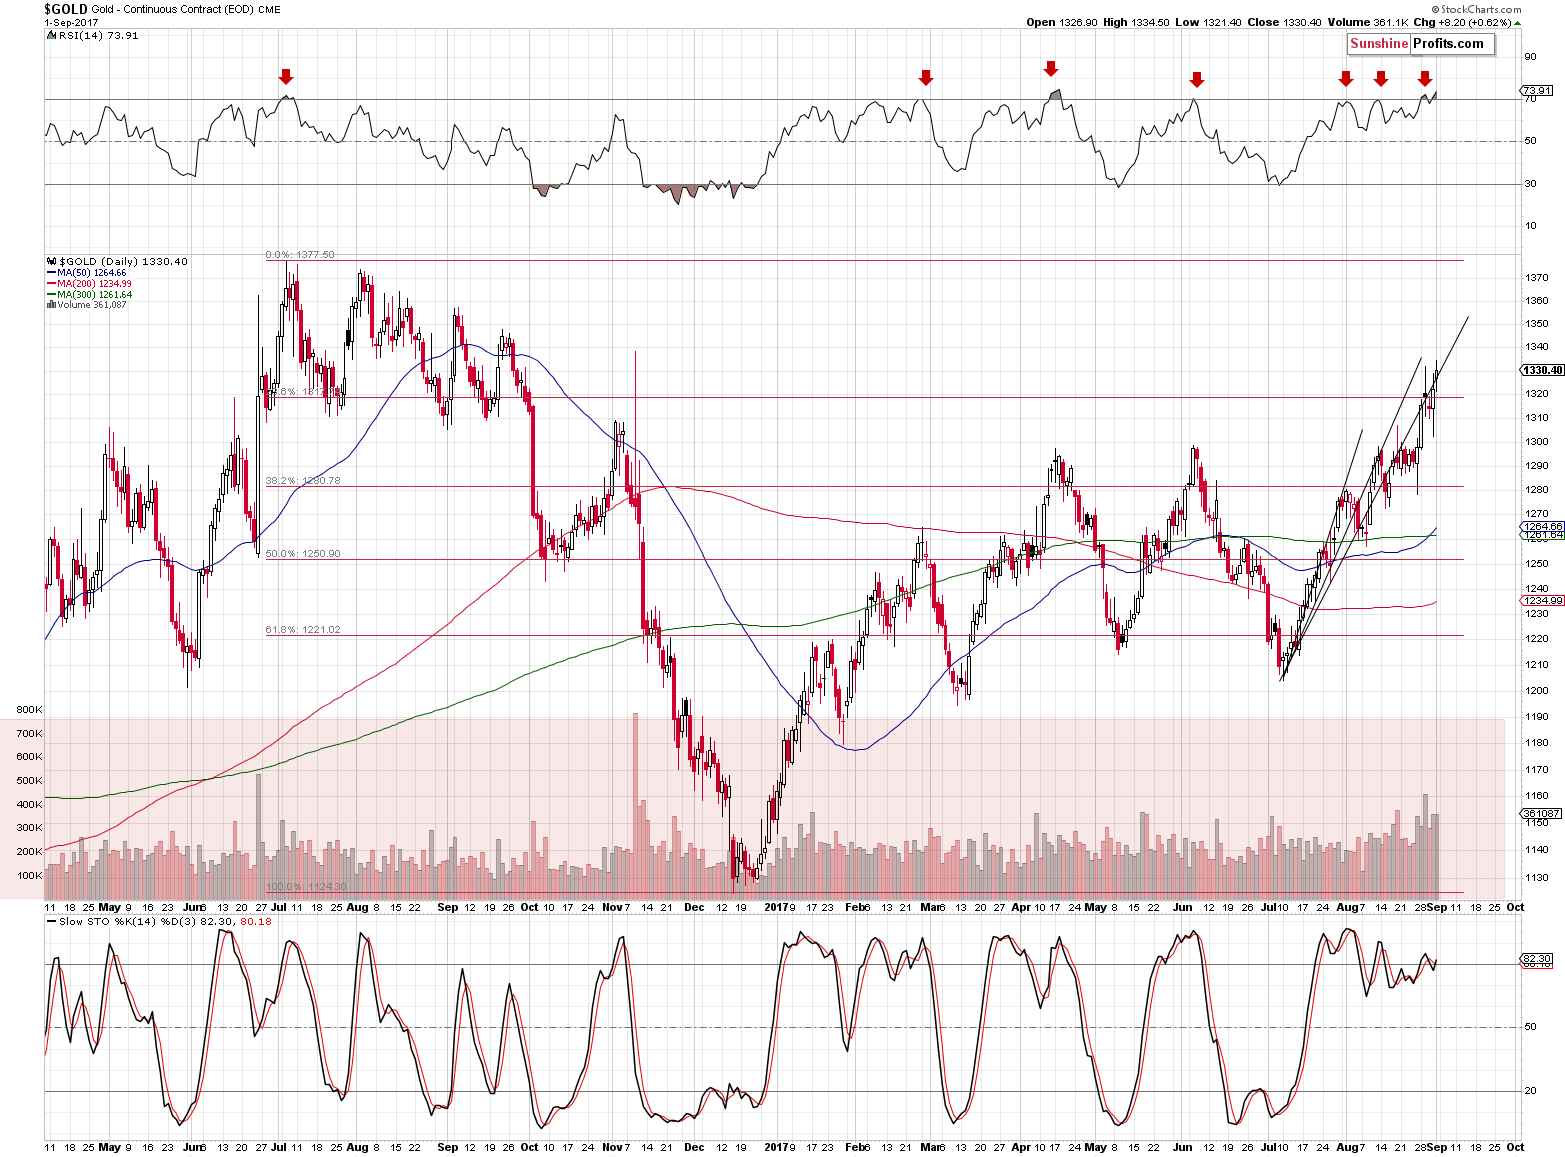
The price of gold moved close to the resistance created by the Trump-election intraday (actually overnight, but the implications are the same) high. It also moved a bit above the most recent high, but its back below it in today’s pre-market trading. In intraday terms, the breakout was invalidated.
Does it have bullish implications that gold closed higher in terms of daily closing prices? In light of the current seasonality and the likely temporary nature of the North-Korean tensions – not really.
The RSI indicator still points to lower prices in the coming days and weeks.

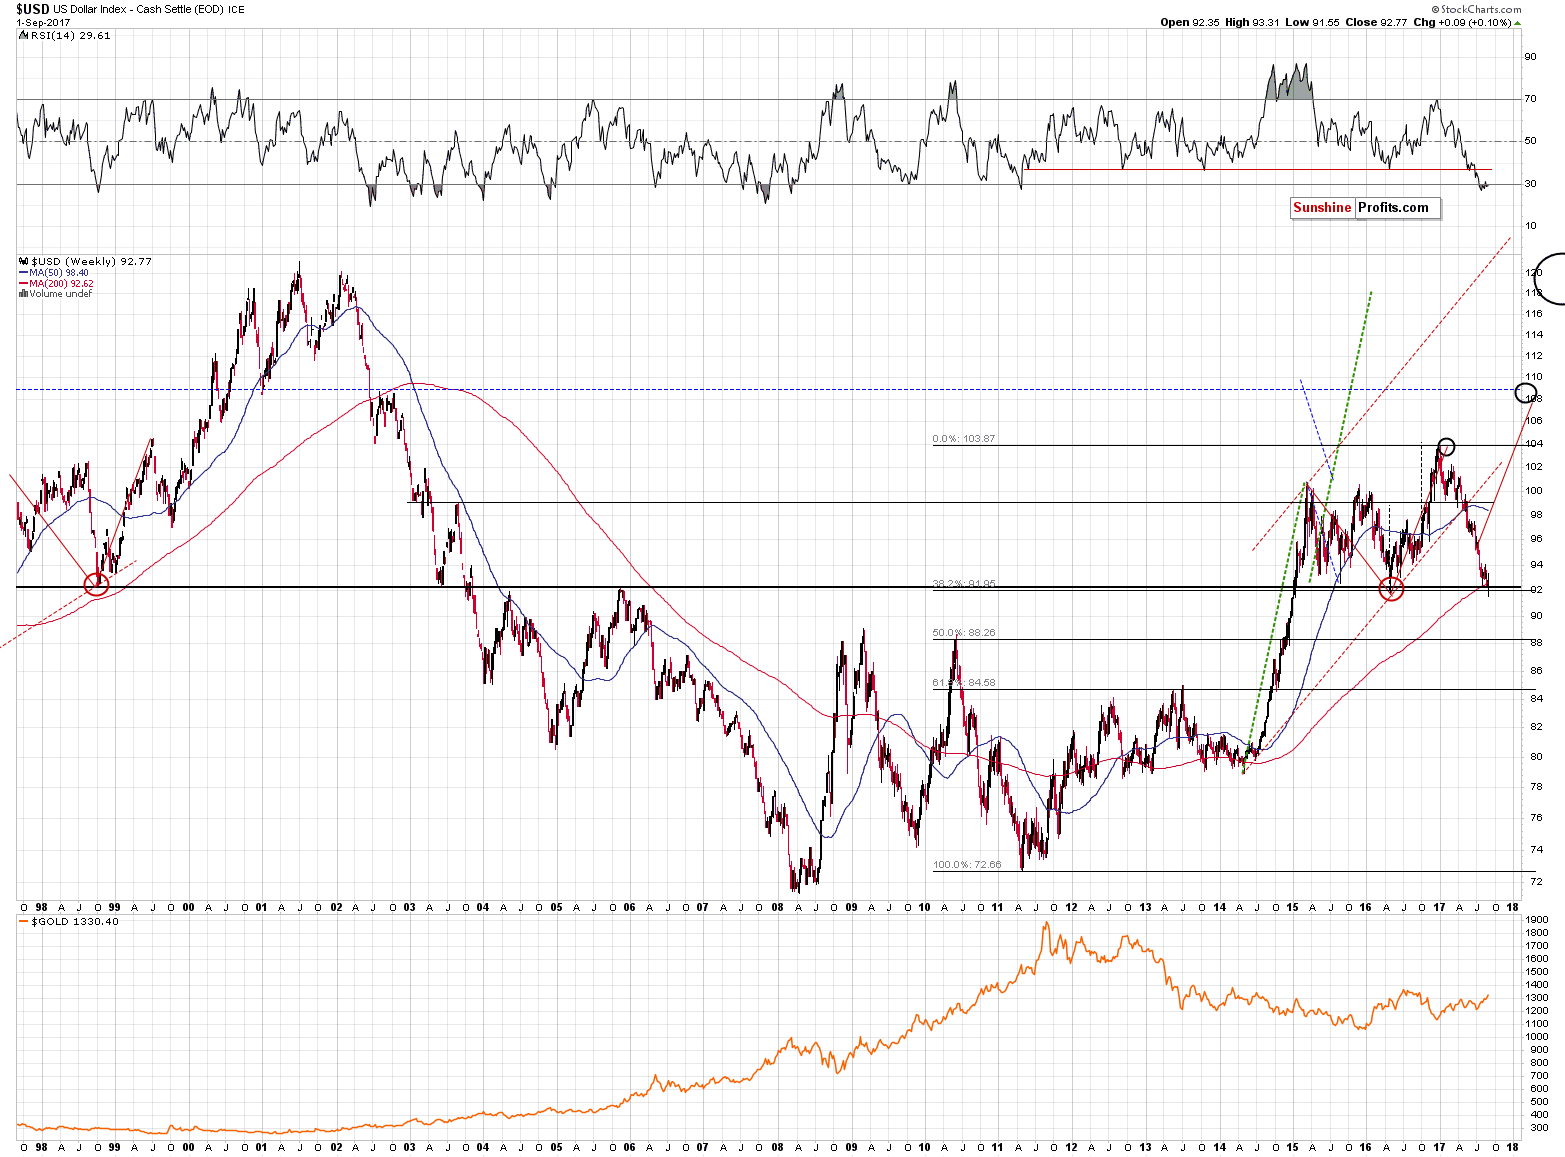
Speaking of the USD Index, it didn’t manage to close the week back above the previous weekly low, but it was quite close. However, it did close the week above the 1998 weekly low, the 2003 weekly low, the 2004 weekly high and the 2005 weekly high, which is profoundly bullish.
Is the breakdown below 2014 and 2015 weekly lows more confirmed? No, in light of the likely temporary nature of the North-Korean price moves, it seems that the breakdown should not be trusted and that the fact that only the USD closed the week above only the most recent weekly lows is not a strong bearish development.
Even though, the USD Index moved to important support levels and the RSI indicator points to the most oversold situation since 2008, traders are not getting excited by its daily upswings – yet. Why? Because it doesn’t appear (!) that the short-term trend changed. Consequently, the lack of reaction in the precious metals toward the daily rallies in the USD are not that surprising.

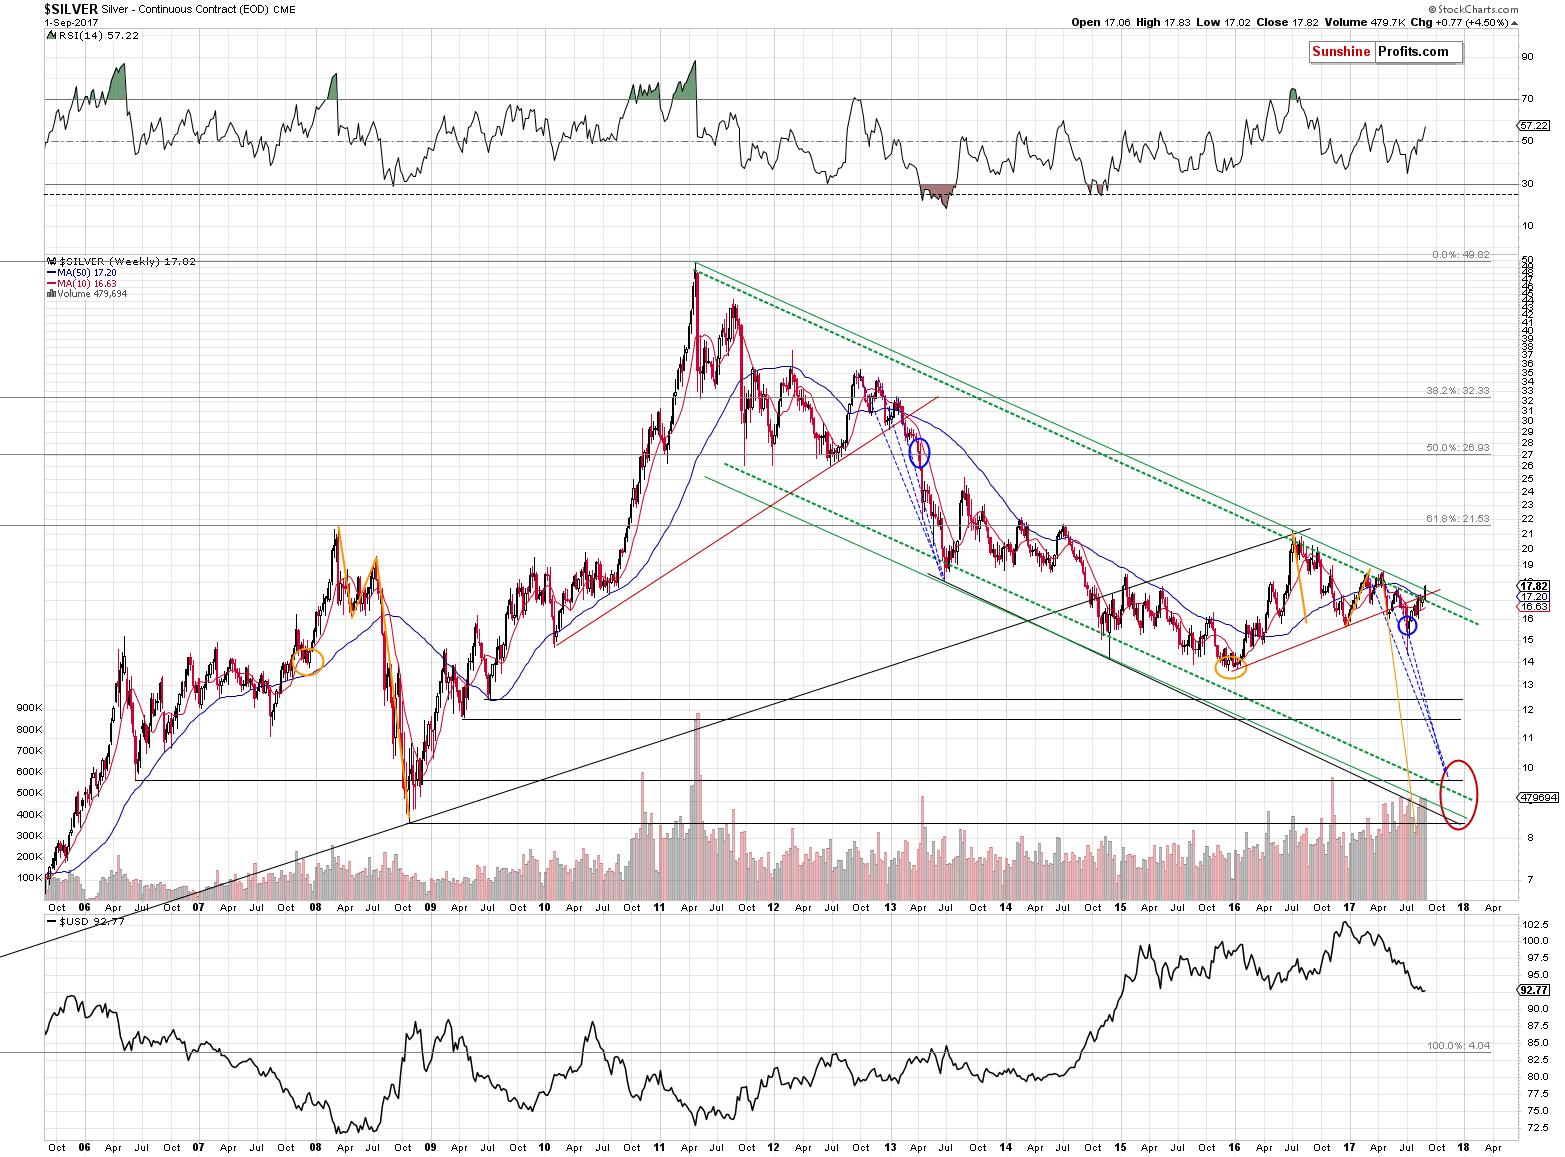
Silver outperformed gold once again and even moved above its important long-term resistance line. Still, that’s… silver and it’s known to outperform and even “fake out” instead of truly breaking out right before a big decline. Should this move in silver be trusted? Just like what we wrote earlier today – not really and not yet. The move might seem significant on a short-term basis, but from the long-term point of view, the breakout is small.

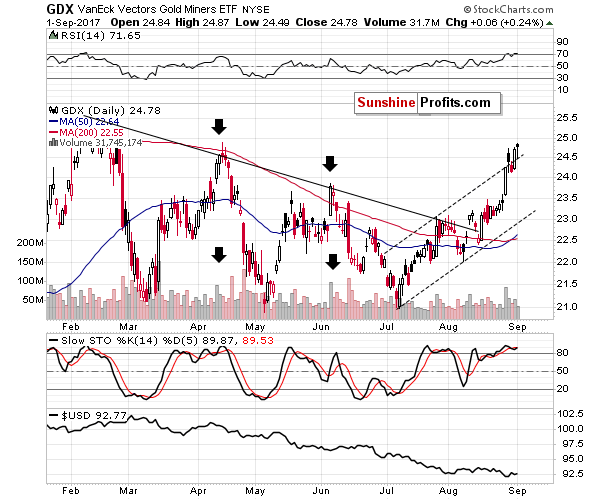
Mining stocks moved to their April highs on declining volume. Comparing that to the level of the USD Index (bottom of the above chart) shows just how weak the performance of the precious metals sector really is this year. The relative performance of mining stocks and silver compared to the price of gold seems to confirm the topping action – the former just underperformed on a daily basis, while the latter outperformed.
Summing up, at the first sight, the situation on the precious metals market appears to have become much more bullish based on the most recent price action, however, looking at these developments from a broader perspective, reveals that the recent upswings are likely to be just temporary. The analysis of the previous North-Korean-based price swings suggests that their implications will disappear relatively quickly. At the same time, the post-Labor-Day seasonality is likely to kick in, and since in almost all cases, huge declines in gold followed in the previous years, the same is very likely to happen this year. The last month’s volume in gold confirms that, the increased level of interest in the yellow metal confirms that and the performance of the USD Index also confirms that. The latter moved below the previous weekly lows, but didn’t invalidate the breakout above several other long-term extremes, which suggests that a big upswing is still just around the corner.
As always, we will keep you – our subscribers – informed.
To summarize:
Trading capital (supplementary part of the portfolio; our opinion): Short positions (150% of the full position) in gold, silver and mining stocks are justified from the risk/reward perspective with the following stop-loss orders and initial target price levels / profit-take orders:
- Gold: initial target price level: $1,063; stop-loss: $1,346; initial target price for the DGLD ETN: $81.88; stop-loss for the DGLD ETN $39.94
- Silver: initial target price: $13.12; stop-loss: $19.22; initial target price for the DSLV ETN: $46.18; stop-loss for the DSLV ETN $17.93
- Mining stocks (price levels for the GDX ETF): initial target price: $9.34; stop-loss: $26.34; initial target price for the DUST ETF: $143.56; stop-loss for the DUST ETF $21.37
In case one wants to bet on junior mining stocks' prices (we do not suggest doing so – we think senior mining stocks are more predictable in the case of short-term trades – if one wants to do it anyway, we provide the details), here are the stop-loss details and initial target prices:
- GDXJ ETF: initial target price: $14.13; stop-loss: $45.31
- JDST ETF: initial target price: $417.04; stop-loss: $43.12
Long-term capital (core part of the portfolio; our opinion): No positions (in other words: cash)
Insurance capital (core part of the portfolio; our opinion): Full position
Important Details for New Subscribers
Whether you already subscribed or not, we encourage you to find out how to make the most of our alerts and read our replies to the most common alert-and-gold-trading-related-questions.
Please note that the in the trading section we describe the situation for the day that the alert is posted. In other words, it we are writing about a speculative position, it means that it is up-to-date on the day it was posted. We are also featuring the initial target prices, so that you can decide whether keeping a position on a given day is something that is in tune with your approach (some moves are too small for medium-term traders and some might appear too big for day-traders).
Plus, you might want to read why our stop-loss orders are usually relatively far from the current price.
Please note that a full position doesn’t mean using all of the capital for a given trade. You will find details on our thoughts on gold portfolio structuring in the Key Insights section on our website.
As a reminder – “initial target price” means exactly that – an “initial” one, it’s not a price level at which we suggest closing positions. If this becomes the case (like it did in the previous trade) we will refer to these levels as levels of exit orders (exactly as we’ve done previously). Stop-loss levels, however, are naturally not “initial”, but something that, in our opinion, might be entered as an order.
Since it is impossible to synchronize target prices and stop-loss levels for all the ETFs and ETNs with the main markets that we provide these levels for (gold, silver and mining stocks – the GDX ETF), the stop-loss levels and target prices for other ETNs and ETF (among other: UGLD, DGLD, USLV, DSLV, NUGT, DUST, JNUG, JDST) are provided as supplementary, and not as “final”. This means that if a stop-loss or a target level is reached for any of the “additional instruments” (DGLD for instance), but not for the “main instrument” (gold in this case), we will view positions in both gold and DGLD as still open and the stop-loss for DGLD would have to be moved lower. On the other hand, if gold moves to a stop-loss level but DGLD doesn’t, then we will view both positions (in gold and DGLD) as closed. In other words, since it’s not possible to be 100% certain that each related instrument moves to a given level when the underlying instrument does, we can’t provide levels that would be binding. The levels that we do provide are our best estimate of the levels that will correspond to the levels in the underlying assets, but it will be the underlying assets that one will need to focus on regarding the signs pointing to closing a given position or keeping it open. We might adjust the levels in the “additional instruments” without adjusting the levels in the “main instruments”, which will simply mean that we have improved our estimation of these levels, not that we changed our outlook on the markets. We are already working on a tool that would update these levels on a daily basis for the most popular ETFs, ETNs and individual mining stocks.
Our preferred ways to invest in and to trade gold along with the reasoning can be found in the how to buy gold section. Additionally, our preferred ETFs and ETNs can be found in our Gold & Silver ETF Ranking.
As a reminder, Gold & Silver Trading Alerts are posted before or on each trading day (we usually post them before the opening bell, but we don't promise doing that each day). If there's anything urgent, we will send you an additional small alert before posting the main one.
=====
Latest Free Trading Alerts:
The U.S. economy added 156,000 jobs in August. What does it mean for the gold market?
Payrolls in August 2017 and Gold
=====
Hand-picked precious-metals-related links:
PRECIOUS-Gold edges up, hovers near 1-year high on haven demand
Yen Losing its Haven Sheen to Gold on North Korea
Perth Mint's August gold sales slip on month, silver sales lowest in a year
Mobius Foresees Cryptocurrency Crackdown Sparking a Rush to Gold
New gold norms dent festive sales
India Plans to Set New Gold Bourse Rules in November
=====
In other news:
Putin Echoes China in Rejecting Tougher North Korea Sanctions
South Korea seeks bigger warheads, North Korean ICBM reportedly on the move
Bank of Canada to hike rates in October, September risk fairly low: Reuters poll
Yes, Nations Can Spend Their Way Out of Recessions. Sometimes.
Draghi Seen Acknowledging Euro Gains at September Decision
Look under the bonnet and the US economy is in for a rough ride
Nassim Taleb identifies the tail risk exposure investors should hedge
U.S. crude rises, gasoline falls as refineries restart
ICO crackdown may just be the start: China is reportedly planning tighter cryptocurrency rules
Robert Shiller wrote the book on bubbles. He says “the best example right now is bitcoin.”
=====
Thank you.
Sincerely,
Przemyslaw Radomski, CFA
Founder, Editor-in-chief, Gold & Silver Fund Manager
Gold & Silver Trading Alerts
Forex Trading Alerts
Oil Investment Updates
Oil Trading Alerts


