We promised you an update and here it is. Let's get back to what happened on Friday. All in all, the Fed didn't announce QE3. Bernanke said that it may become a fact in the future, which is what we already knew. Some viewed the speech as a hint that QE3 has just become more likely and consequently markets rallied. Whether or not changes have been substantial enough to make the medium-term case for precious metals truly bullish will be discussed below.
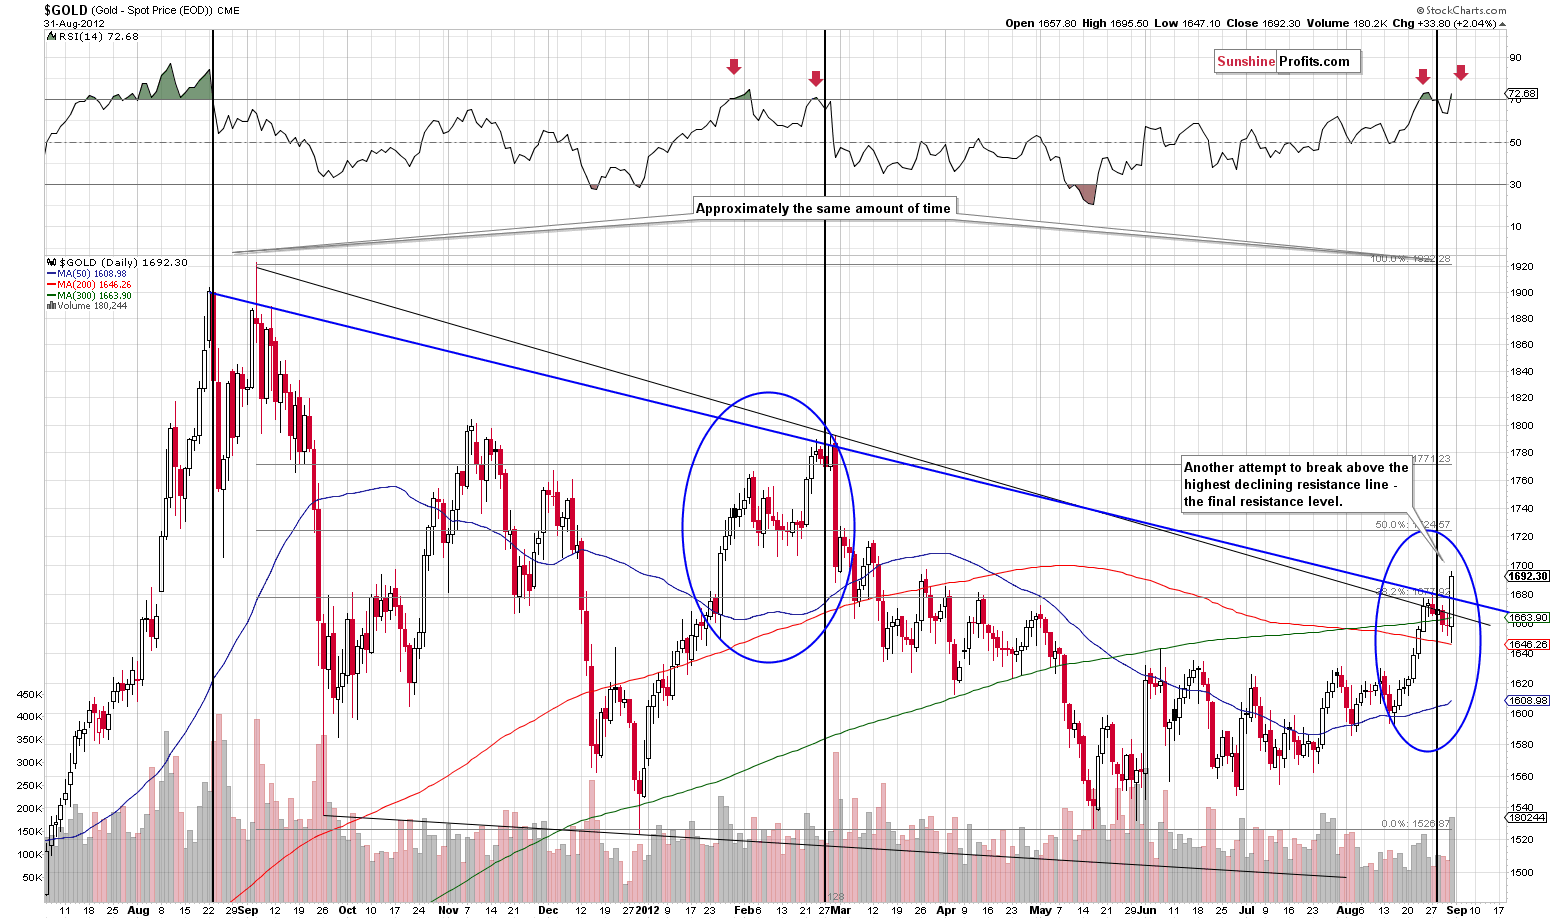
Gold has broken above the medium-term support line (charts courtesy of http://stockcharts.com; click the chart below to enlarge.)
Analogous breakouts have been seen in the non-USD gold chart and gold to bonds ratio.
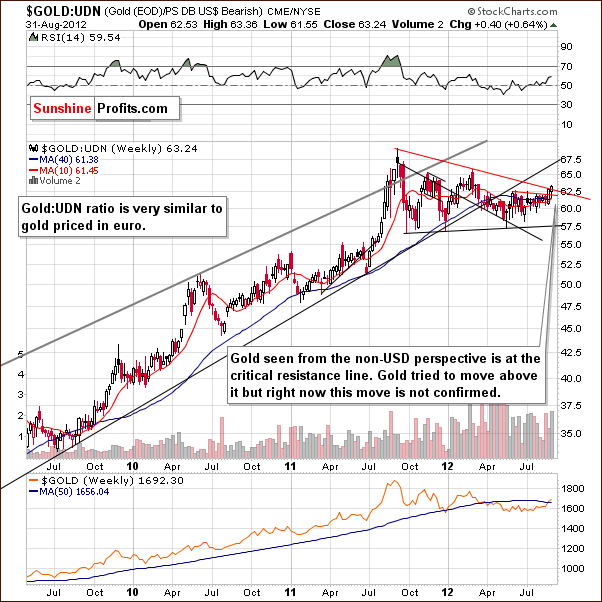
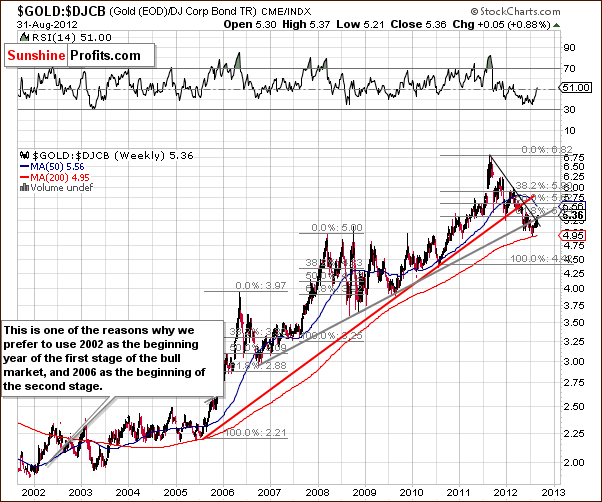
However, none of these breakouts was verified - taking the long-term perspective, allows one to see that Friday's move was not huge enough to confirm the breakout on its own. So, Friday's rally was bullish, but not strongly bullish.
Friday's price rally is not the only thing that we see on the above charts. The RSI based on the price of gold is now extremely overbought, which is an important bearish point.
Additionally, the time between previous tops is more or less equal to the time between today and the previous top. Approximately, the previous top formed 6 months after the previous one. Right now we are 6 months after the previous top. Also, markets like "anniversaries" and last year gold plunged in September. On the gold chart you can see that the situation looks similar to what happened in February 2012. These are weak, but still bearish factors.
Earlier we wrote that gold didn't rally despite the fact that it was featured on top of the Yahoo! Finance website. It turned that the market didn't react only initially - the rally followed later during the day. However, is this enough? Gold is more than $200 below its 2011 high despite the fact that a concept of the gold standard is once again making the headlines. On a side note, Friday's rally took gold $36.30 higher, which is not even close to biggest intraday rallies.
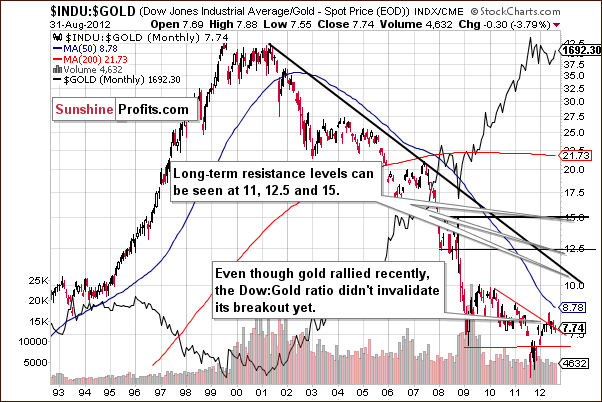
Dow:gold ratio moved right to the critical support line without breaking it.
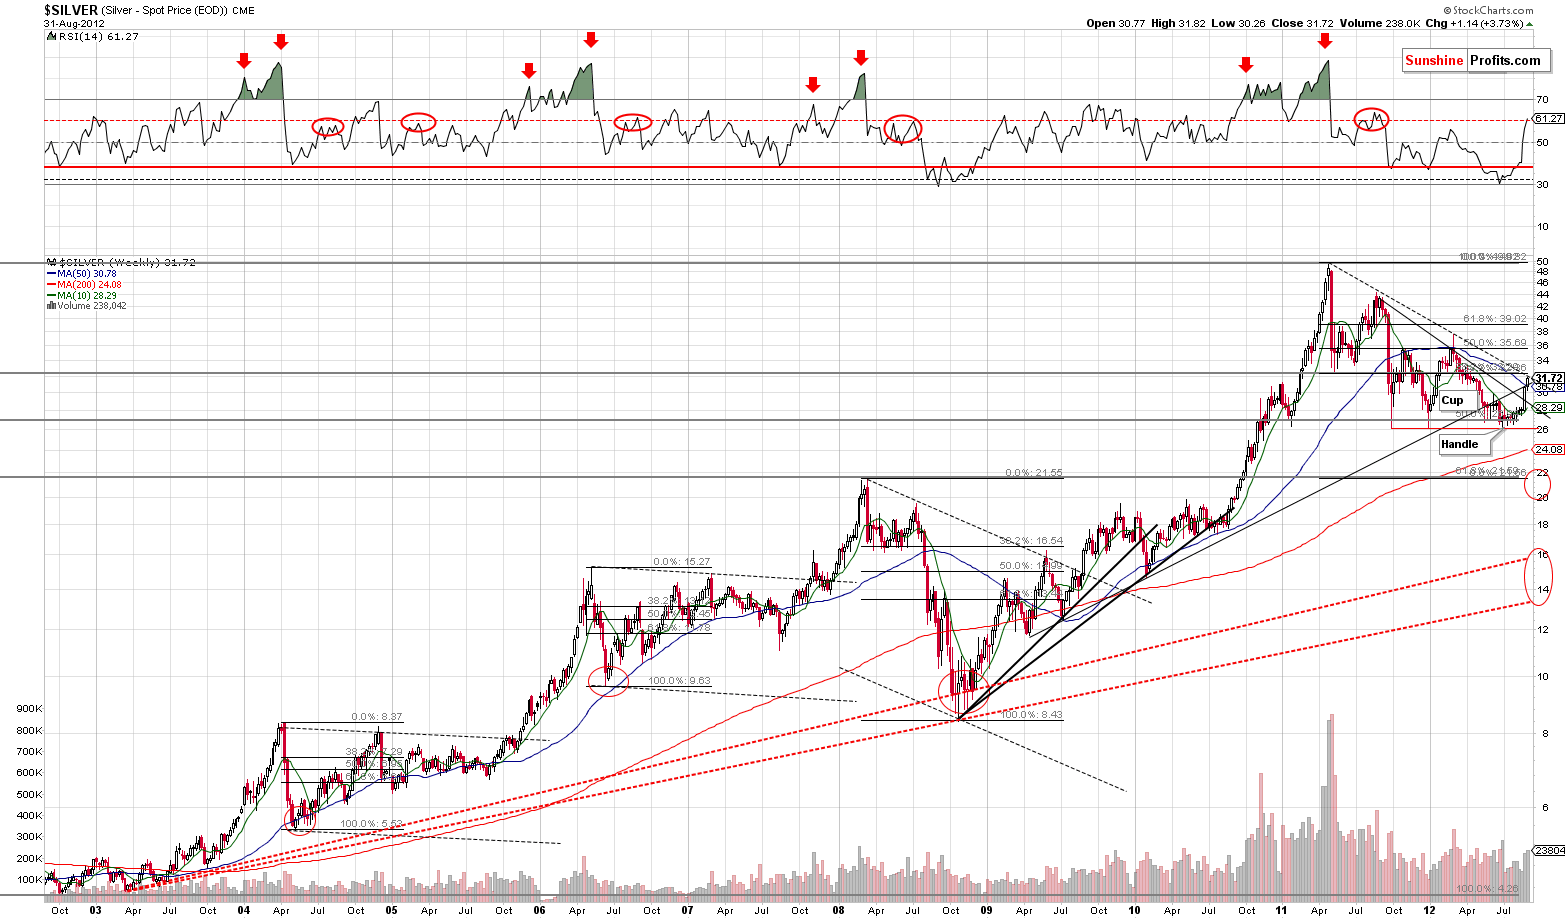
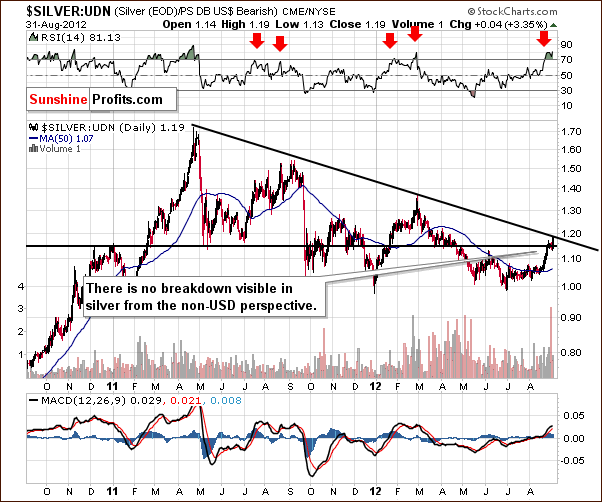
Silver seen from both perspectives: USD and the non-USD ones didn't break out above declining lines analogous to the ones seen in gold. It moved above the previous support lines, but this move has not been confirmed so far.
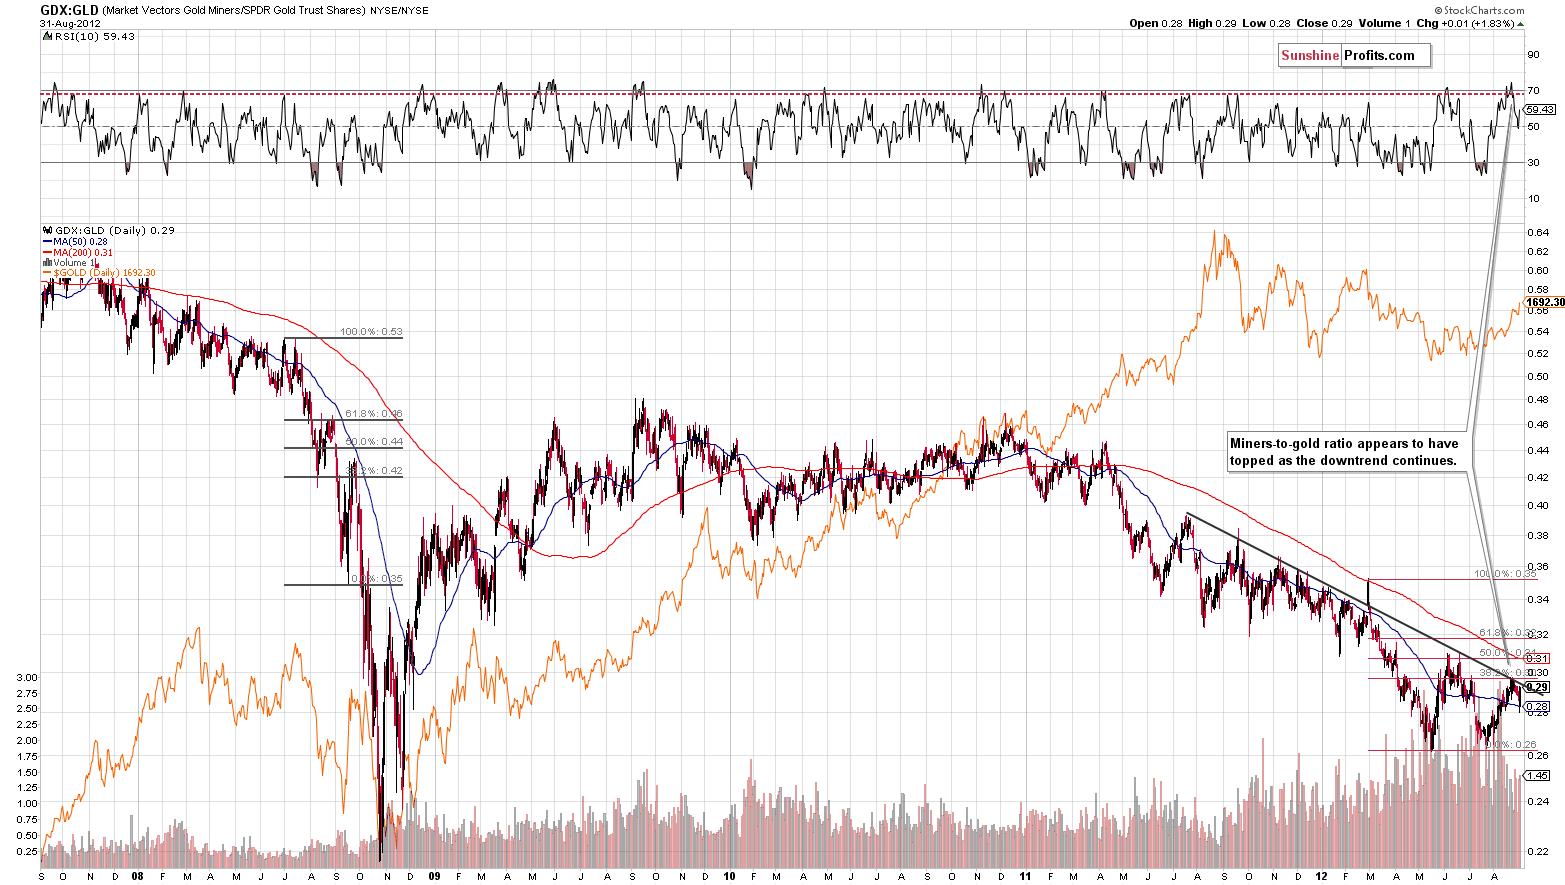
The GDX:GLD ratio remains below the medium-term resistance line – no changes here.
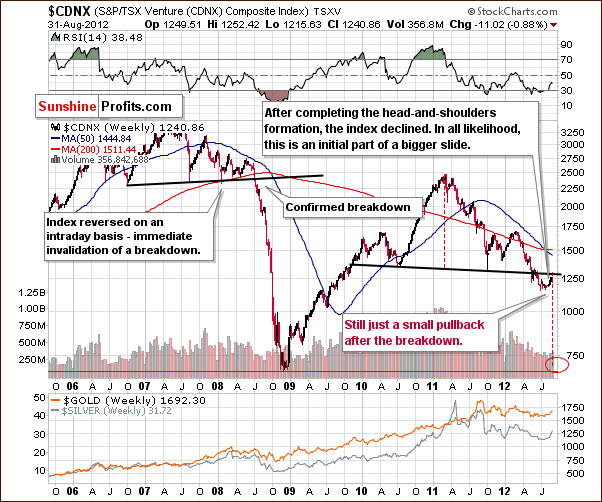
There were no changes in the TSX Venture picture and it remains bearish.
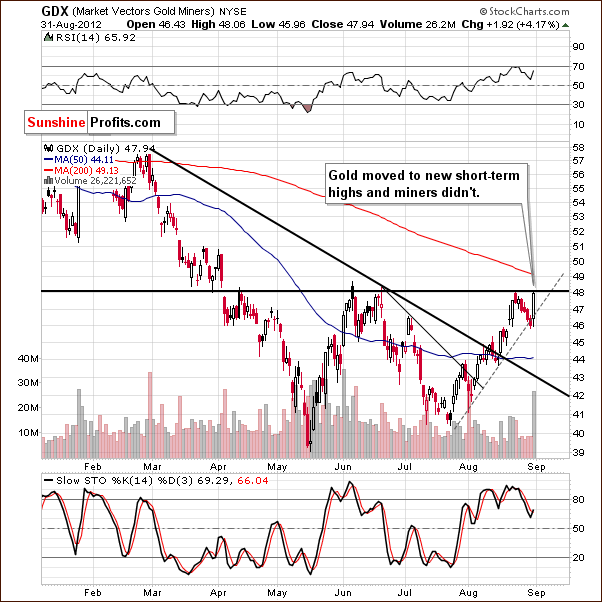
The GDX ETF rallied on Friday along with metals, but unlike metals, it didn't move to new highs. It actually moved to its August and June (!) highs. The old saying is that when gold is making new highs and miners don't, a top is formed.
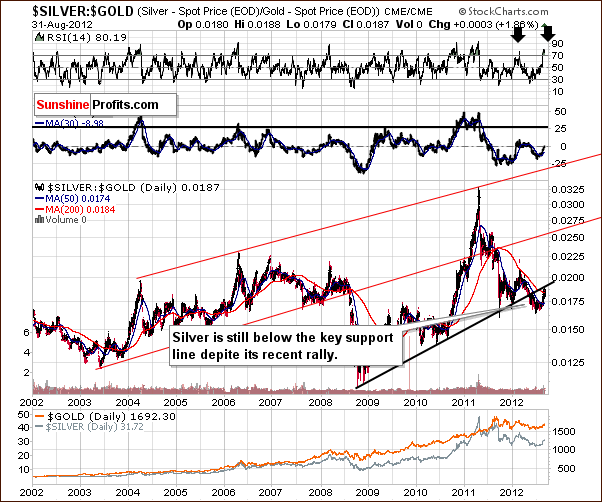
There was no breakout in silver:gold ratio either. The breakdown above the rising resistance line has been confirmed and not invalidated recently.
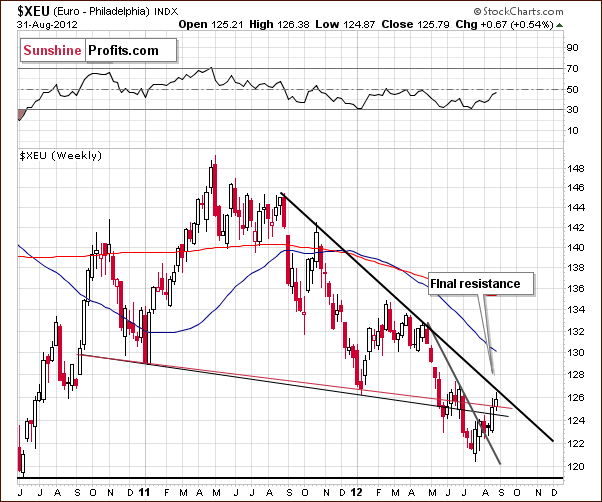
The Euro Index moved higher on Friday, above the declining red resistance line. The breakout has not been confirmed so far and now we have another – and in fact final – resistance line in play. That's the medium-term declining resistance line.
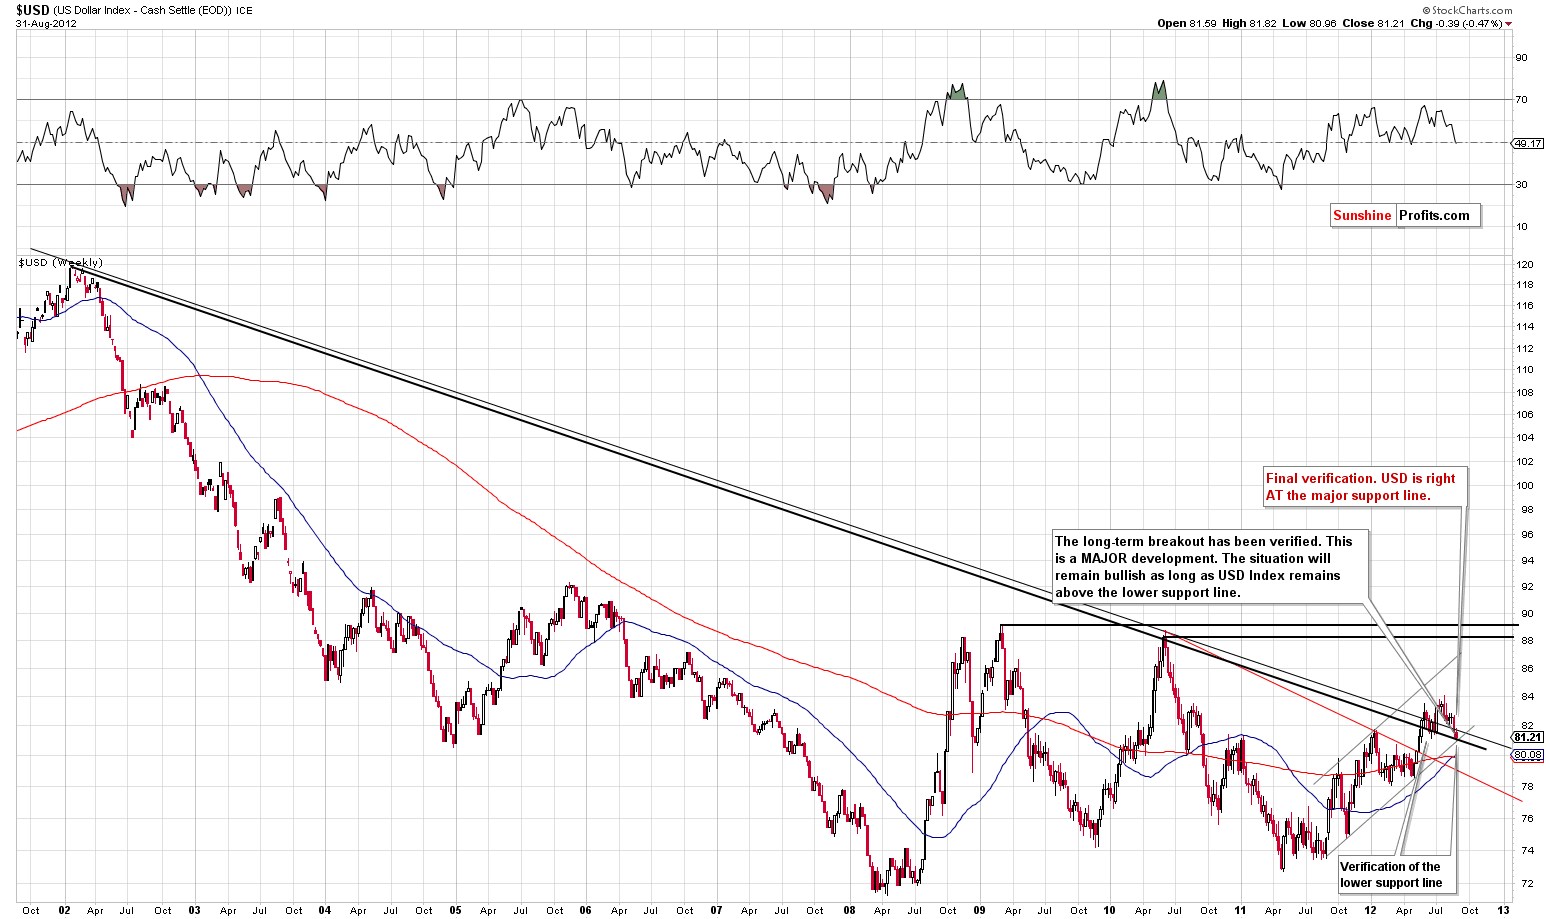
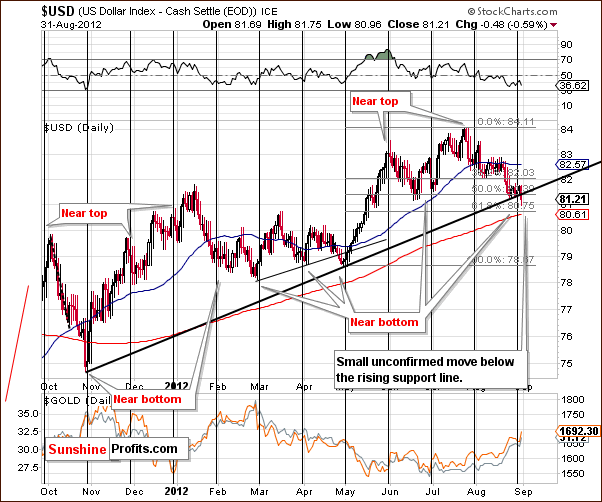
Because of the strong link between USD and gold, it seems that gold buyers might be buying right at the top.The USD Index is right AT its major, long-term support line. Not close, not very close – it was clearly touched on Friday. The short-term support line has been modestly broken (unconfirmed breakdown), but the long-term support line held. It seems that by selling USD now one might sell right at the bottom.
We have a breakout in gold - yes, but it was not confirmed by:
- 3 consecutive trading days
- Size of the move - from the long- and medium-term perspective the rally is not that much above the resistance lines,
- Analogous breakout in silver, silver to gold ratio, and – especially – miners and miners to gold ratio,
- Analogous breakdown in the dow to gold ratio,
- Analogous breakdown in the USD Index
When the above bullet points are no longer “in gold's way” meaning for instance that the USD Index breaks below its major support line, the situation will become clearly bullish. The question remains which of the above are critical ones – what has to happen to get back on the long side of the market without the risk of buying right at a local top.
This is where the above links with what we promised you earlier – providing you with a set of outcomes that may be seen and our suggested actions in each of them.
1. If gold holds above $1,675 for 2 more consecutive trading days, we suggest getting back on the long side of the market (buying metals) with both: long-term capital and speculative capital (thus closing short positions and going long gold).
2. If gold moves above $1,720 (intraday) we suggest getting back on the long side of the market (buying metals) with both: long-term capital and speculative capital (thus closing short positions and going long gold).
3. If a signal is seen from
SP Gold Stock Extreme Indicator (please keep in mind that you can check when the latest signal was seen on our homepage, click the “Last time our indicators have flashed a signal on ...” link for details) we suggest getting back on the long side of the market (buying metals) with both: long-term capital and speculative capital (thus closing short positions and going long gold). This signal would likely be seen if gold corrects or after it plunges.
4. If the USD Index moves below 81 and stays there for 3 consecutive trading days, we suggest getting back on the long side of the market (buying metals) with both: long-term capital and speculative capital (thus closing short positions and going long gold).
5. If gold moves to $1,350 or silver moves to $22 we suggest getting back on the long side of the precious metals market with one's long-term capital and closing the short positions in the mining stocks.
Until any of the above 5 outcomes materializes, we suggest being partly out of the precious metals market with one's long-term investments and betting on lower values of mining stocks with speculative capital.
The above doesn't say anything about silver or mining stocks, but the above covers these markets indirectly. The main reason for the short position in the miners is dollar's bullish potential (the medium-term trend still remains up) – and a confirmed breakout in gold would also invalidate the bearish picture in the miners.
At this point we view the probability of a big decline (below $1,500 in gold) in the near future (this or the next month) at 65% - we lowered it from 70% based on Friday's rally. As a reminder, the next Premium Update is scheduled for Friday, September 14, 2012, but we will send out and publish a Market Alert / Message as soon as possible in the following week – most likely on Wednesday.
Thank you.
Przemyslaw Radomski


