
Friday's session was very interesting(actually, quite extraordinary), so we believe a thorough post-update update is necessary. There are simply so many things to cover that we decided to use this form instead of simply sending you a message. First we'll analyze each of the important charts, then we'll summarize them and then we'll move to implications. Contrary to regular updates, the following will be more of an essay than a report, as we'd like to show you the complexity of the current state of the precious metals market.
Having said that, let's jump right into the first – and most visible – anomaly that we saw this week.
Before Friday's session we viewed mining stocks' underperformance as something strange but nothing alarming. We believed that gold moving higher despite mining stocks' weakness was a bearish - yet very temporary phenomenon. While we don't admit it often, a repeat of this pattern on Friday was something that surprised us.
Yes, the main stock indices moved lower which was likely to contribute to miner's underperformance, but in such an extreme way.
Miners' underperformance is now extreme, so we decided to take a very detailed look into the ratio between mining stocks' prices and that of gold. At first glance the situation appears to be something we've seen many times - sometimes mining stocks lead and sometimes they lag gold, no big deal. However, we felt that this analysis is not deep enough and that we're missing something. So we decided to take a more quantitative approach and apply the ROC (rate of change) indicator for the GDX:GLD ratio (miners vs. gold) and compare that to the price of gold. We found some interesting patterns and after additional research (i.e. using practically all reliable indicators on this ratio) we discovered that RSI and MACD used to provide quite accurate calls as well. Please take a look below for details (charts courtesy of http://stockcharts.com) and click on the chart to enlarge it.
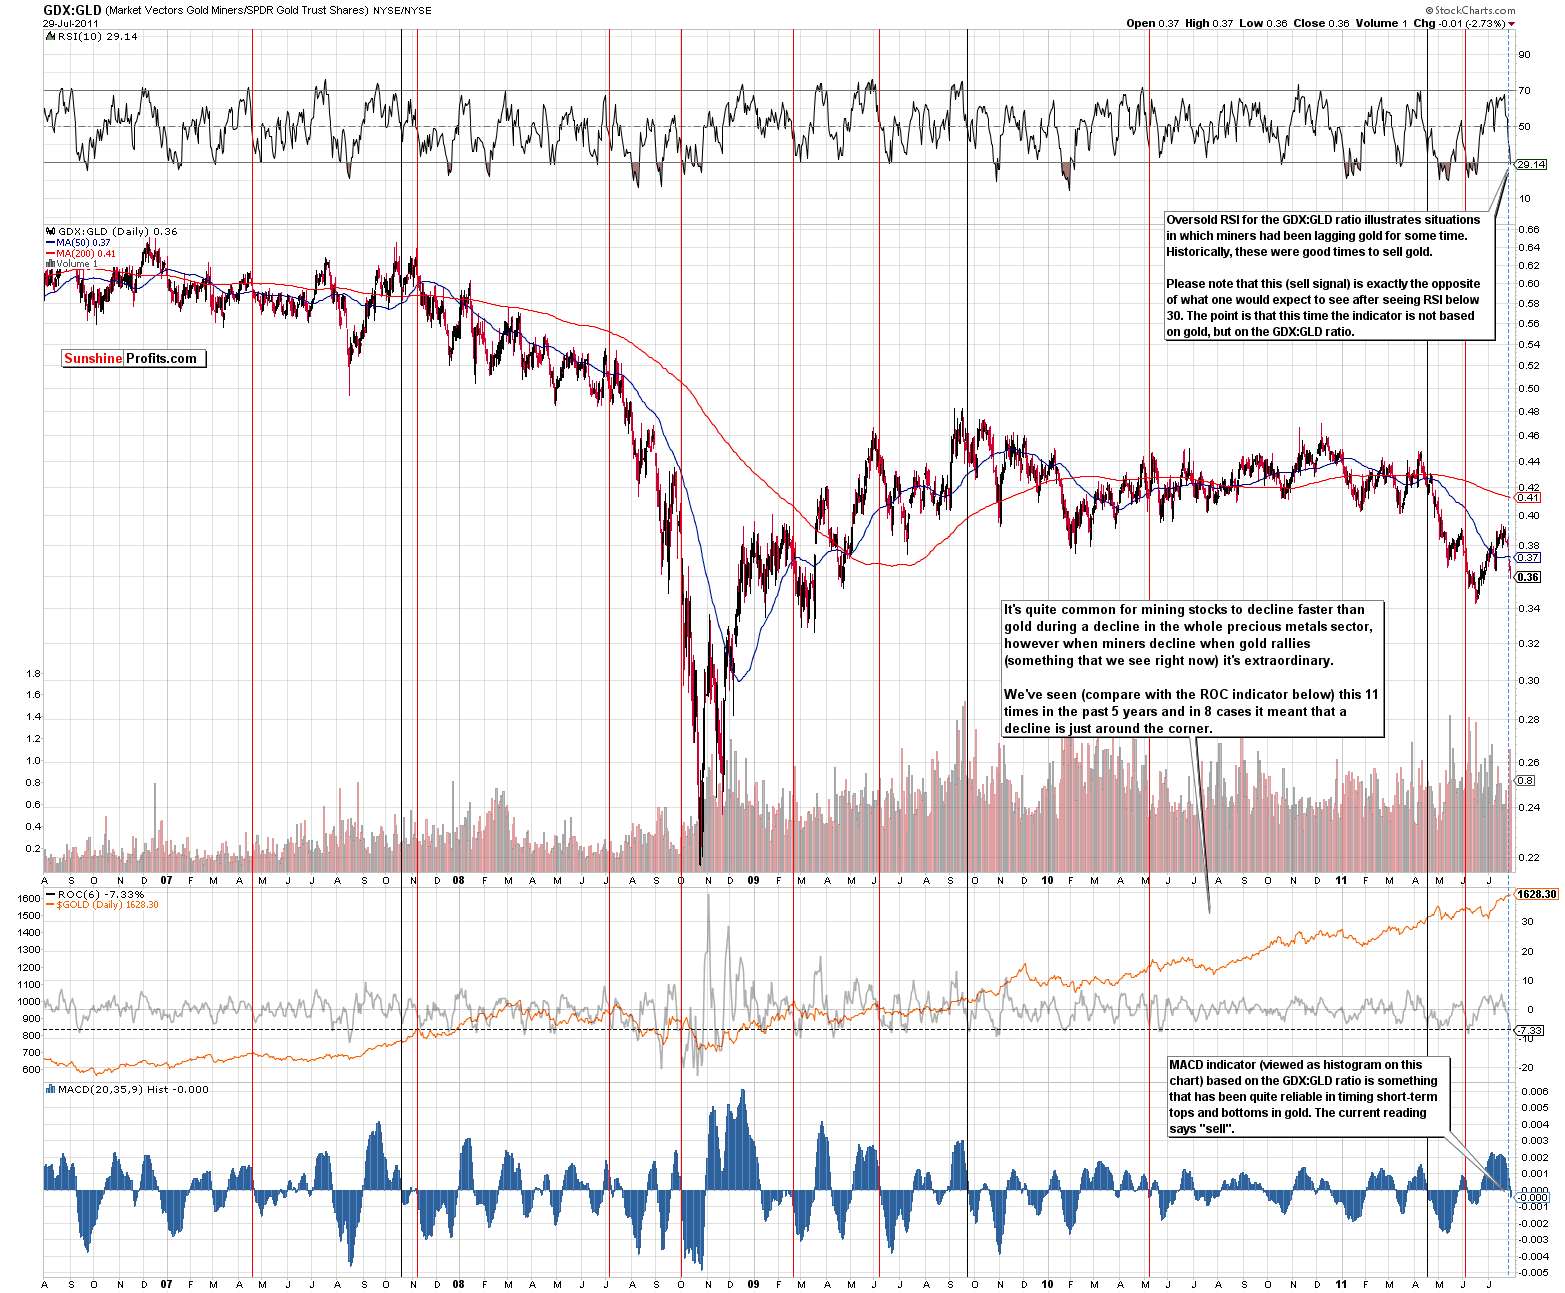
In sum, miner’s extreme underperformance relative to gold is a clearly a bearish factor. This means that based on this chart alone, gold is very likely to move lower, like miners – and not that miners are likely to simply catch up.
Let’s take a look at our Correlation Matrix for a more detailed picture. Please focus on the values marked with orange arrows.
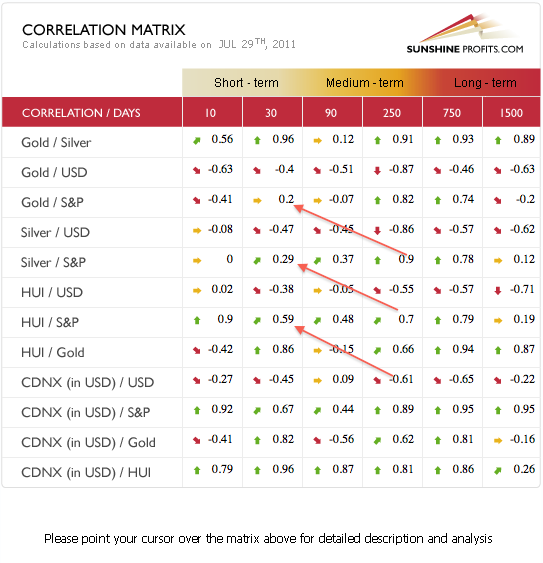
The correlation between miners and stocks is quite important while the one between gold and stocks is rather small. Silver’s correlation numbers are somewhere in between. The point is that miners have been driven by stocks to a much greater extent than the rest of the precious metals sector. In other words, there was a good reason for mining stocks to decline – it was a sharp move lower in the general stock market. So – as stocks continue to move lower, the situation is going to become more bearish for miners and they will eventually drag gold lower – much lower – at least that’s what we might have inferred based on the above. However, the story gets much more interesting when we take a look at the chart featuring the stock market, to make sure that it is indeed likely to move lower.
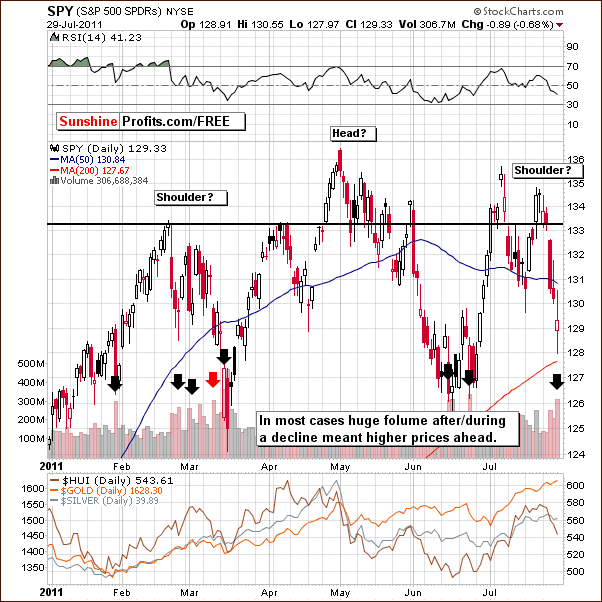
The problem is that stocks have likely put a short-term bottom on Friday or are very close to doing so.
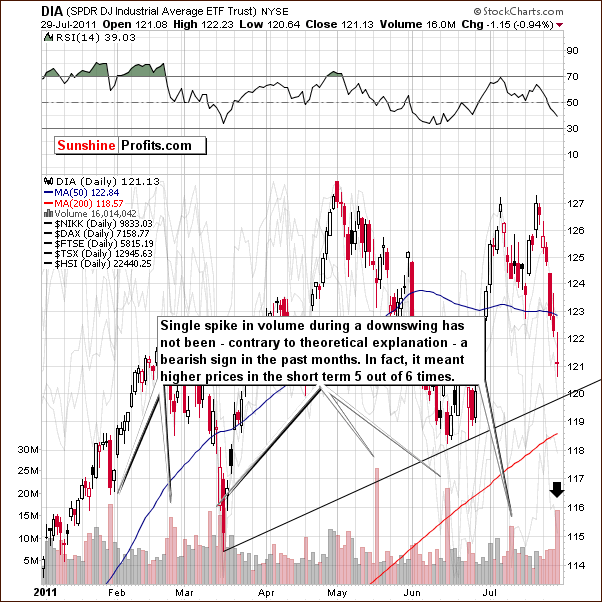
The volume on the SPY ETF was high, and other stock ETFs (like DIA), confirm that. Moreover, we saw an intraday turnaround in stocks and the financials (below) even managed to move slightly higher.
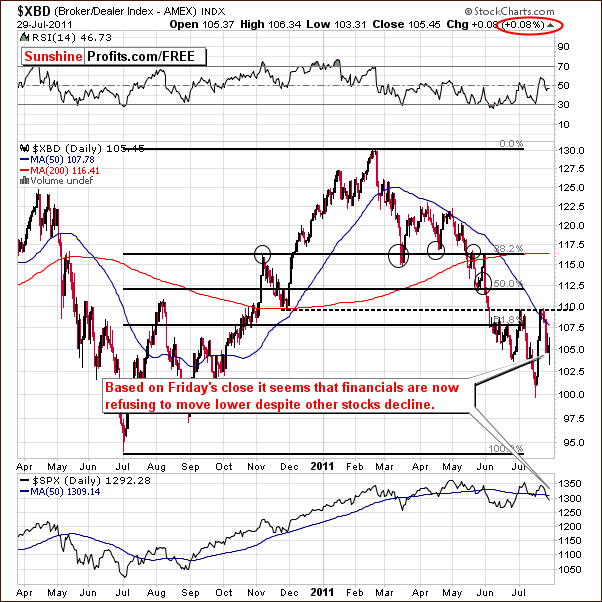
As we’ve mentioned in many previous updates, the financial sector often leads the rest of the general stock market, so the fact that it has just refused to move lower is bullish.
With all these bullish stock-market-related factors in place it seems appropriate to expect higher values of the stock indices in the coming days.
This means that miners may be positively influenced by stocks, which in turn may lead to them catching up with gold. This is the opposite of what appears likely based on the analysis of the GDX:SPY ratio alone, so the situation is complicated. At this point we were hoping to see some clarifying signs from other markets and we have indeed found a few interesting phenomena.
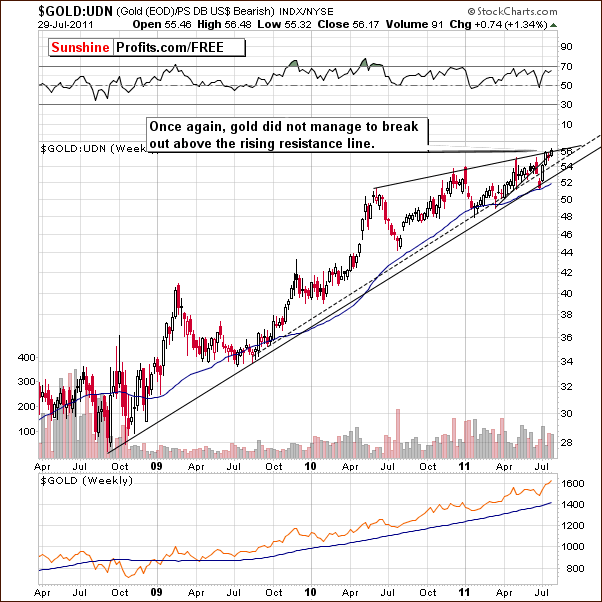
Let’s begin with the least confusing one. Namely, the gold price from the non-USD perspective is still below the rising resistance line, so the situation is not truly bullish.
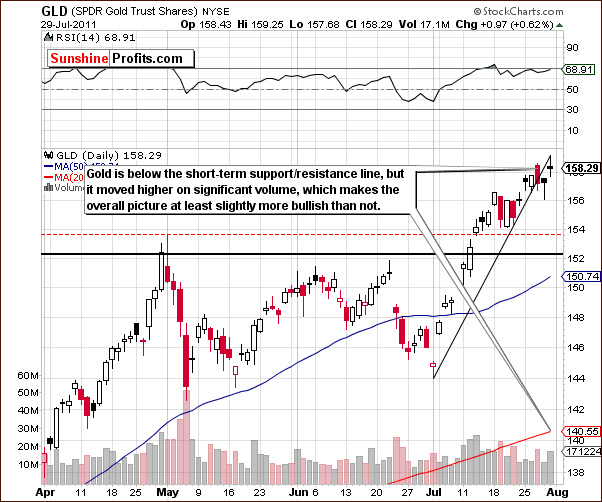
Meanwhile, from the USD perspective gold moved to new highs and – most importantly – this time it moved higher on significant volume. The implications are bullish.
So, in addition to quite confusing situation in miner’s/gold ratio, we also have a mixed situation in gold (with a slight bullish bias).
As we’ve mentioned in previous Premium Updates, the major move up or down could be ignited by a substantial decline or rally in the USD Index. In our latest Premium Update, we wrote the following:
In the short-term Euro Index chart this week, we see that a recent breakout above the declining resistance line was quickly followed by a move back to it. At this point, it appears that we may be seeing an invalidation of this breakout as the index level moved below the support/resistance line and then back up to it. The situation is indeed tense, for if a rally is seen from here, we could have a confirmation of a breakout. On the other hand, a move lower would likely invalidate any breakout and would be a very strong bearish signal in and of itself.
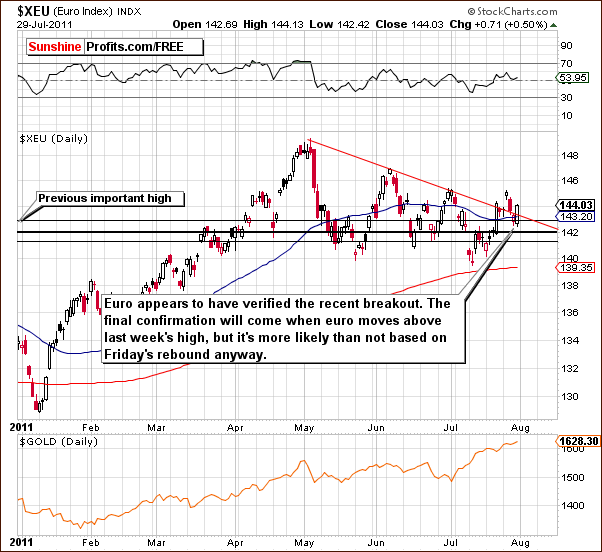
Friday’s price action suggests that the bullish case is now more probable. The euro appears to have confirmed the move above the declining support line, which has now turned into a support. The move was not too big in the case of the USD Index, but the situation is rather bearish in the latter either way. Please take a look below for details.
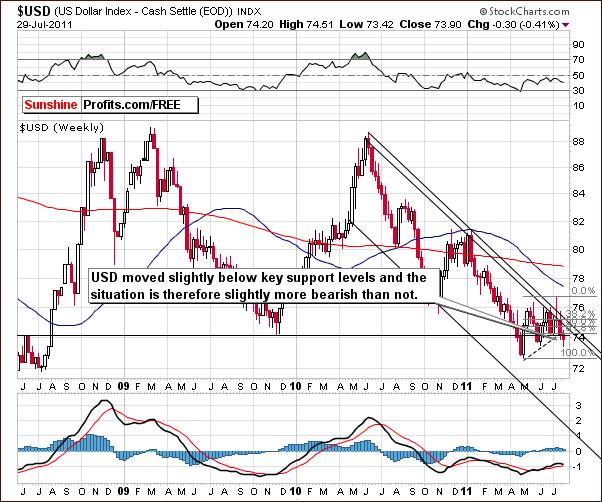
Consequently, at this point we have a small indication from the currency markets that USD Index will not break out above the declining trend channel and thus may not influence gold in a negative way. Again, that’s only an indication at this point as the move was quite small so far.
Another thing that we mentioned in Friday’s Premium Update was the platinum market. We wrote the following:
Platinum is now at a short-term resistance line which is clearly visible. A turnaround is seen in the chart and this is a very important development. This top took the form of an intraday reversal on significant volume and price continued to move lower on big volume on the following day. This is a bearish sign and has negative implications for precious metals which, in general, normally move in the same direction as platinum.
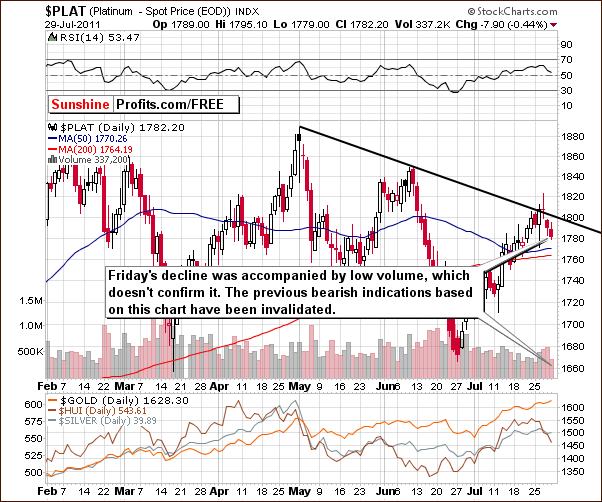
The bearish case has been invalidated on Friday. Price has in fact moved lower, but it did so on low volume, which means that downward may not be the true direction of the market. The situation did not become bullish, but it’s no longer bearish either.
On top of that, we have just seen a signal from our SP Gold Stock Extreme Indicator.
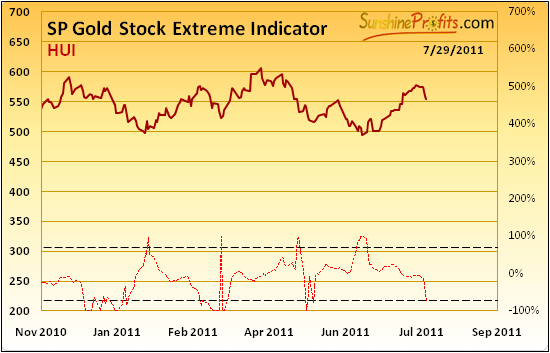
The first issue with this signal is whether it is extreme because gold moved higher (and it forms a top) or because miners moved sharply lower (and they are forming a bottom). The latter is more likely because this indicator was originally designed to time gold stocks.
Moreover, while the move above the upper dashed line meant a local bottom in 100% of cases since 2008, a move below the lower dashed line did not have the same effect in many cases. In the Nov 2010 - today time frame when the indicator moved below the lower dashed line, declines followed in most cases. The situation would become clearly bullish if we would see a quick move above the upper dashed line in the following days – however this is a confirmation that we don’t have right now.
With all those important – yet contradictory – factors in place the situation is really confusing. We spent Friday’s evening and entire Saturday on the above research before we arrived at the final conclusion.
Summing up, the most probable outcome at this time is another move up in the following week followed by a 1-2 weeks of corrective decline. This outcome is it tune with the seasonal tendencies adjusted for the influence of derivatives. At the same time, we must note that given the amount of above-mentioned uncertainty, this projection may be subject to change as more information becomes available.
The implication is that right now we believe that all speculative trades (regardless whether it was a short or long position) should be closed right now and that being partly invested with one's long-term precious metals holdings is still a good idea.
As far as speculative trades are concerned - gold's move up on significant volume, turnaround in the main stock indices, and a good possibility that the Euro Index will rally make holding short position too risky.
On the other hand, gold from the non-USD perspective has not broken above its resistance level , RSI on the silver chart suggests a move lower and mining stocks have been declining (not to mention sell signals coming from the GDX:GLD ratio chart), which means that opening speculative long positions is too risky as well.
We understand that some Traders reading the above might be disappointed that after all this analysis the final conclusion is “when it doubt, stay out”, but our main duty to you is to report our thoughts to you impartially and quickly. At the same time, we strive to explain our methodology and show you that our analysis is always executed after thorough and even exhaustive research and (even though neither we, nor anyone else will be 100% correct) with the highest amount of care.
At the same time, we would like to reassure you that we continue to monitor the market with particular attention as so many different factors are currently at play that either of them could ignite a profound move in either direction and make us immediately send a Market Alert with new trading thoughts.
Thank you.
Sincerely,
Przemyslaw Radomski

