
Countries bailed out the banks. Now who is left to bail out the countries? While the decline in the euro appears to be very close to being over (as explained in the following part of the update), the fundamental situation of the Eurozone still appears to be one of the most popular topics these days, so the first part of this week's update will be dedicated to this particular part of the world.
All that the European Union's unprecedented package of almost $1 trillion did is buy Europe time. The underlying problem still exists.
David Marsh, author of "The Euro: The Politics of the New Global Currency," put it best. He wrote in a New York Times column :
"The dream of monetary union across Europe has turned into a nightmare. Led by France and Germany, European countries have decided to spend colossal sums of taxpayers' money they cannot afford to heal mounting internal disparities they cannot conceal to shore up an edifice many believe cannot stand."
The mountain of debt that shook the foundations of some of the world's biggest banks and drove the international financial system to the brink of disaster has shifted. Now that some sovereign countries are threatened by insolvency it is more expensive to buy insurance against national default than it is to insure against corporate failure.
We live in an environment dominated by what economists call "political risk"-the uncertainty that investors face as a result of government actions, or inactions, or actions that come too little, too late. There is the uncertainty that some sovereign nations may be no more capable of repaying their debts than the banks they so gallantly rescued. The default of a country could spark a crisis that would make the Lehman Brothers' default look like a market hiccup and make us wish that we had bought even more gold while we had the chance. The current epicenter of the crisis is focused on Greece and the euro zone, but some are talking about trouble looming ahead for the U.S., the U.K. and Japan.
Once government debt levels approach 100% of GDP, much of the country's income from taxes and other sources has to be spent on interest payments on its debt. If a lot of government debt is owned by foreigners, as is the case in the U.S., the money leaves the country rather than being invested in more productive ways. Also once growth disappears, there is little reason for investors to lend the country more since new lending just goes to pay off old debt.
The economic debt crisis has given birth to the "new normal" where governments are the most important players in markets-injecting fiat money into economies on a massive scale and saving troubled banks and companies.
As a result, investors have a vast new range of things to worry about. Last week, the bond giant Pimco, which coined the phrase "the new normal," sent a letter to investors saying that "the new normal" is a world in which "the public sector plays a much more influential role."
We saw a good example of that this Wednesday when German Chancellor Angela Merkel laid out proposals to gain control over "destructive" financial markets, after she imposed a unilateral ban on naked short- selling that sent stocks sliding. (Short sellers borrow assets and sell them, betting the price will fall and they'll be able to buy them later, return them to the lender and pocket the difference. In naked short- selling, traders never borrow the assets so betting is unlimited.)
The ban was introduced with no warning to other European nations and sent the euro tumbling to fresh four-year lows against the dollar. Merkel didn't mince any words and said Wednesday that the Eurozone crisis was the greatest test for the European Union since its creation. The euro is at risk, she said, and Europe may be facing its greatest challenge since the European Union's founding. The consequences are "incalculable" if leaders fail to act.
"It is a question of survival," she said. "The euro is in danger. If the euro fails, then Europe fails. If we succeed, Europe will be stronger."
Some say that Merkel's move smacks of political desperation. The German government did not consult its partners before issuing the change, adding to the sense that new financial regulations will start arriving piecemeal and that Europe's leaders are not united in addressing the crisis.
On Thursday, the S&P 500 plunged 3.9 per cent, a sharper drop than the day of the so-called "flash crash" and its worst decline since April 2009. A worse-than-expected report on weekly US jobless claims did not help matters, nor did tough talk in the Korean peninsula, or the turmoil in Thailand. The fear is clearly in the air, which could mean that the worst - in terms of the market action - is behind us.
This brings us back to the subject of political risk and the great volatility we are seeing. If we look back at just the recent history of the Greek crisis we see how politicians' actions and words can influence the markets.
When the scale of Greece's problems first became clear, Merkel grudgingly agreed to help with a bailout. But it didn't take long for the frugal, hard-working Germans to ask why they should pay for Greece's largely self-inflicted misfortunes, and as elections loomed on the horizon, Merkel began taking a harder line. The tougher she talked, the more nervous the markets became. In late April, Merkel gave a speech in which she said, "Germany will help if the appropriate conditions are met," giving the markets a sense that an aid package was not a sure thing. The yield on Greek debt immediately soared, and within days a rout of the euro was on. As one writer put it, Merkel's "if" may well have been the most expensive two letter word in history. There is no doubt that the European leaders' delays and lack of decisive action damaged the euro and inflated the cost of the aid package. In the markets timing is everything and the same goes for politics.
The idea of currency debasement is a concept etched into the German psyche from the days of hyper inflation during the Weimer Republic. Asians and Latin Americans also know the concept first hand. But for North Americans it's a new idea and more Americans are waking up to the idea that their personal wealth will be eroded by future inflation caused by the trillions of dollars and euros created to finance economic rescue plans.
Deficit spending, rapid money supply growth and negative real interest rates (inflation rate higher than nominal interest rate) are a good recipe for higher gold prices. Right now we have all three ingredients, plus political risk, in what has become the "new normal."
Ten years ago $1,000 bought nearly four ounces of gold. Today $1,000 won't even get you a single ounce. That works out of a 78 percent fall in the value of the dollar in the past decade. In Abu Dhabi they have taken this to heart and the United Arab Emirates press reported this week that a gold bar vending machine, called the "Gold To Go", has been installed in the Emirates Palace Hotel. It dispenses bars in denominations of one, five and ten grams and one-ounce, along with different gold coin ranges including the Canadian Maple Leaf and the South African Krugerrand.In case you were wondering, it is "self-guarding" and shuts down if anything appears to be untoward.
To see if it's worth our while to make our way to the "Gold to Go" vending machine, let's begin this week's technical part with the analysis of the U.S. Dollar. Let's start with the long-term USD Index chart (charts courtesy by http://stockcharts.com.)
USD Index
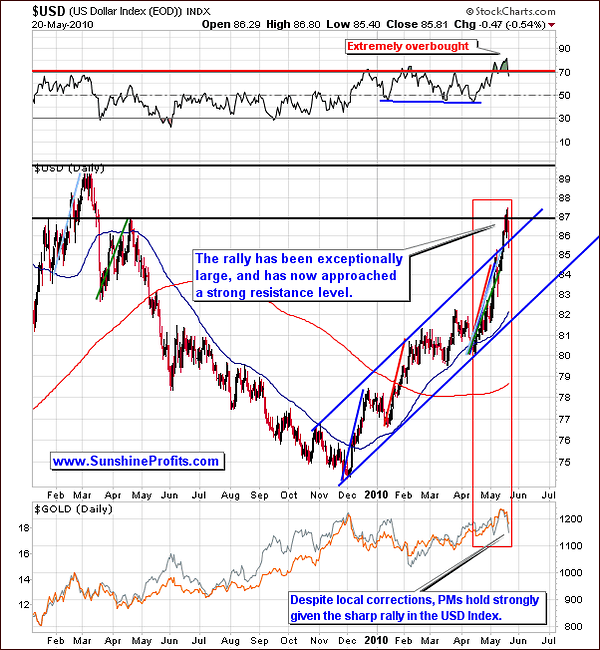
On the long term USD chart, this week we have a continuation of what we've seen in the past few weeks. Recently the USD has been moving up which is a true anomaly and very usual. Ignited by trouble in the Eurozone, the rapid move up has been maintained by the entry into the market of the momentum players. In the end, these traders are likely to take their profits in a quick way, which would cause this rally to slow down. The question is when. In the vast majority of cases, rapid moves are stopped at previous highs, or other strong resistance levels.
This is what we see today since we are approaching a level close to the USD's April 2009 high. The RSI is also in an extremely overbought area in our chart, and this rally has now taken USD much above it was likely, based on the sizes of the previous rallies. Taking all these factors into account, at least a correction is likely to be seen soon before any continued upward movement - if any. This is an important note which will be discussed in more detail later in this update.
If the rally in the USD is not stopped after a consolidation or sideways period, it is very possible the rally will be stopped at the level of 90, its March high, which will truly be a very strong resistance level. It is important to monitor the performance of precious metals and the precious metal stocks relative to the change in value in the USD in the coming days and weeks and check their relative in order to detect if the next upswing in the metals is just a beginning of a new rally, or just a counter-trend correction meaning that PMs rally is in fact over.
As to the recent USD impact on the precious metals sector, we see continued strength here. There has been a visible decline in the PM prices recently but when looking at the level of the USD one month ago, we see it was much, much lower. The precious metals at that time were actually also lower (gold) or close to (silver) where they are today. Gold is presently about 4% higher than it was a month ago, and silver is basically at the same level. During the same time-frame the USD Index moved about 6% higher, which means that generally PMs are relatively strong.
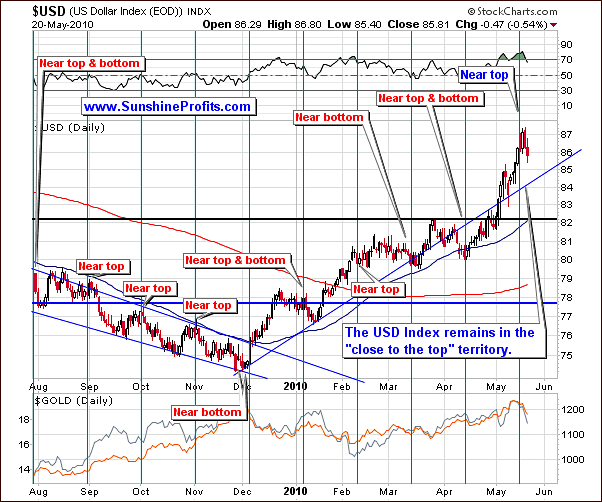
On the short-term chart where we see our cyclical tendencies, we notice that we are still in the "near top" territory. As we discussed last week, the vertical red lines frequently indicate a local top or local bottom. This is consistent with what we see today, expecting that the local top will be formed very soon while we are still close to this point in time on our chart. This will further confirm the points we have made earlier.
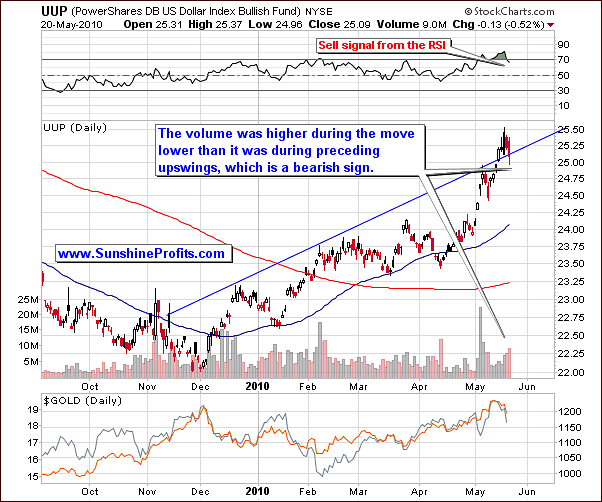
On the UUP ETF chart this week, as we analyze volume, we confirm the bearish points made earlier. We saw a slight move downward coupled with increased volume relative to the previous trading days, which is a bearish sign. The RSI here has crossed the 70 line and is slightly below it, which is a sell signal.
Summing up the USD section of our update, we do expect to see at least a small correction very soon. The relative performance of the PM market during this coming decline will be our main focus, as it is the key to determine the direction in which the PM market is likely to head next. Of course we will report to you accordingly.
If the USD declines and the PMs do not rally or their prices increase on low volume, it is likely that the PM rally will be over or close to being over; we would not be likely to see any new high levels soon. However, if the PM's rally remains strong during a decline in the USD, then a bigger move upwards for the PM sector will be the most probable outcome.
Euro Index
This week, we have inserted a section on the euro in addition to our regular sections. The rally of the USD has been major headline news lately. The euro, which accounts for more than 50% of the USD Index, is therefore properly included in this update, in order to gain additional insight to the future movement of the U.S. dollar.
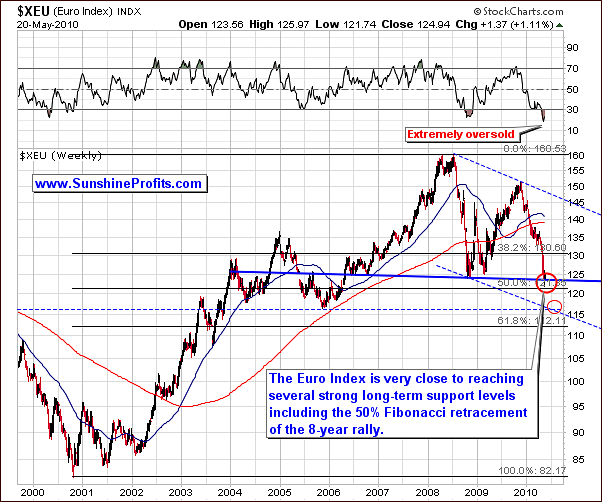
Although at first glance, the chart may be unclear, let us emphasize that the solid lines are most important, sending clearer signals as compared to the dashed lines, which are less likely to be valid. Today we see the euro at a very strong support level. The decline recently has been very sharp and indications are today that it is extremely oversold. What this means to the USD is that the rally we have seen of late may be ending and a decline in the USD likely.
The RSI on the above euro chart has been extremely low, which is a contrarian bullish signal. The RSI is at a level lower than it has been in 10 years. It is lower than the'00 bottom, the '05 low following a sharp decline and also lower than what we saw in '08 after a similar sharp decline.
What this suggests for the euro is that lower prices are unlikely in the near-term. The euro is also at a very strong support level created by a long-term support line, which also used to prove as a resistance in the past. This is one of the points that leads us to believe that the euro is not likely to decline further. It is also close to a previous bottom and close to the 50% retracement level of the full '00-‘08 rally. Prices often decline 38.2%, 50% or 61.8%. We have now seen the euro move to one of these levels, actually slightly above it, and it's likely to hold the current decline for at least a while. However, if we do move lower, it's still likely that we won't go much lower, not below the area marked on the chart with the lower red ellipse (1.16 for the EUR/USD exchange rate). However, it seems that the current support level is likely to hold. The question is if the following upswing would be caused by the increased trust in the euro (gold could decline), or the distrust in the dollar (gold would likely rally).
Again, this is one of the questions that is yet to be answered by the market itself in the following days, and that's why - as mentioned earlier - it will be crucial to monitor the way in which PMs and PM stocks react to the next move in USD and EUR. As always, we will issue a Market Alert should any major change develop.
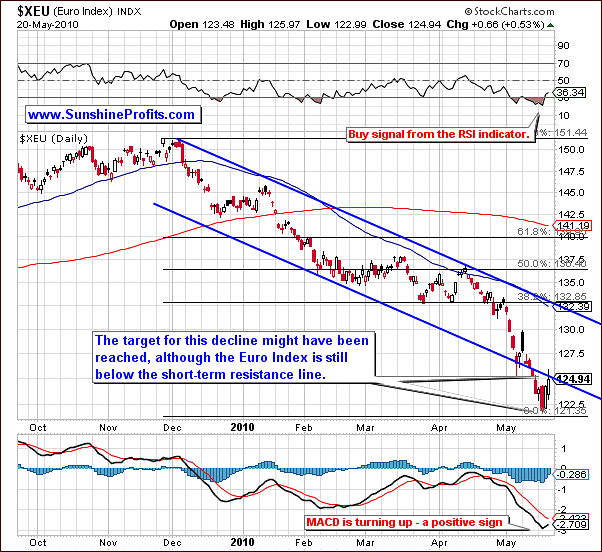
On the short-term chart, close inspection of the decline shows that we have reached a bottom very close to the target, which would be projected by applying the Phi # 1.618. If we apply this factor to the previous December - March decline, we would project the top to being very close to where we are today or, in actuality to where we were just a few days ago. The RSI has just moved above 30, which is normally a buy signal. Still, we are below the trading channel created with the December 2009 trading levels, so it's not yet certain that we will see a rally right away. It is unclear and somewhat similar to the case with the USD Index as we mentioned earlier.
Summing up, the signals coming from the euro at this time point to its price level being close to a bottom right now. Support levels appear to be strong, and it's very unlikely that we will see further declines.
The crisis regarding the euro has made worldwide attention recently. It has been in the news for several weeks. Everyone is aware that the euro has moved significantly lower. Most investors who deal with this market are already shorting it and it's very likely that we have seen the bottom or are about at that bottom right now.
Again, the implications for PMs are that we need to monitor the way, in which PMs and PM stocks react to the next moves in USD and EUR. We will get back to this topic in the following sections dedicated to metals.
General Stock Market
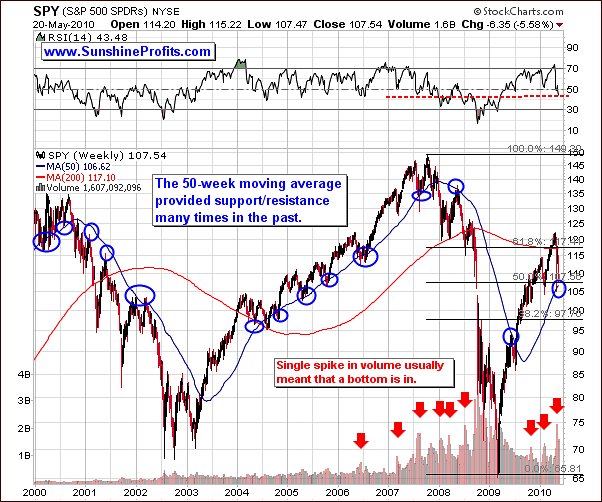
This week's very long term chart will be discussed first for the general stock market. We will use the SPY ETF in order to analyze volume. In our update of May 7th, we made some points that are still valid today. This is because the general stock market has done very little since then - from a weekly perspective. We saw a slight bounce followed by decline, short uptrend, and now we have seen a sharp decline which occurred today as well in the past couple of days. Still, we are at a strong support level created by the 50-week moving average. This is the blue slope line seen in the above chart. Many times in the past this has proven to stop both rallies and declines. We have also seen a spike in the volume on a weekly basis which indicates we are close to or at a local bottom today.
Now, what has changed in the past weeks most noticeably is the RSI, which has moved much lower. Here, the RSI is based on closing weekly prices and after being above the 70 level which is overbought, we have seen it decline dramatically. It is now below 50 as this dramatic downturn has occurred in a very short period of time.
Looking at the historical charts, we see there were two times in past 10 years where a similarly overbought condition (RSI above 70) was followed by a sharp decline that took the RSI to or slightly below the 50 level. This occurred early in '07 and also later in the same year. Please note that in both cases, a sharp rally followed.
While we can't rule out the possibility that the general stock market plunges severely in the future, it is unlikely to take place right away. Please note that even the gargantuan 2008 plunge didn't start right after the top was formed in 2007 - instead we've seen a sharp corrective upswing before the end of the year.
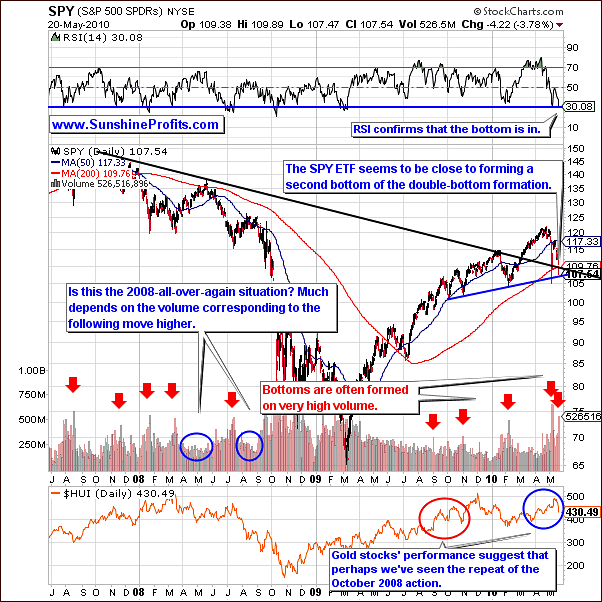
Looking at the long-term chart this week we see a second spike in the daily volume and this normally corresponds to lows in the index. Moreover, the RSI has fallen below 30 and this level has frequently coincided with market bottoms in the past. The question everyone has today is are we seeing 2008 all over again?
We need to have a confirmation before we can agree to this premise. So far there is no evidence that what we've seen recently is more than just short-term correction. Once bearish signals are confirmed, this could actually be the beginning of a significant downturn trend - but until we see that confirmation, the trend remains up. Strong resistance levels at this time have not broken. This suggests that the odds still favor a rally ahead even though the decline appears very scary.
Since stocks have recently plunged severely on huge volume, at least a small rally is likely. The key point to monitor is the volume during the following upswing. There were two cases in 2008 when the volume was low before the next downturn began. It was extremely low in the period prior to June and September 2008 and the downtrends materialized respectively in the middle of 2008 and in October. This is one of the things that we will watch and monitor the days and weeks ahead.
Additionally, in 2008 we've seen a severe under-performance of PM stocks relative to the general stock market. This occurred very visibly before the final part of the market's decline, and also - less visibly - in the middle of 2008. We have not seen this in the PM sector recently. Even though the decline in the PM stocks has been huge and rapid, gold stocks didn't drop more than the main stock indices. The major stock indices are much below their March low, while the HUI Index is clearly above it. This is certainly not what we would call underperforming.
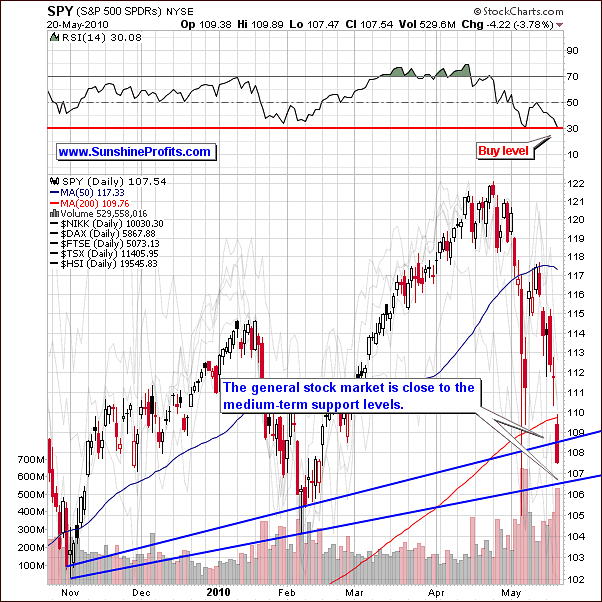
The short-term chart this week shows us many of the same signs which we saw in the long-term chart. The RSI is at a buy level and the general stock market is in a medium-term support level. The line created by daily closing prices is the upper line seen on the chart above. The lower line is formed from the daily lows. The market closed on Thursday between these two lines and the lower line has just been verified during today's session. Therefore, a strong decline from here is unlikely.
Summing up, so far i.a. the performance of gold stocks does not suggest a repeat of October'08 but rather a consolidation period as opposed to a decline or a breakdown. We will monitor the general stock market for an upswing or correction on low volume during the coming weeks accompanied by relatively weak performance of the mining stocks. Should that take place, it could mean that it's 2008 all over again, but unless that happens - or we see other invalidation of the current trend - higher prices continue to be likely.
Gold
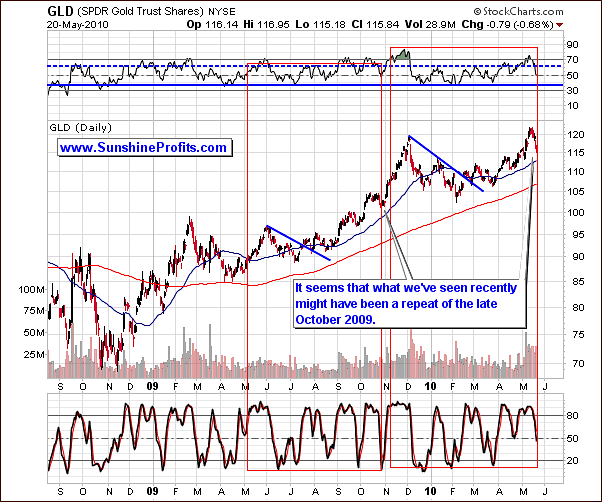
On the long-term GLD-ETF chart this week, we see slight changes compared to recent updates. The most notable change is the way in which we use the self-similar pattern. Last week we stated the inferences from this were blurry. Still based on last week's data, it was slightly more probable that we were in the final stage of the rally.
However, based on what we see today, compared to gold's past performance, we see strong similarities to October 2009. As hard as it may be to believe right now - perhaps we have not seen a top for this rally as of yet. The RSI confirms this, currently around the 50 level. Additionally, the 50-day moving average confirms this - gold is slightly above it, just like it was the case in October 2009. Consequently, so far what we have seen does not invalidate the self-similar pattern, which has proven to be quite reliable in the past. This means that gold is still likely to move higher - at this is going to be the most likely outcome until the bullish patterns are invalidated.
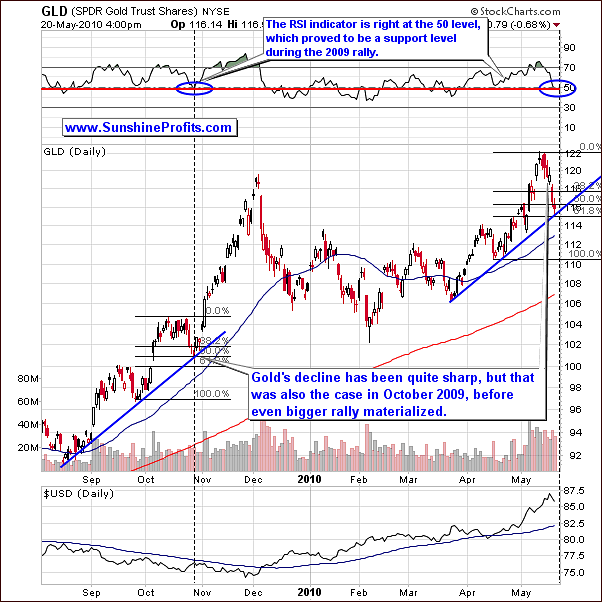
On the short-term chart this week, similarities have been reemphasized between October 2009 and May 2010. Please note that the October 2009 decline corrected almost 61.8% of the recent gains before the move up has been resumed, and this is precisely where we are today. Moreover, back then the decline stopped right at the rising support line. This is also where we are today. Therefore, bullish implications of this pattern still remain in place.
Also, please note that in reference to the Cup and Handle pattern, we are now seeing might be seen as the handle - the end of a bullish formation, which is often followed by a strong move higher. This is a bullish signal.
The suggestion is that a move much higher may be likely once the formation is complete. Right now, we have no evidence of this yet. We will need a breakout on higher volume to confirm this. The current uptrend in spite of RSI weakness shows us that the self-similar pattern is still in place. We state this in spite of the recent sharp, disappointing declines.
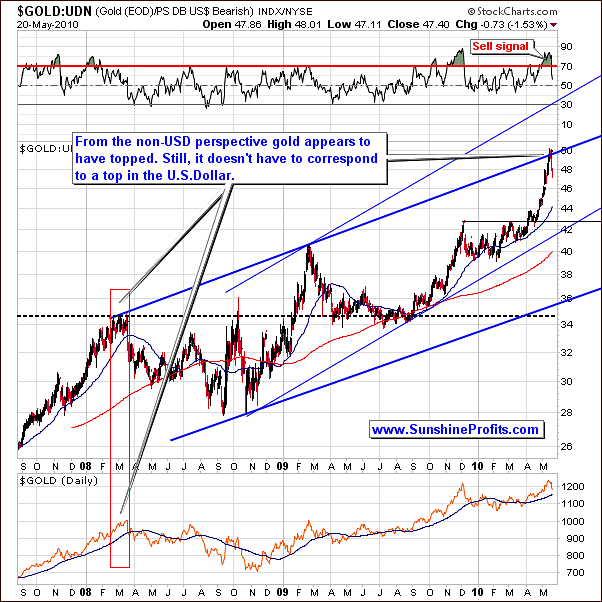
From the non-USD perspective recall that last week we suggested selling gold to Subscribers, who trade gold for currencies other than the U.S. Dollar. Those who did should be please with this action as gold from a non-USD perspective declined. In fact we just got a confirmation from the RSI indicator.
What is important here for the U.S. Investors is that this top does not have to coincide with a top in gold from the USD perspective.
In the previous Premium Update, we wrote the following:
Please take a look at the red rectangle on the above chart, as we may see similar performance in the following days. A decline in the USD could easily cause the price of gold to increase (in USD terms) but at the same time it could have no effect on the price of gold in other currencies, for instance in euro.
The above paragraph is up-to-date also today.
We don't want to make an impression that we are gold perma-bulls and we never suggest getting out of one's positions. To the contrary - we have successfully done so numerous times in the past, but the key point is always making sure that the rules, on which particular suggestions are based, are sound. By using this approach one will still not be able to be correct each and every time (simply because it's impossible, and that's why we have always suggested diversification of strategies - you will find more information in the Key Principles section), but it will ensure that huge profits are to be made over time.
What's important here is that the USD and general stock market appear close to providing bullish signals for the PM sector. The USD in a decline along with the general stock market on the rise would be a strong bullish factor for the PM market.
It's important to look at that way in which PMs respond to the USD and general stock market. Trending upwards with high volume is a sure sign of strength. However, if the rally is small or is accompanied by low volume, the move will not be confirmed and the rally may well be over. Should this counter-trend rally appear, it could be a good idea to exit the market.
Summing up, the indications are that the gold rally may continue on for a bit longer. The euro, USD, and general stock market are all presently approaching a change in direction and the timing and actual interrelation of these markets will directly impact where gold goes and when this takes place. We are cautiously at this time in view of the many positive signs for gold seen today in these other markets worldwide.
"The trend is your friend" and "the price is going to move in a given direction, until it is invalidated" are both noteworthy and wise in our view, and based on our experience it is profitable to follow them. So far we didn't see invalidation of the bullish patterns present on the gold market.
Silver
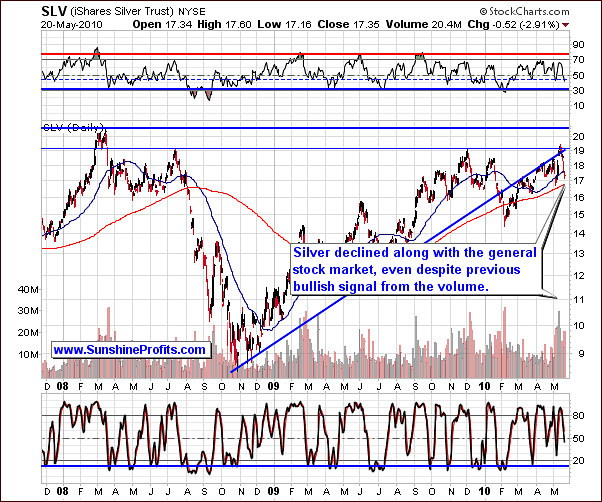
Moving on to silver, the long term chart for the white metal, we have seen a sharp decline this week, as silver was adversely affected by the decline in the general stock market. This was in spite of all the recent bullish signals, which we have seen for some time - for instance silver had moved above strong resistance levels on high volume. Still, the severe decline in the general stock market has had a huge impact on silver and PM stocks.
The question now is "Where do we go from here"? Has silver confirmed the fact that we are repeating late October 2009 or are we at the beginning of a severe decline? This is a tough call, as - like mentioned many times in the past - signals coming from the silver market might be sometimes misleading, as this market is much smaller relative to gold, and thus more vulnerable to short-term price manipulation.
On a positive side, last October the decline was not as big as it was recently, but the influence of the general stock market at that time was not as severe, which means that the two declines are somewhat comparable. Moreover, silver has declined to the 50-day moving average level, actually slightly below it - that was the case in October 2009, and it is the case today. Additionally, the RSI has fallen below 50. These are all similarities between October '09 and today.
We question whether history is to repeat itself here or are we to see a new, uncharted trend. More information is needed before we make this call. Generally a pattern is in place until it is invalidated. At this point we have not seen this invalidation.
When the general stock market moves higher, which is likely, this short term correction will have an impact on silver. Whether or not silver will respond the same as gold is a tough call.
Are we at the end of silver's current rally? Some signals point to this. Silver's price is decisively lower. This may just be a correction, albeit a sharp one within a bigger rally. The behavior of silver in relation to the main stock indices will tell us about the new future for silver. A slight rally or one with low volume will indicate a probable end to this rally whereas a strong rally with high volume will support a temporary bottom to be followed by a continuation of the rally.
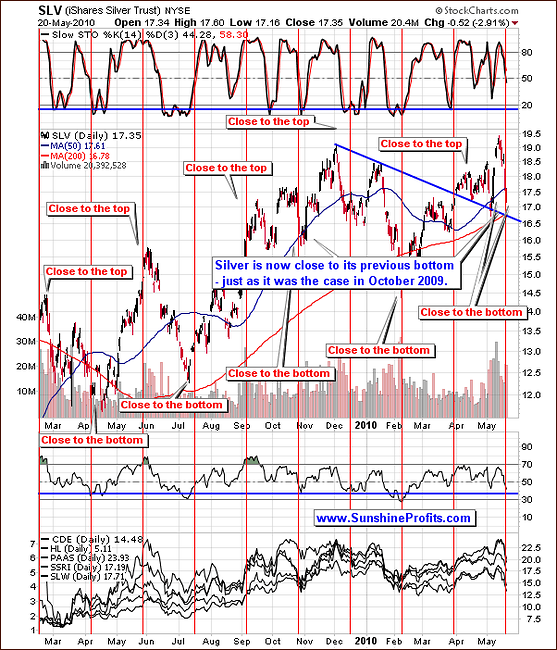
The short-term chart for silver this week confirms points made earlier. Right now, silver is very close to the red vertical line, which marks points where we are likely to see local/tops or bottoms. Based on the analysis of the previous local extremes, we are in the "close to bottom" territory, perhaps having just seen it.
Please note that these cyclical tendencies perfectly confirm the similarity theory, as the October 2009 slide also materialized exactly at the red vertical line. The price stopped close to its previous (September 2009) low, and this is also what we've seen today.
On the negative side, daily seasonal tendencies, which we featured last week, suggest that silver is likely to decline severely at the beginning of June. This regularly happens in early June, which does not leave much time for a rally. The market may wait, but the tendency for silver to go much lower in June is quite strong. If no rally is seen soon, this is a non-confirmation and the odds for a rally will decrease.
Summing up, the situation on the silver market appears to confirm the presence of the self-similarity pattern that we've mentioned in the section dedicated to gold, but the white metal also suggests caution, because of the strong seasonal tendency to decline at the beginning of June. So, once again, the next several days are likely to provide us with higher prices of precious metals because of the positive influence from the USD and the general stock market and the way PMs and PM stocks respond to this influence is going to provide us with the critical information regarding the next major move in this sector.
Precious Metals Stocks
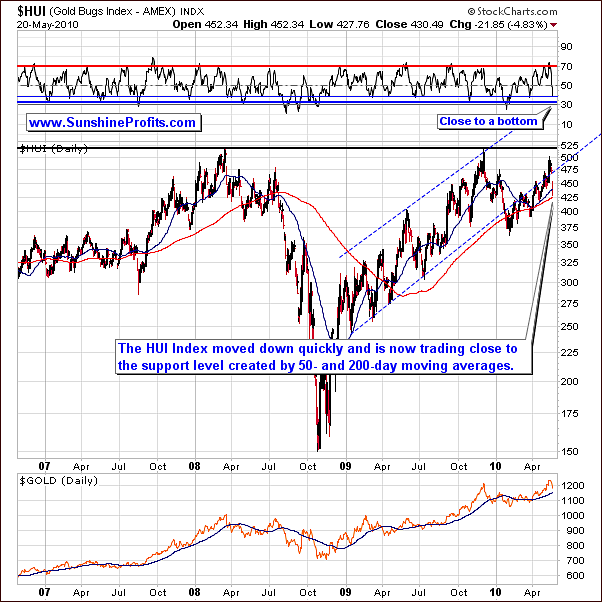
With respect to the precious metal sector, our May 12th Market Alert suggested limiting exposure to the PM sector as far as the speculative capital was concerned. The risk-reward ratio was deemed to be unfavorable at this time. In hindsight, this turned out to be a good idea. The significant decline in PM stocks this week was much greater than the decline in gold itself. On the HUI chart above, there is a visible sharp decline, which has been stopped by the 50-day and 200-day moving averages. This, and the RSI close to the 30 level suggests that PMs are not likely to fall any further.
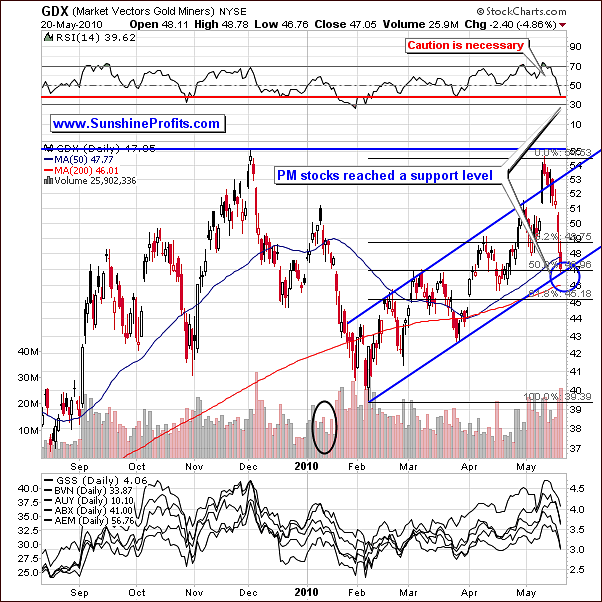
The short-term chart confirms this. Here, we see additional two support levels. The lower border of the rising trend channel and the 50% retracement level of the February-May upswing provide this additional support. The RSI also indicates a possible buy signal.
Earlier in this update, we stated that the current situation (GDX declined about 12% based on closing prices) was quite possibly analogous to October '09 (GDX declined about 14% based on closing prices) behavior of PM stocks. Note that the PMs at that time declined severely and several days later moved upward with vengeance. The rally was confirmed by strong volume, so - once again - this is something that we are looking for as a bullish confirmation in the following days.
Summing up, the situation in the mining stocks confirms points made earlier. Whether or not we will see much higher prices in the following weeks will depend on the PM sector's performance relative to the way they are influenced by other markets. Early in 2010, during the final part of a rally, actually a correction within a bigger decline, we saw low volume during up-trends and rising volume during downtrends - as marked with a black ellipse on the above chart. This was in fact, confirmation of a fake rally and the future move was likely to be lower. Should we see a similarity to this pattern develop, we will suggest exiting the market. As of now, we have yet to see evidence that the trend has broken. Although things look very bad today, this was also the case in October '09, which was followed by a big rally. So far there is no evidence suggesting that this pattern has been invalidated.
Additional Opportunity
The final thought for today is a suggestion to embrace the opportunity that the market provides us at this point. This time, we're not referring to buying PMs, but to making sure that your portfolio is structured correctly. The huge volatility that we've seen recently - especially in silver - provides us with an opportunity to examine if the amount of capital that is being used for trading is not too big (or if the position is over-leveraged).
Our Portfolio Structure page suggests 20% - 40% of capital dedicated to speculation (which includes cash reserve, which means that the amount that is to be used per trade should be much lower), but there is also additional rule that we outline one the page dedicated to diversification and that is not to use more capital for speculation than you can afford to lose. In other words, if you get overly emotional about a position, it means that it is most likely too big, and in the end this is likely to turn against you (for instance by selling right before the bottom.)
While having a winning big speculative position is great, the cost of losing your un-emotionality about the market, when something goes wrong (and it has to go wrong from sometimes, there are no perfect tools for estimating the market) is simply too big, as it could lead to much bigger losses than the abovementioned gains. As we've explained (and proved) in the Universal Investor essay, if you're using too much of your capital for each trade, you can be losing your money on average even if you enter favorable trades.
So, if the current move lower (barely visible from the 10-year perspective) made you consider selling everything related to gold or silver in any way and running for the hills, it might be a good idea to move some of your "speculative" holdings to the "investment" category.
Summary
The recent move lower has been rapid, but there is no evidence that this is anything more than just a correction. Particularly, there is no evidence that this is a beginning of a bigger decline in the precious metals. Previous bullish patterns have not been invalidated (trend continues until invalidated) even with the recent dramatic declines and there are many signs pointing to higher values of the precious metals, but we must remain cautious also for other signals.
We are very likely to see at least a small upswing in the precious metals and PM stocks, and the way this sector moves up will let tell us if this is an opportunity to exit the market, or to prepare for strong follow-up to the upside. For now, the latter appears more probable. We will monitor the situation and report to you if we get confirmation of any of the above outcomes.
If we get a confirmation that a move lower is in the cards, it would be a huge development, as it would mean limiting also one's long-term investments (in all cases we don't suggest owning less than 20% of one's capital in physical gold/silver), especially the mining stocks.
If we get a confirmation that a bigger move higher is likely for gold, silver and PM stocks, it would mean that the biggest gains are to be made from the USD perspective. In this case, if one is using options, it might be a good idea to use gold instead of silver or mining stocks because of the recent volatility in the white metal and in the PM stocks that caused options' premium to rise substantially. From the non-USD perspective (for instance if you're trading gold for euro or sterling), it doesn't seem that there is much upside for the metals market in the near future.
This completes this week's Premium Update.
Thank you for using the Premium Service. Have a great weekend and profitable week!
Sincerely,
Przemyslaw Radomski

