People put too much store in central bankers and hang on their every word as if they are prophets with a direct line to the divine. It seems that no one does this more than gold investors. In the past gold has shown itself to be super sensitive to monetary policy announcements and investors hope that any indication of further easing would give gold a joy ride.
We have had enough evidence that central bankers are no super heroes able to leap tall buildings at a single bound and save the economy. There are plenty who contend that if the Fed had not stimulated the economy with zero percent interest rates, two rounds of quantitative easing and the so called “operation twist”, the economic fiasco would have been much worse and the recession much deeper, perhaps even a depression. They go even further and say that the Fed has not done enough, and if only it had printed more money, we would be out of the woods by now.
The Austrian economists, on the other hand, counter that there is no free lunch and the tab will be paid later. The short-term pain of a deep recession would have been more salutary to the economy and would have eventually built a more robust sustainable recovery, they say. They argue that the Fed's actions simply delay, or numb the pain. So far, even with all the quantitative easing, we have not seen much of a recovery as the employment report released on Friday confirms. In the best case scenario the U.S. economy is stagnant. At the worst case scenario it is going down the hill. That the economy is a mess is the one thing that Barack Obama and his Republican challenger, Mitt Romney, agree on.
We believe that interest rates cannot stay low forever. The Fed's interest rate was bought down from 5.25% in August 2007 to 0.25% in December 2008. When interest rates finally rise, the prophets of doom and gloom will have plenty to rant about.
Just what did QE do for gold? One could argue—plenty. On November 24th, 2008, which is the day that QE1 was announced, the price of gold was $819.50. It rose to $1,113.30 by March 31st 2010, which is when QE1 ended. This was a hefty increase of $293.80. The price of gold rose from $1,337.60 on November 3rd 2010, the day QE2 was announced, to $1,502.50 on June 30th 2011, which is when QE2 ended. This was a sizeable increase of $164.90, but smaller than in the first round. Does the smaller increase in the second round suggest that investors are becoming less sensitive to such measures by the Fed? Has gold lost its “safe haven” status and become a “risk on” asset?
Many metaphors have been used for gold but never to our knowledge has the price of gold been compared to the non-barking dog. (This refers to the Sherlock Holmes story, Silver Blaze and the "curious incident of the dog in the night-time." Holmes infers that the dog made no noise because the villain was someone the dog knew very well.)
In a Financial Times piece this week the writer, Peter Tasker, said that “Just like the non-barking dog in the Sherlock Holmes story, the gold price has become strangely insensitive to the usual stimuli.”
In other words, the Eurozone, the slowdown in the U.S. and China and bank scandals coming to light weekly no longer cause the dog (gold) to bark (go up.)
“Unsurprisingly, investors are running scared. The global flight to safety has seen capital flood into "core" sovereign bond markets, driving yields down almost to vanishing point. Yet, despite this perfect storm of financial instability, the gold price remains becalmed. In fact, over the past year gold bullion has behaved like a "risk on" asset, rising and falling in sync with stock markets.”
Tasker says that although for most of human history gold has played the role of a "store of value," now those days are long gone. “Gold has become just another financial asset, as vulnerable to the shifts of investor sentiment as an emerging market.”
He asks “why has the golden dog suddenly gone silent?” and answers that “One likely reason is that the price has simply become too rich.”
He cites the website pricedingold.com, according to which gold is at a 120-year high relative to US house prices. “Likewise, it is at a 74-year high relative to US wages, at multi-generation highs relative to wheat, coffee and cocoa and at the same price relative to the cost of a Yale education as in the first decade of the 20th century.”
Tasker suggests that “for those who are nervous of financial markets, there exists an obvious alternative. On the pricedingold.com numbers, you should cash out of gold, buy a nice house, hire some workers, send your kids to college and eat big breakfasts.”
We agree with the big breakfast part as we enjoy such ourselves, but we don't agree with putting all of the cash out of gold part, at least not yet (we do believe, however, that being partly out, or – better – hedging part of one's gold holdings is a good idea). The gold bull market still has a long way to go.
Looking forward, the Fed may provide yet another round of quantitative easing which would most likely have a short-term negative impact on the U.S. dollar and a positive impact on the price of gold. Just how much is difficult to predict. In any case, we believe that investors need to hold some gold in their portfolio both for diversification as well as protection against more turbulent times and as a store of value. Ahead we still face the threats of a euro break-up, a slowdown in China and the “fiscal cliff” at the end of the year, a frightful combination of tax increases and spending cuts unless Congress acts to stop them.
If nothing else, gold has proven itself for maintaining its purchasing power relative to prices in general over time, which is the point that Tasker misses when he suggests that you cash completely out. That is more important than the ultimate price of gold itself. Even he makes the point in that gold is at a high relative to U.S. housing, commodity prices and has maintained its value vis a vis a Yale University education for the past 100 years. Keep the gold in your portfolio and it may help send your great-grandchildren to Yale.
However, we would like to stress that on a medium-term basis, all the above-mentioned relative valuations do indeed paint a bearish picture. If the medium-term decline comes, we will view it as a great opportunity to re-enter the market at lower prices, not as an end of the whole bull market in the precious metals.
Gold has been much in the news this past week, but mostly in the Olympic Games taking place in London. To see if we can put on our Sherlock Holmes cap and look for clues on how gold and other precious metals will do next week we will now turn to the technical portion with the analysis of the Euro Index. We will start with the long-term chart (charts courtesy by http://stockcharts.com.)
Euro and USD Indices
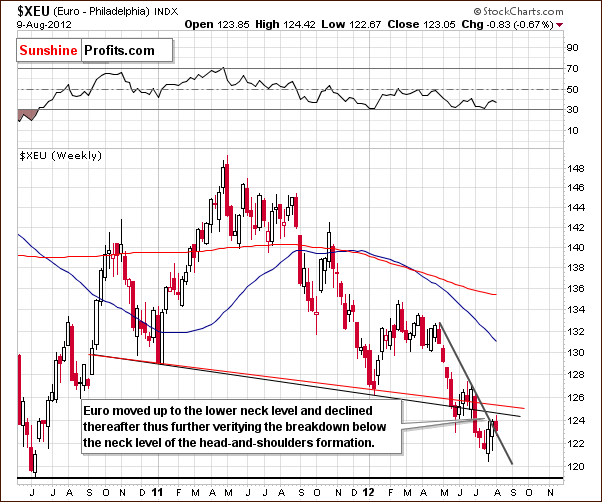
We begin this week with a look at the long-term Euro Index chart. A verification of the breakdown below the lower neck level of the head-and-shoulders formation is visible this week. After touching this resistance line, the index reversed and declined once again. This is viewed as a form of breakdown verification since the resistance line was tested and proved valid.
The picture here is bearish once again as the index is right at the declining short-term support line. If no move is seen to the upside on Friday, and it closes the week here, there will be no breakout from a weekly closing price perspective. The short-term trend will therefore clearly remain down as well. All-in-all, the outlook remains bearish here for the medium term.
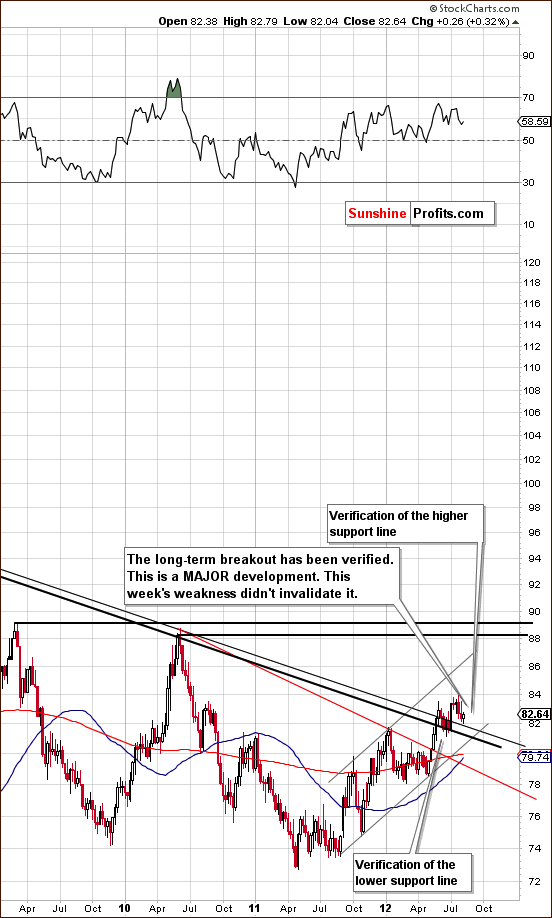
In the long-term USD Index chart (please click the above chart to enlarge), we see a situation which is quite the opposite of what was just described for the Euro Index. Here, the upper support line, based on the major tops of 2010 and 2002 has recently been reached and surpassed. This breakout has now been verified with the higher support line being tested this week. Previously, the lower resistance-support line held when prices declined to it in late June. Based on these two proven support lines and the lack of any imminent resistance levels, a period of rally is very likely to begin once again and it could very well turn out to be significant.
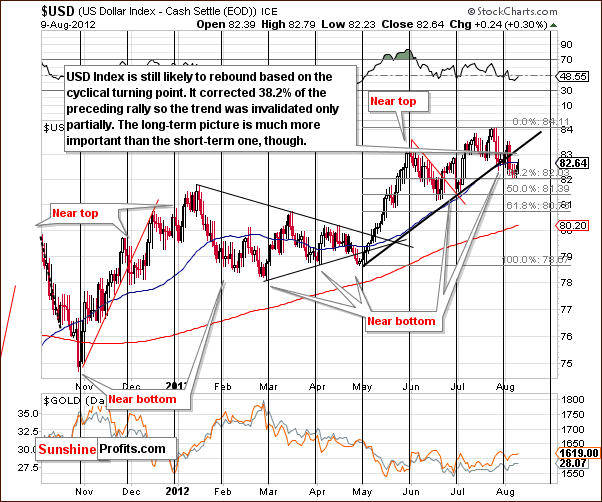
In the short-term USD Index chart this week, we see some bearish implications as a breakdown below the rising support line based on the early May and July lows has been seen. Prices did not move below the first, 38.2% Fibonacci retracement level however. The trend was only partially invalidated, so it seems to remain up here. Also, it must be remembered that the long-term picture is generally more important than what we see in the short term, so the recent breakdown is not really that important.
Summing up, the medium-term picture remains bullish for the USD Index and bearish for the euro. Additional rally, perhaps significant, is likely in the USD Index based on the recently broken resistance lines having held as support. Also, with the recent cyclical turning point having been reached following a period of price declines, price action similar to what was seen in May, 2012 or November, 2011 could be ahead. In each of these months, significant moves to the upside were seen a couple of weeks after the cyclical turning points following periods of declining prices were reached.
General Stock Market
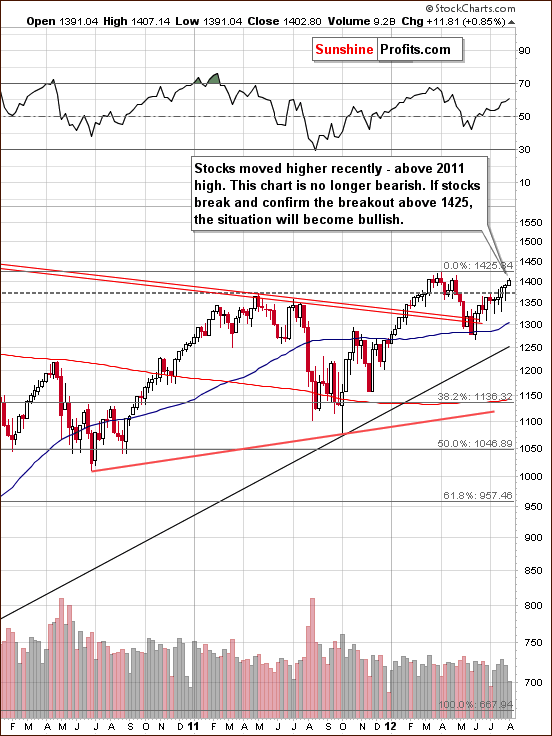
In the long-term S&P 500 Index chart (please click the above chart to enlarge), we see that stocks have rallied recently and approached but not yet moved above the level of the previous 2012 high. It seems that once the S&P moves above the $1,425 level and verifies this move, the picture will be bullish here once again. For now, we continue to view the outlook as mixed with a resistance line around 1.5% above Thursday's closing price level and RSI levels neither overbought nor oversold at this time.
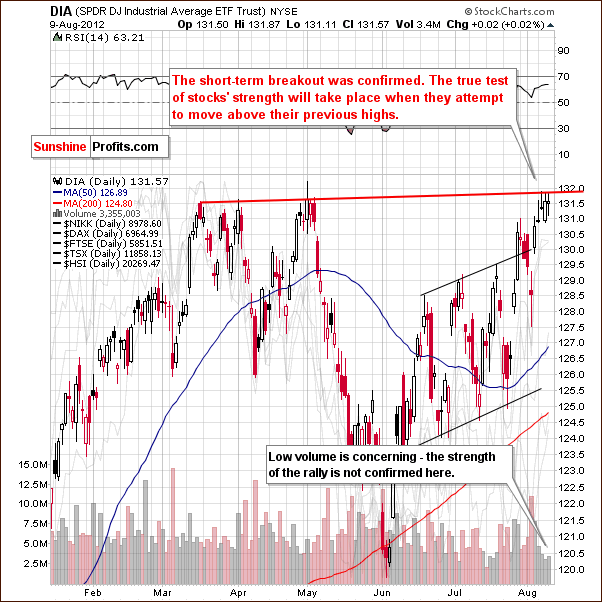
In the short-term DIA (a proxy for the Dow Jones Industrial Average), we see a mixed picture as well. Stocks have shown some strength here but the rally has been accompanied by low volume levels for the last five trading days. In mid-July, a three-day rally with similar volume levels was followed by three days of declining prices and higher trading volume. The net result was a 1-2% decline for the six-day period even though prices had risen nearly 2% in the first three days (on low volume!). Finally, another resistance line has been reached so all-in-all the situation remains mixed here.
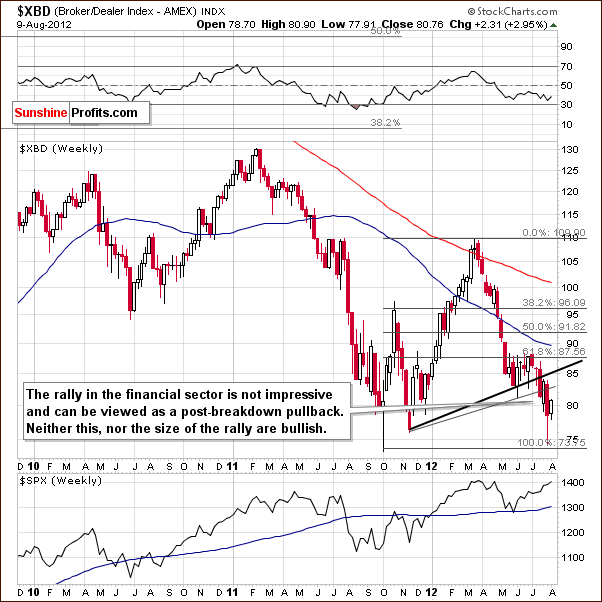
In the Broker Dealer Index chart (a proxy for the financial sector), we see a bit of a rally for the financials this week, but their underperformance over the past five months remains clearly evident. The small rally seen this week does little to atone for the declines seen in two-thirds of the weeks since the mid to late-March high. In short, there is really no good signal for the stock indices in general here.
Summing up, the overall picture for stocks is best described as mixed or unclear at this time. A short-term rally has been seen recently but an important resistance line is in place and the strength of the rally will be determined when this previous 2012 high price level is tested. It simply seems best to wait and see before commenting further here.
Crude Oil
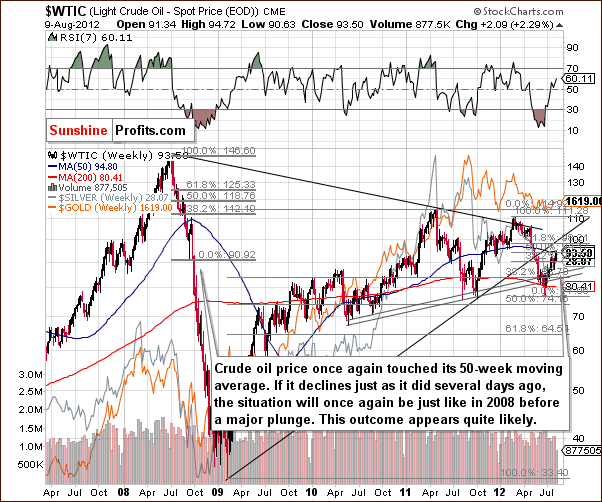
Turning to the crude oil price chart, this week's price action is quite similar to what was seen two weeks ago. Prices are at the 50-week moving average, and the situation is still very similar to 2008. If prices move a bit lower from here, things will be very much in tune with the period seen in 2008 just before the major plunge. In any case, the consequences are likely to be bearish.
Conversely, a move above $104 (two resistance lines would have to be crossed) would change the outlook here to bullish although immediate, sharp rises in price were not seen in either of the last two moves above this resistance line (September-October, 2010 and October, 2011). With respect to the precious metals sector, the implications from crude oil prices are not bullish yet.
Correlation Matrix
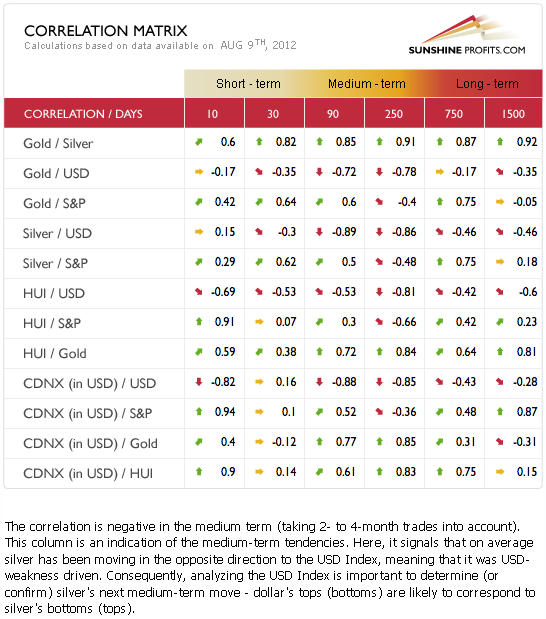
The Correlation Matrix is a tool which we have developed to analyze the impact of the currency markets and the general stock market upon the precious metals sector. We see weaker short-term coefficients this week but the medium-term relationships of the past few weeks remain in place.
The currency markets are strongly and negatively correlated with precious metals at this time. If the medium-term rally in the USD Index continues, the downward pressure on precious metals prices will remain in place as well. Note that the metals' reaction may be delayed by a day or a few of them in response to strong moves in the USD Index, because the nature of the relationship is medium-term, not a short-term one.
Gold
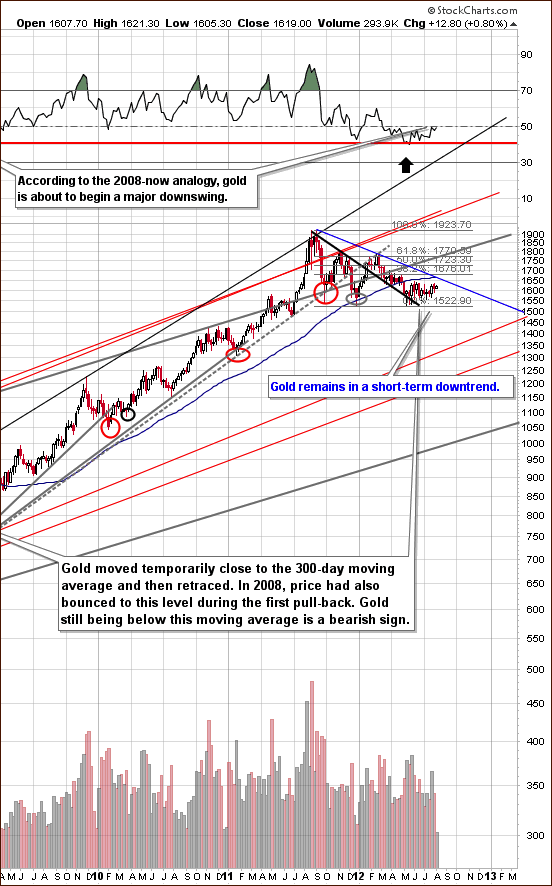
In the very long-term gold chart (please click the above chart to enlarge), no real change was seen this week. The RSI still resembles the patterns seen in 2008 just before a period of continuing prices declines in gold. The declining resistance line based on previous highs of August-September, 2011 and February-March, 2012 is only about 2% above Thursday's closing price. The closest support line, however, is a full 6% below the current price level, so a significant move to the downside appears much more likely than one to the north.
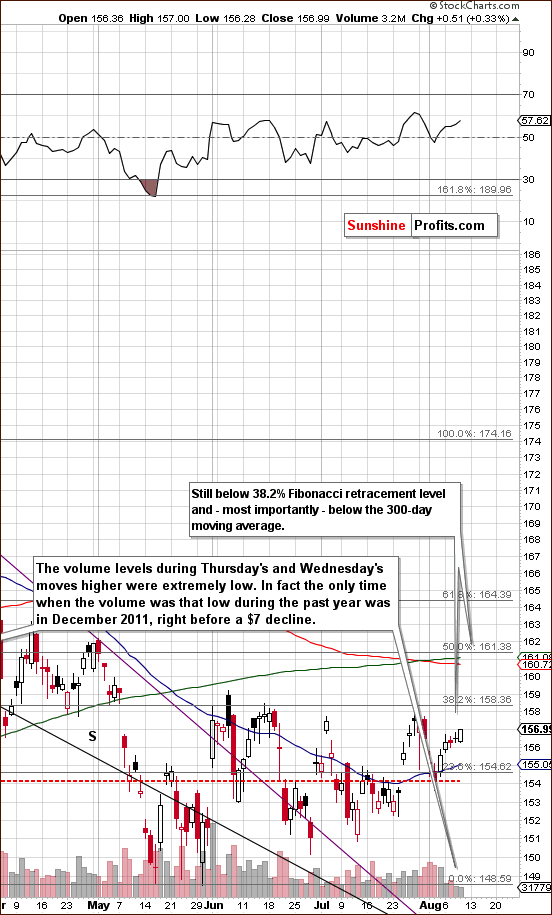
In the short-term GLD ETF chart (please click the above chart to enlarge), we have a very interesting situation this week. This is not because of the price move above the 1st Fibonacci retracement level of the previous decline (because gold is still below this level), but rather because the rally seen on Wednesday and Thursday was accompanied by extremely low volume levels. Similar trading volumes were last seen in December 2011, when the GLD ETF made its final top before plunging $7. This would relate to about a $70 decline in gold prices. The indications from this chart are clearly bearish.
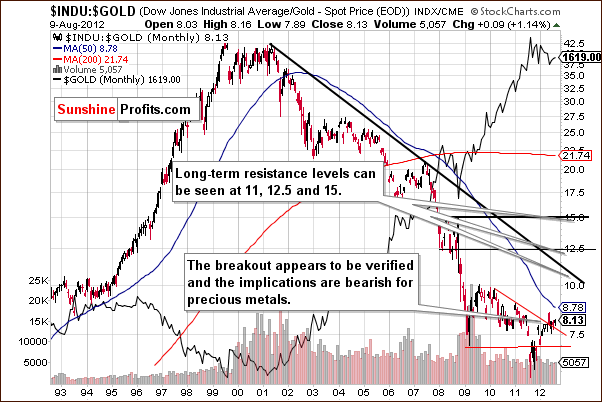
In the Dow to gold ratio chart, the recent breakout is more clearly visible this week. The situation here is even more bearish for precious metals in the medium term than it was weeks ago. At that time, in our July 27th Premium Update, we stated that “the bullish outlook here spells bearish news for gold. This ratio rises only when stocks outperform gold. In this case it seems that the rally would be caused by gold's decline, not by stocks' superb performance.” With stocks rallying recently and gold prices changing very little, the ratio has risen only slightly, going from 7.99 to 8.13 in the past two weeks.
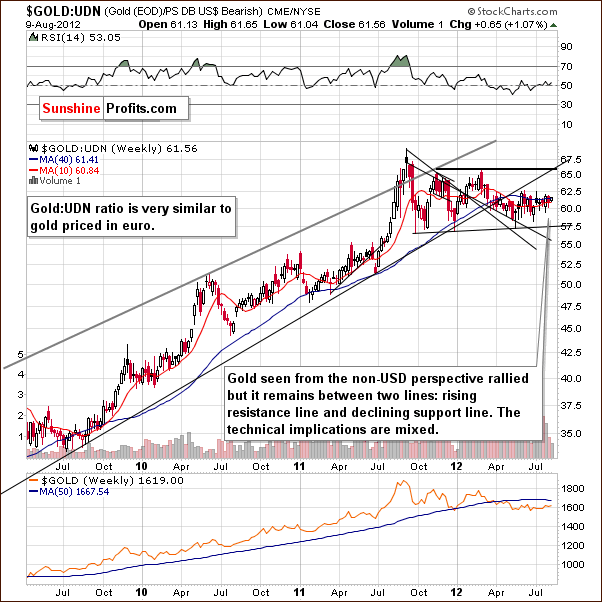
In this week's chart of gold from a non-USD perspective, we will simply repeat what we stated in last week's Premium Update:
In this week's chart of gold from a non-USD perspective, the situation appears to be pretty much mixed. Little has changed recently as the index level has pretty much moved sideways within a narrow price range for the past several months.
These comments are still accurate and up-to-date.
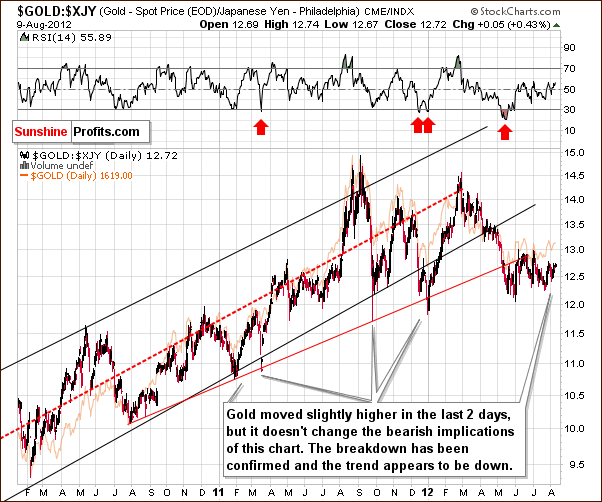
In this week's chart of gold from the Japanese yen perspective, there is nothing new to report this week. Quoting from last week's Premium Update one more time:
In this week's chart of gold from the Japanese yen perspective, we see that [two weeks back] rally appears undoubtedly to be a part of the post breakdown consolidation and does not imply any real bullish move whatsoever. The bearish implications remain in place here.
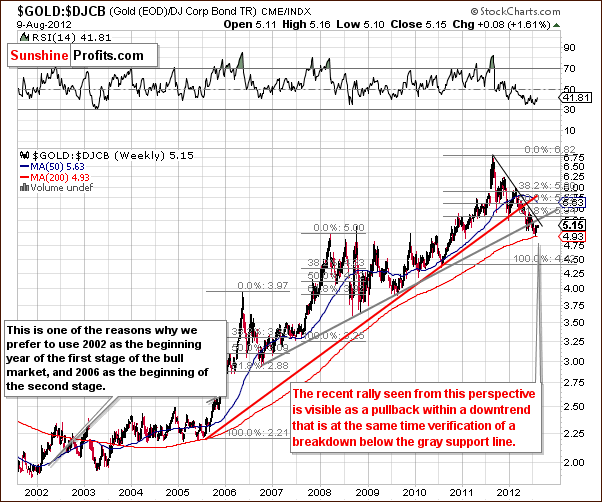
In the gold to bonds ratio chart, the recent strength that gold has shown is almost invisible here. The downtrend seen over the past weeks remains very much in place. The bearish picture clearly prevails.
Summing up, the situation for gold did not really improve from a medium-term perspective. The major factor here is the USD Index, which still has a profound effect on the medium-term outlook for gold. No breakout has been seen and the medium-term breakdown pattern continues. The analysis of volume provides us with short-term bearish picture.
Silver
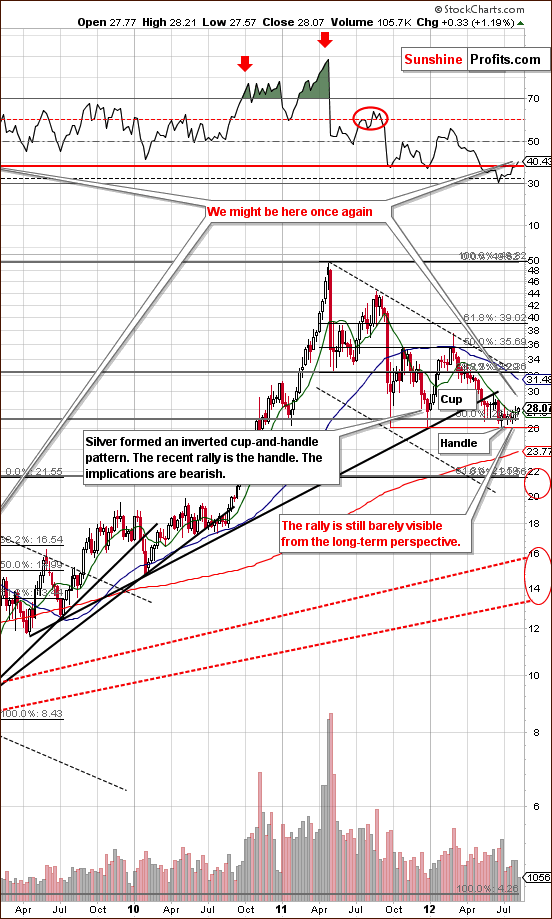
In the very long-term chart for silver (please click the above chart to enlarge), the RSI moves (in the upper part of the chart) to the upside this week very much resemble the price action seen in 2008.
So this might just be where we are right now. Silver's price moved above the 10-week or 50-day moving average but this does not invalidate the inverted cup and handle pattern. By itself, such a move does not change the overall picture for the precious metals sector since there is no accompanying confirmation by a medium-term breakout in gold nor mining stocks.
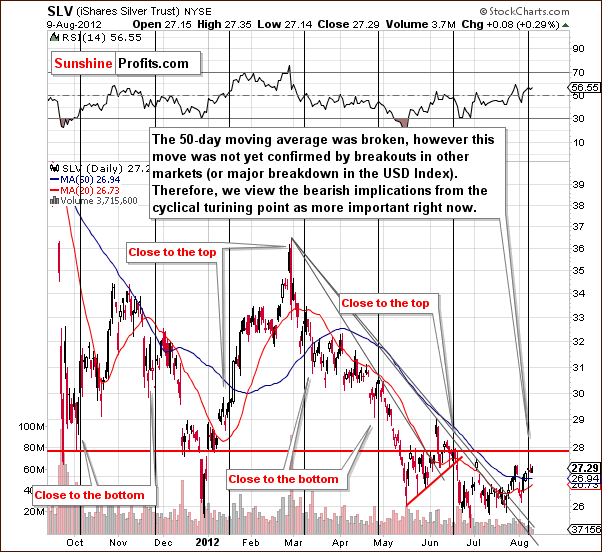
In the short-term SLV ETF chart, we see silver's price is right at a cyclical turning point. With the most recent price moves to the upside, the implications here are bearish, as a reversal in the price trend would lead silver prices lower.
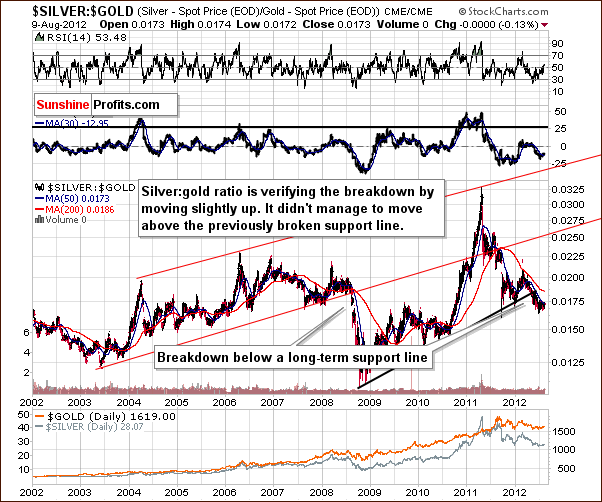
In the silver to gold ratio chart, there is no improvement at all this week. The trend remains down in this chart, meaning that silver appears likely to underperform gold in the weeks ahead. A breakdown has been seen and further weakness appears likely from here.
Summing up, there are virtually no positive signs for the white metal in this week's chart except for the move above the 50-day moving average. This move was not accompanied by analogous breakouts in gold nor mining stocks, so we don't view it as overly important. The weakness and bearish outlook is further confirmed by the silver-to-gold ratio.
Gold Mining Stocks
Note: We decided to omit the HUI Index chart this week as it failed to provide any new and useful information.
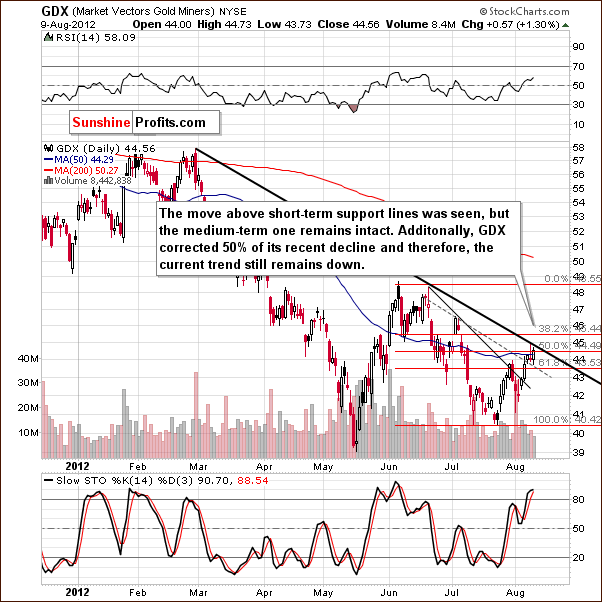
In the GDX ETF short-term chart, we zoom out for a bigger picture which seems to be more important at this time. Thursday's volume level was quite low and this is a bearish short-term factor. In addition, the medium-term resistance line was touched but not breached. This line is more important than the short-term one, as the declines that we expect to see are of medium-term nature. Lastly, the miners have not moved above the 50% retracement level. All-in-all, the outlook remains bearish here.
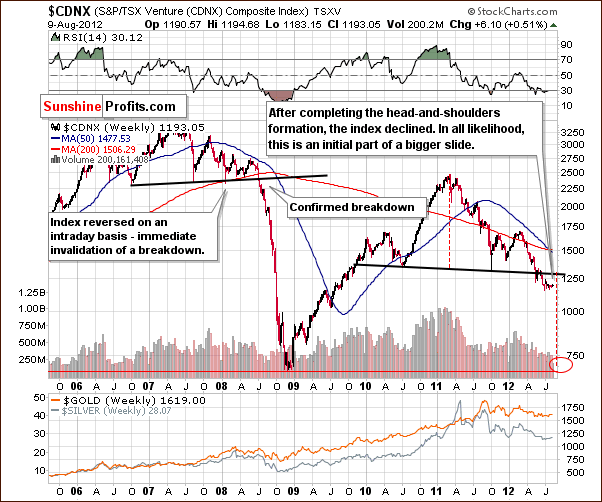
In the Toronto Stock Exchange Venture Index (which is a proxy for the junior miners as so many of them are included in it), the long-term picture remains very bearish. Indications here are that the juniors are likely to move much lower along with the other mining stocks and the rest of the precious metals sector. These declines have not yet materialized, quite probably, because of the recent correction seen in the USD Index.
Summing up, With the USD Index still above a critical support level and boasting a bullish outlook, the bearish picture remains very much in place for the mining stocks.
Letters from Subscribers
Q: If you would not currently advise shorting gold, and you believe that gold could move up very fast at some point, is there not a risk that one would enter late and miss a first big jump? Wouldn't it then be better to stay fully invested with one's long term capital and just ride the possible downside (which seems limited anyway since you do not recommend shorting gold)?
When that moment of reversal comes, by how much could one suddenly see gold initially rise in say, 24 hours? I ask this just to better evaluate the net risk exposure between a drop from here and the amount of any sudden 24 hour increase that one may not catch. If on a best efforts basis we calculate this net risk at 15% then I would stay invested and ride it out as the probability is for an increase all the way to USD 5,000.
A: Let's be specific. Shorting gold is ok in our view if it is just a hedge of a physical, long-term position. We believe that betting on the medium-term (or short-term depending on one's approach to investing) declines is much better in case of miners than in case of gold, because there are more bearish factors present in case of the former.
If gold moves higher there is a risk that one may enter late and miss a first big jump.
At the same time, if gold moves lower there is a risk that one sells too late (or at the bottom because they will panic) and misses the benefit of being out during the decline. Please note that a 50% correction would take a 100% rally to break even.
It would not be better to stay fully invested with one's long-term capital and just ride the possible downside because this decline is the most probable outcome in our view. If gold goes to $1,300 and you buy back at that point you will gain even more than if gold rallied $300 now and you were invested. However, this approach is appropriate for most investors but not all. If you can imagine yourself being happy with the decision not to sell right now with gold at $1,300 (or $1,100), then you might as well remain invested. You don't have to get out of the market. We simply believe it's something that will be profitable, but there is no obligation for anyone to take advantage of all moves. For instance, we don't trade daily moves. Some investors might not even want to trade moves that last several months.
We don't think that gold would shoot up at the beginning of the rally, but rather at the end, like in a parabola. We might see a sudden financial system breakdown, but the probability of that happening in the next few months is very low (maybe a few percent). If that happens, we still have some gold that would save our portfolio.
We estimate (just a guesstimate, no calculations to back this up) the probability of a sudden move up in the price of gold to $5,000 or higher during the next 6 months at 0.5% (half a percent) at most.
Q: Given today's volume in GDX, it looks like at least another short term rally is coming [Editor: we received this message after a day when volume was relatively significant]. No QE III and not only does gold not go down, it goes up. One of these times it's going to keep on going up. If we get yet another close below support in the dollar tomorrow, we'll be seeing 1640 next. I don't mind sitting tight, but your advice to short still puzzles me.
I asked you two weeks ago to make a case for the dollar rising; so far all I really see is 'cyclical'. So I can ascertain your confidence level: what percentage ofyourassets areyou shorting miners with?
A: We received your question about the US dollar (thank you) and 2 weeks ago we commented on the USD Index more thoroughly than in several previous updates.
Our short position is currently about 5% of the total portfolio. However, our portfolio constraints are quite specific - our liquidity requirement is high because of the possibility that the development of our new website will be more cash-intensive than originally planned.
Q: Can you please comment on this.
“A few recent research reports also suggest that the yellow metal is not dead yet, and that conditions are still ripe for higher prices for gold. Bullion Vault recently pointed out the fact that in the last ten years, every time the gold price has sat around doing nothing for about a year, it has subsequently gained on average 33% the following year.”
(Source: http://seekingalpha.com/article/790221-gold-outlook-still-bullish-and-ri...)
A: We see this observation as interesting, but not really meaningful right now. Generally, prices used to correct only temporarily and the main support lines held during the whole 2000 (or 2002) - 2011 uptrend. If the trend continues then the observation has bullish impact on the metals market. However, there are several very important points that suggest the situation is not like during past corrections in the past decade.
2011 was the year when gold topped and USD bottomed. Gold didn't decline when USD simply stopped declining but when it started rallying. Is there a good reason to believe that the USD Index will now rally? Yes - a confirmed breakout above the long-term resistance line. This is a major bullish event.
Are there any other clues? There are: the gold:bonds ratio has already broken below key support levels and the opposite can be said about the dow:gold ratio. Both are important, long-term bearish factors. Silver:gold ratio - breakdown; juniors (TSX Venture index) - breakdown.
These are all bearish factors that were not really present all together previously (since 2000). Therefore, we are skeptical about applying the above observation to the current state of the market. The current situation is not really analogous to previous ones, so comparing them might not be appropriate.
And no, we are not saying the classic "this time it's different". The previous gold bull market had a major correction ('74 - '76) during which the price of gold was almost cut in half. A significant decline here would be in tune with what was seen in the past, not "something different".
Q: Assuming you are right, ultimately, again the issue is one of timing. Now I see the focus has shifted to “medium term”. There is a major difference between shorting short term and shorting medium term. The latter by definition involves a larger number of moves over a longer timeframe.
You are assuming, again, that because a short position is entered when GDX is at 47, that position is automatically profitable at any point in the future that GDX may be 44.
Have you at all considered that some of us may choose to short via leveraged ETFs like DUST? On June 15, GDX was at 46.92, DUST was 41.87. Today GDX is at 44.55, DUST 44.89. But let's suppose you are wrong and GDX continues up, back to, say, 46.92. The current implied price of DUST would be around 38, a substantial loss.
Yes, these ETFs are not intended to be held over time, which is why it is frustrating when you say “next week” and that turns into two or three months.
So, do you not recommend leveraged ETFs? What ETFs do you recommend for shorting (or going long) given the nature of your analyses?
A: Yes, the focus shifted from short term to medium term, when we wrote to hold on to the short position despite our target being reached ($42).
Not all positions will be profitable when the current price is lower than when we entered the short trade. For instance very short-term options might have already expired (depending on what one considers short-term). However, it is not possible to track each investment/trading vehicle and its versions (different option parameters), so we do what can be done - let you know about targets, tendencies and we provide probabilities for a given move/target. Those who decided to buy short-term options probably sold at a profit when we wrote that we now believe the move will be a much bigger one (assuming that short-term options are being bought by advanced traders), and medium-term options (or other vehicles) were purchased.
So, while we realize that our subscribers may use all kinds of vehicles to trade or invest in gold, that doesn't mean that we will be able to make specific suggestions for each of them. We can tell you what we specifically think about the market, though.
We understand that this can be frustrating - we didn't think that the recent rally in miners would be as big as it turned out to be. If we did, we would have suggested taking profits off the table 2 weeks ago and we would suggest getting back on the short side now. It turned out that the decision to ignore the buy signal from our SP Gold Stock Extreme Indicator was simply a bad one. We should have put more weight into this important tool and we apologize that we didn't. Naturally, our position remained short as well. Nonetheless, the price of the GDX ETF is currently a few dollars lower than when we suggested shorting it.
Please note that at this time it still seems that betting on lower values of miners is a good idea. Not because we previously said so and we are getting married to this thought, but because the situation in the markets hasn't really improved. The major factors that we mentioned when discussing the "33% rally after a yearly consolidation" question remain in place. In particular, the rally in the USD Index is likely to continue. Even if it doesn't have an immediate effect on the mining stocks, it will likely be the case in the coming days as the dollar continues to rally.
Q: I am a new subscriber and new trader. Can you suggest a book for learning how to read charts such as the ones presented on the site? Thank you.
A: You might try "Technical Analysis and Stock Market Profits" by R.W. Schabacker. It was first published about 80 years ago, but it's still relevant today as investors' psychology doesn't really change over time. And the same can be said for price patterns, which reflect that psychology.
While it's not really about recognizing chart patterns, we suggest that you read Jack Schwager's "Market Wizards". It features many different strategies - unique, yet all successful and quite inspiring. Actually, it was this book that inspired us to write one of the essays that we posted on the website, The Universal Investor.
Q: Would you please comment on the following article proclaiming a bottom in gold? His technical analysis conflicts with yours.
http://seekingalpha.com/article/786831-the-bottom-is-in-for-gold?source=...
A: In short, we respectfully disagree with the outcome of the analysis (except for the opinion that the fundamental case for gold is bullish) and with the way the technical tools were applied (our subjective opinion that we will explain below).
There are 3 technical points that are being made in the essay:
1. There was a double bottom below $150 in GLD
Our view is that it might be a double bottom or a consolidation after a breakdown below the long-term uptrend that can be seen on the third chart in the essay if support is drawn through bottoms. Such a breakdown is a bearish factor.
2. The second chart doesn't provide us with resistance lines drawn based on highs. Even though the resistance line is not drawn based on tops, GLD is still visibly in a short-term downtrend - there was no breakout. Therefore the picture is bearish, not bullish.
3. After a spike high there is a consolidation and a continuation of the trend.
This doesn't have to be the case at all times. In fact, like in the '70s, we might expect that one of the spike highs will be followed by a big plunge. This could very well be the case right now, particularly given the situation in the USD Index.
We also disagree with taking 2005 as a starting point to the long-term analysis.
Summary
This week's moves in the precious metals markets have not improved the medium- or short-term indications. It seems likely that most of this week's commentary is a result of the correction seen in the USD Index. Now this correction appears to be over, however, and important support lines are in place. The USD Index appears very likely to rally once again.
It's unclear at this time where the general stock market is headed. The recent rally has brought stocks close to the 2012 highs, but this level still has not been reached and could slow or stop the rally seen in recent days.
The gold, silver and mining stocks continue to have bearish outlooks. Short-term signals are bearish as well here, as evidenced by the recent rally seen on low volume levels in the mining stocks, gold, and the GLD ETF. The breakout in silver above its 50-day moving average doesn't change the picture here as it is not confirmed by other signals.
Target levels and probabilities remain unchanged from two weeks ago: $1,350 and $1,200 for gold, $21 and $15 for silver, and 300 and 160 for the HUI Index. The latter corresponds approximately to $31 and $17 for the GDX ETF. We continue to view the probability for a move in gold below $1,500 (that would correspond to major declines in silver and miners) at 75%.
In closing, we are pleased to announce that your Editor has recently passed the Level 3 Chartered Financial Analyst exam. Since this is the final level (there were 3 exams – one per year), he is now waiting for final processing of his application. Once (or, to be precise - “if”) the process is completed, PR will be awarded his prestigious CFA Charter. You can read more about the CFA designation on the CFA Institute website.
I (PR) wish to thank all on the SP Team who wished me luck and kept their fingers crossed. In another part of my life, I just received the Open Water Diver certificate. Other SP Team Members are saying that I'm diving just to make another point about diversification – not only between gold and silver or investment and trading but also between land and sea… And, well, they may have a point – please keep the diversification principle in mind.
Thank you for using the Premium Service. Have a profitable week and a great weekend!
This completes this week’s Premium Update. Our next Premium Update is scheduled for Friday, August 17, 2012.
Przemyslaw Radomski


