
It seems that every season we hear a new catch phrase, be it “subprime,” or “quantitative easing”, or “risk on, risk off” or “the new normal.” The latest bon mot if you haven't already come across it, is “fiscal cliff” with the attendant worry that the U.S. is about to fall off a precipitous edge.
U.S. economists who have been worried this past year about the troubles on the other side of the pond, have now turned their attention back to the U.S.
So what is this “fiscal cliff” that is giving everyone such vertigo?
It is the confluence of several tax-cut measures, including the Bush tax cuts that are set to automatically expire in combination with automatic spending cuts that were set in motion to force lawmakers to do something about the deficit. The day of reckoning for all of them is January 1, 2013.
Sometimes phrases seem to appear out of nowhere but in this case we know the origin. Federal Reserve Chairman Ben Bernanke first used the term in February to warn Congress that the economy could go into decline if lawmakers allow major tax cuts to expire and $1.2 trillion in spending cuts to go into effect all at the same time.
Economists warn that the one-two punch of an increase in payroll taxes and in income tax rates, as well as large cuts in domestic and defense spending could hurl the country back into recession.
Congress could prevent that outcome, but Democrats want to see tax hike for the rich and Republicans want to include the affluent in a renewal of the Bush-era tax cuts. Think of the Democrats and the Republicans as Thelma and Louis. If you recall, Democrats and Republicans took this fight to the precipice the last time the Bush tax cuts were set to expire, in December of 2010.
On Tuesday, Bernanke, who disappointed gold investors by not mentioning quantitative easing, sounded his warning again.
"I don't have a specific recommendation, other than to think not just about the individual policies, but of the collective impact," Bernanke said. "Congress is in charge here, not the Federal Reserve."
Meanwhile, the prospect of a government-induced recession is already taking a toll on the economy.
A New York Times article said that business executives and policy makers are increasingly concerned that companies have already begun to rein in hiring and investments.
Morgan Stanley echoed the sentiment and said this week that fiscal cliff worries are reaching new heights across a wide range of industries and already there are reductions in business orders and hiring.
Anew report commissioned by the aerospace industry says federal budget cuts could cost the country's economy more than 2 million jobs and raise the national unemployment rate by 1.5 percentage points over the next year.
Calling this a major “macroeconomic event”, IMF chief economist Oliver Blanchard, said it would cause a recession and probably kill growth in the U.S. next year and probably kill growth in advanced economies.
Analysts seem to agree that the effect on the economy could be dramatic. On the one hand higher taxes combined with spending cuts would reduce the deficit by an estimated $560 billion. But on the other hand, the policies would cut gross domestic product (GDP) by four percentage points in 2013, sending the economy into a recession, according to Congressional Budget Office.
If Congress shows signs of dawdling and playing chicken, as it did with the debt ceiling crisis, for example, that in itself is likely to have an effect on the economy even before 2013 as households and business hunker down into defense mode. It is possible that this will all be put off until after the November elections.
Paul Krugman, a Nobel Prize winning economist of the Keynesian school, has a simple message for U.S. policymakers: Forget about the country's huge budget deficit and focus instead on the much more immediate problem of mass unemployment.
"It's not true we're going over a cliff on fiscal problems," the Nobel Prize-winning economist said in an interview with Reuters TV. "We are already over a cliff on the unemployment problem, and that is the thing to worry about. Every attempt to deal with the deficit turns into an enormous battle," he said. "Meanwhile, 3.9 million Americans have been out of work for more than a year. We should be focusing on the clear and present danger."
For a completely different view we turn to Peter Schiff, CEO and chief global strategist of Euro Pacific Capital Inc., who follows the Austrian School of Economics. (For an explanation of the differences between the Keynesian and Austrian views you can turn to July 16th, 2010 Premium Update.)
He says the so called “fiscal cliff” is the least of American's problems. Schiff says that the premise that government spending generates economic growth is false and that spending cuts will promote growth, not curtail it. But, according to him, there is a much larger problem that no one is talking about.
“The debt burden that the United Stated will face when interest rates rise presents a much larger “fiscal cliff.” Unfortunately, no one is talking about that one,” writes Schiff in a letter to investors. “The current national debt is about $16 trillion (this is just the funded portion... the unfunded liabilities of the Treasury are much, much larger). The only reason the United States is able to service this staggering level of debt is that the currently low interest rate on government debt (now below 2 per cent) keeps debt service payments to a relatively manageable $300 billion per year. On the current trajectory the national debt will likely hit $20 trillion in a few years. If by that time interest rates were to return to some semblance of historic normalcy, say 5 per cent, interest payments on the debt would then run $1 trillion per year. This sum could represent almost 40 per cent of total federal revenues in 2012!”
That's what we call a Fiscal Abyss.
So there you have it, the Keynesians versus the Austrians. History will judge who is right… In any case – more money being created to “fight unemployment” or financial turmoil – precious metals should rise in the long run.
To see how the price of gold will do in the upcoming weeks let's begin this week's technical part with the analysis of the currency indices. We will start with the Euro Index chart (charts courtesy by http://stockcharts.com.)
Euro and USD Indices
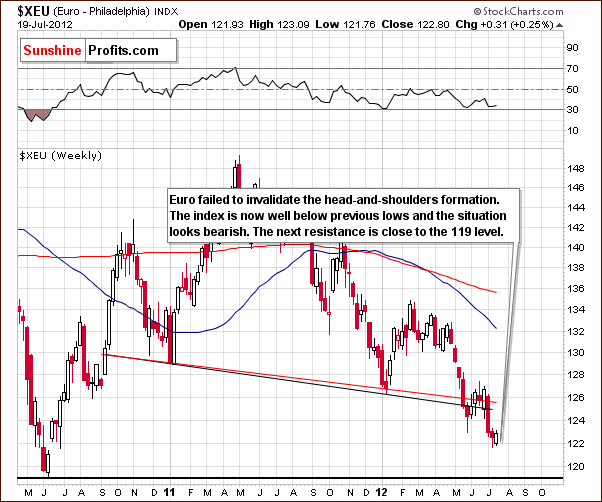
We begin this week with a look at the long-term Euro Index chart. We have seen a confirmation of a breakdown below the neck level of the head-and-shoulders pattern. This will be the third consecutive week of verifying this breakdown unless something tremendous is to happen on Friday to cause the Euro Index to soar. We consider this very unlikely and would venture to say that the breakdown is 99% verified. The implications are bearish here and, of course, bullish for the USD Index.
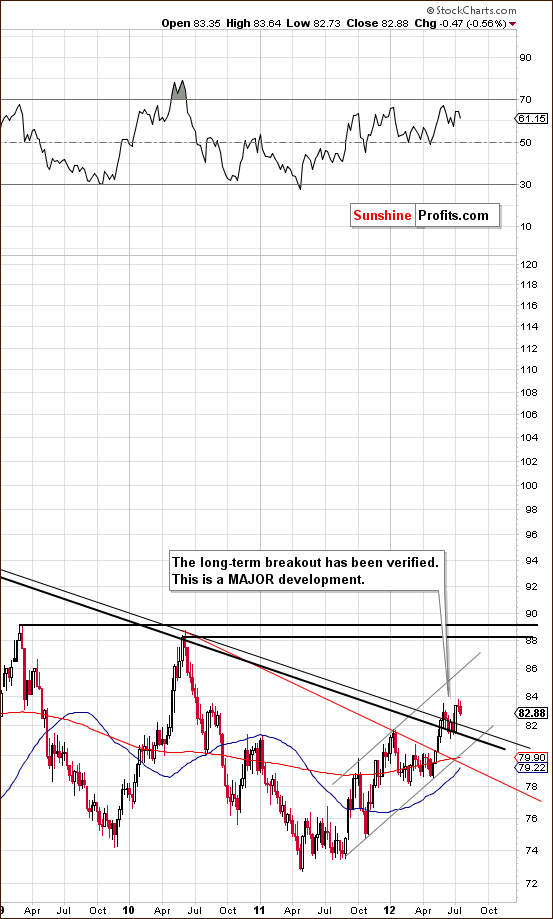
In the long-term USD Index chart (please click the above chart to enlarge), we once again see a verification of the breakout above the long-term resistance line – a major development - and prices appear ready to move higher. This seems likely based on the situation in the Euro Index and with the breakout here already having been verified. The upper border of the trading channel formed by the local highs and lows of the past twelve months (currently at 86) is the closest meaningful resistance once USD moves higher.
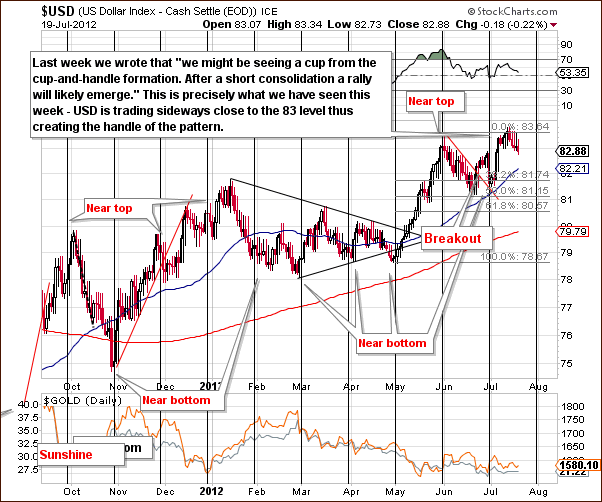
In the short-term USD Index chart, we see a cup-and-handle pattern with the cup developing over a bit more than a one-month period and the handle forming over several weeks. In last week’s Premium Update, we discussed this possibility:
The index is close to its early June highs and a bullish cup formation seems to be developing. If we see a consolidation here, it simply might create a handle of the pattern – the rally would then be very likely to continue in 1-3 weeks.
This appears to have indeed developed and is itself a bullish formation. Once the USD Index moves above its June-July highs, another powerful rally could very well emerge here. The implications are bearish for the precious metals markets.
Summing up, the outlook has changed very little within the past few weeks and continues to be bearish for the euro and bullish for the dollar. The negative influence of the currency markets upon precious metals seem likely to continue.
General Stock Market
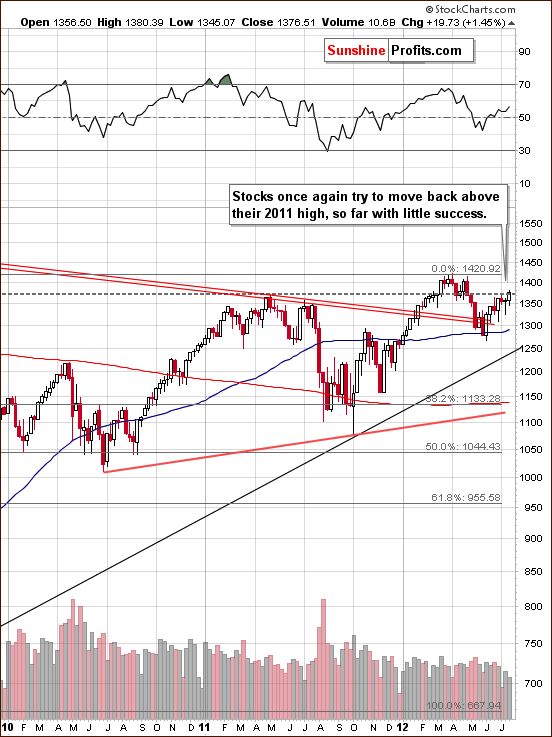
In the long-term S&P 500 Index chart (please click the above chart to enlarge), we see yet another attempt at surpassing the 2011 highs. There actually has been a recent close above this level, but it is so close to the 2011 high that we simply cannot call it a true breakout and it has not been confirmed anyway. The situation here is mixed at best.
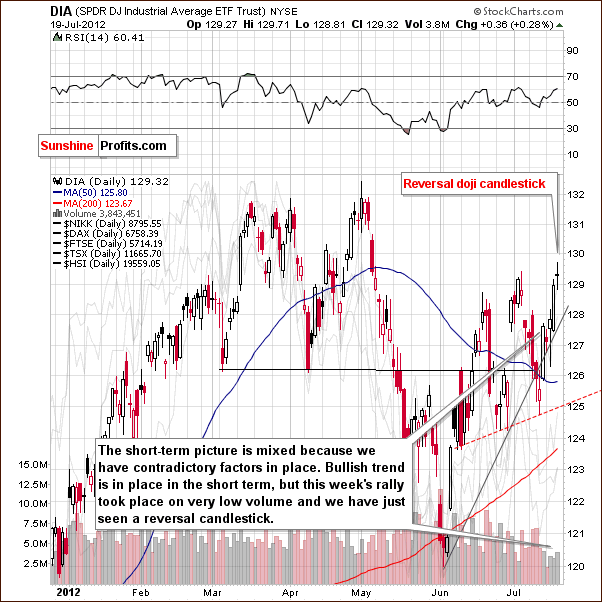
In the short-term DIA (a proxy for the Dow Jones Industrial Average) chart, we see mixed signals this week as well. A rally was seen but was accompanied by low volume levels and the reversal doji candlestick was just seen. The implications here are mixed since contradictory factors are in place.
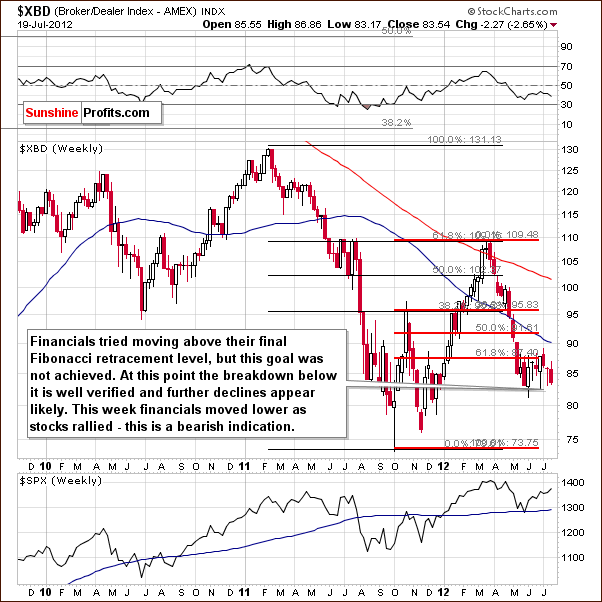
In the Broker Dealer Index chart (a proxy for the financial sector), once again we have bearish implications. The index moved lower and this week's decline was seen while stocks in general moved higher. Since the financials usually lead, that is, indicate the likely direction of the market, the signals here are bearish for stocks in general.
Summing up, the outlook for stocks is mixed for both the long and short term. The bearish indicator seen from the financial sector causes the overall situation here to be slightly more bearish than not. These same implications hold true for gold, silver, and the mining stocks as well.
Crude Oil
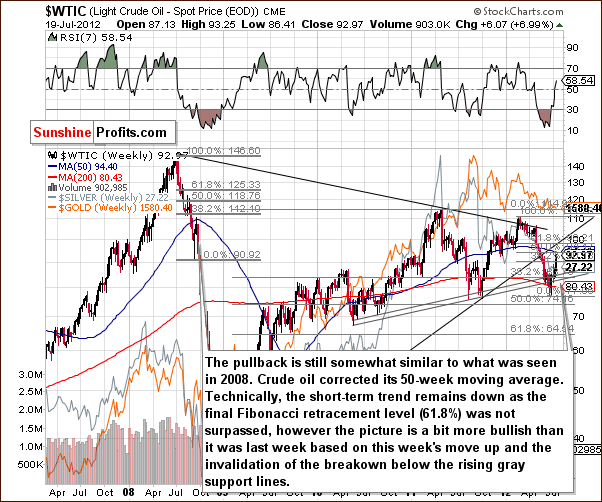
Turning to the crude oil price chart, we see a significant rally this week as nearly one-half of the preceding decline has been corrected. Prices are not above the 50-week moving average, however. This line stopped the pullback back in 2008 and another period of decline soon followed. We could see this same trading action once again.
The outlook is not bullish since the resistance line just discussed has not been broken but we no longer view the situation as very bearish. A bit more bearish than not would be a better description today based on this chart alone.
The breakdown below the rising gray support line has been invalidated. All-in-all, we have a few contradictory signals here. With the long-term support line having been broken and the 50-week moving average still in place as resistance, this chart is more bearish than not. The same holds true for the precious metals sector.
Correlation Matrix
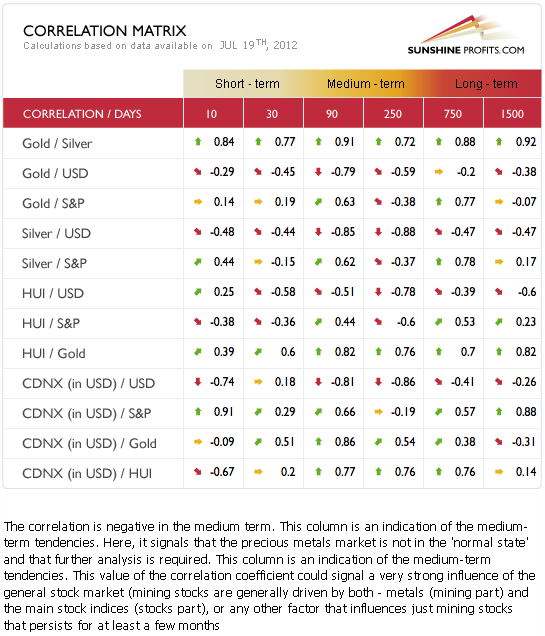
The Correlation Matrix is a tool which we have developed to analyze the impact of the currency markets and the general stock market upon the precious metals sector. The medium and short-term coefficients are the most important to watch, and analysis of the currency markets continues to appear more important than analyzing stocks. Once again the implications here are clearly bearish for gold, silver and mining stocks alike.
With the USD Index likely heading higher, the negative correlation with precious metals points to lower prices for the latter.
Gold
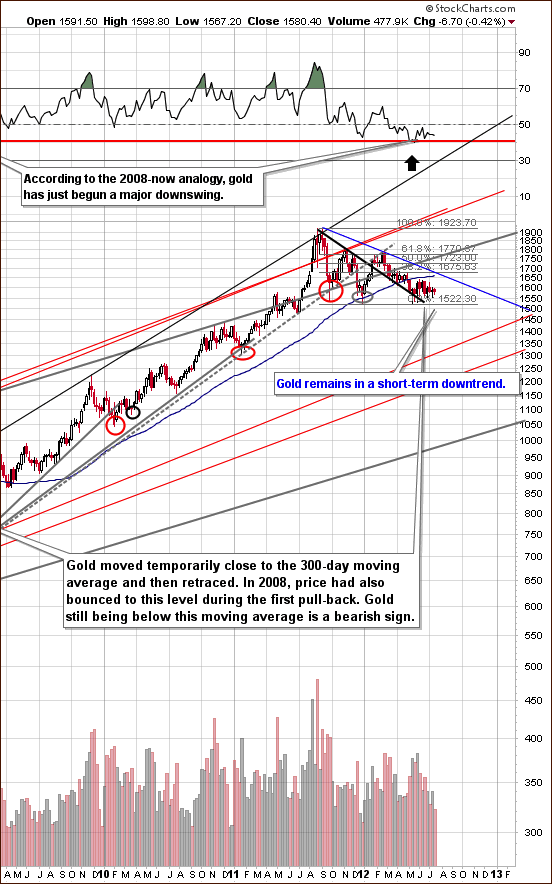
In the very long-term gold chart (please click the above chart to enlarge), the situation is pretty much unchanged since last week. The can be attributed to a small price decrease of under $7 and little more than back and forth price movements close to the $1,600 level in the prior week. The closest downside target is at $1,350.
Gold is still in a short-term downtrend. This chart continues to be more bearish than not.
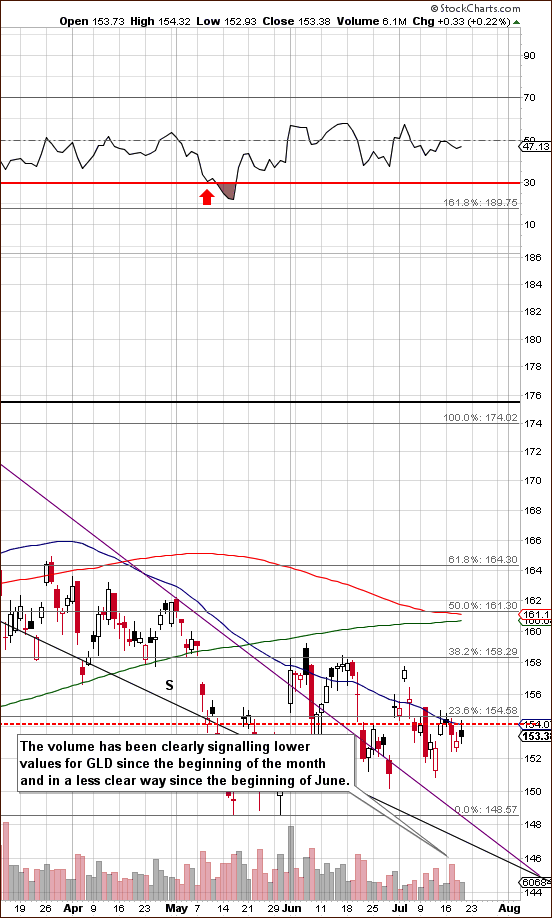
In gold's short-term chart (please click the above chart to enlarge), we have a bearish situation. The GLD ETF, which is a proxy for gold is used in order to show you what goes on in the short term with daily volume levels.
Recently, moves to the upside have been seen on low volume, whereas price declines have generally coincided with high trading volume. The situation now is best described as weak, and strong volume levels with declining prices is a sign of a true downtrend. Any rally appears to be simply a short-term contra-trend move. The medium-term trend is for lower prices here as the GLD ETF is below its 50-day moving average which has provided support many times in the past.
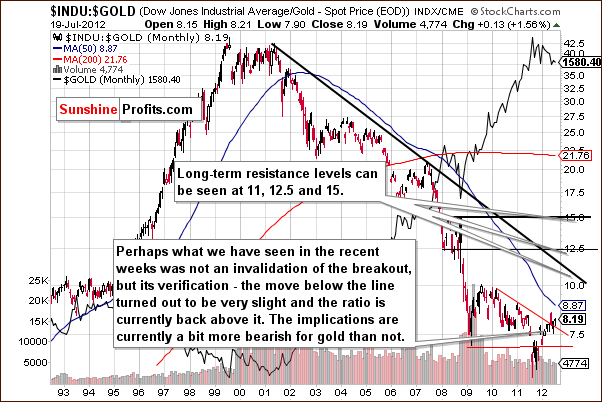
In the Dow to gold ratio chart, we have a breakout and a confirmation. The move is more and more visible, and if gold declines a bit, the breakout will be clearly confirmed. The suggestion here is that stocks are a better investment than gold from a medium-term perspective. This is not in any way encouraging stock investments but rather an issuance of caution to gold investors.
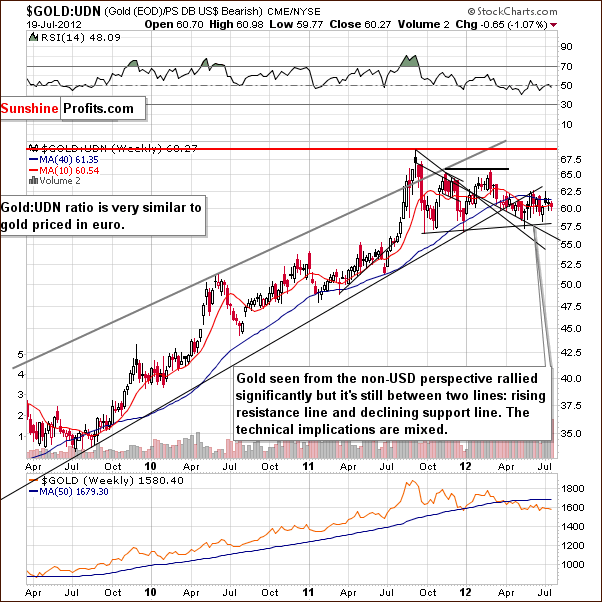
In this week’s chart of gold from a non-USD perspective, we continue to see sideways price movement as has been the case for several weeks now. The situation remains mixed here.
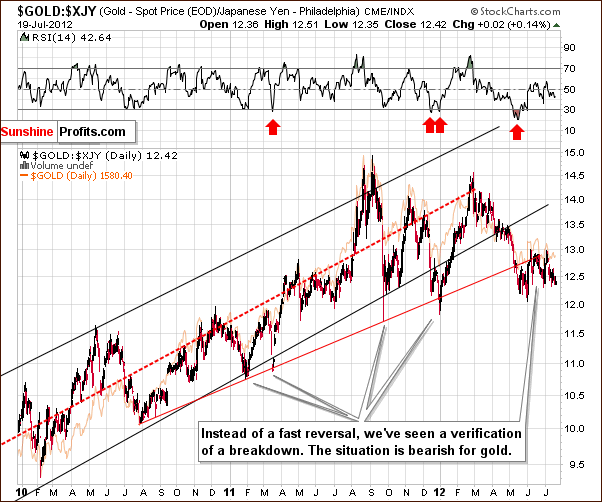
In this week's chart of gold from the Japanese yen perspective, the situation is once again bearish. The consolidation below the trading channel has continued, and it seems that gold prices are ready to move lower here.
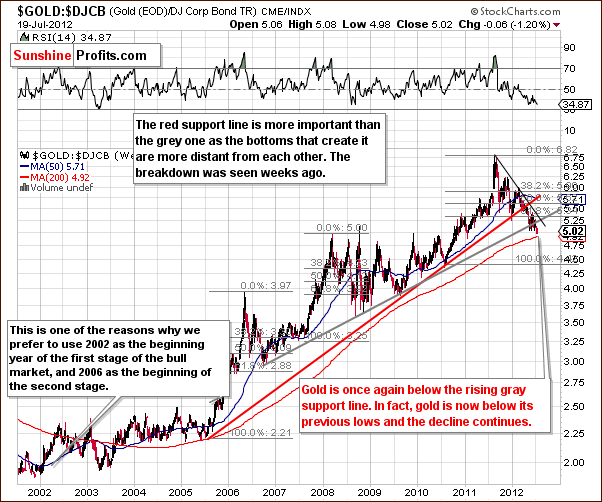
In the gold to bonds ratio chart, we see breakdowns below the rising red and rising gray support lines. This is clearly visible from a long-term perspective, and the outlook is bearish. There is little support in place other than the 200-week moving average, which has not shown much strength in the past and is not overly reliable as a support line. The breakdown below the rising support levels is a much more important development here. This is yet another chart which this week yields bearish implications for gold.
Summing up, the situation for gold itself seems mixed to bearish for the short term and also for the long term. The most important thing about the gold market this week is the current Fed approach and the situation in the USD Index.
Silver
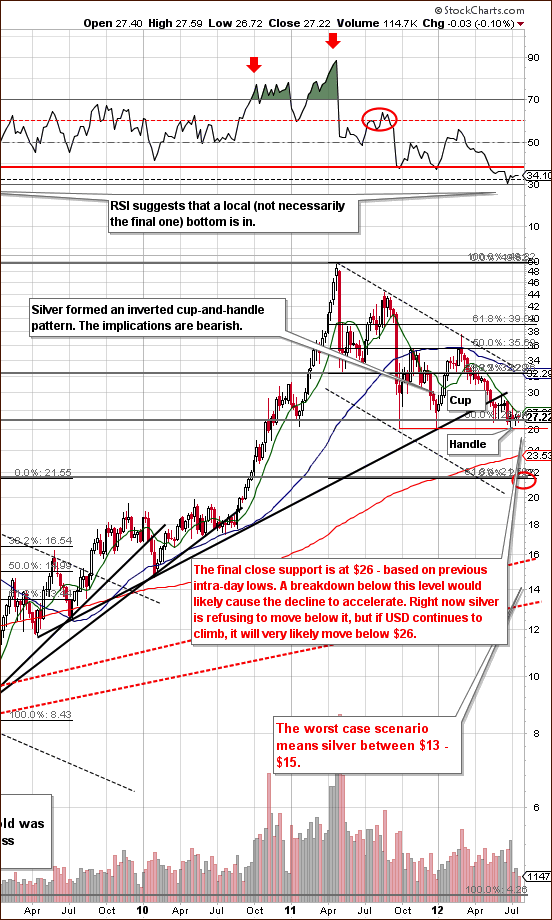
In the very long-term chart for silver (please click the above chart to enlarge), we have discovered something very interesting this week. Since the beginning of the year, a rare inverted cup-and-handle pattern has developed. This is an upside down version of the typical pattern and after some consolidation such as we've seen since mid-May, moves to the downside are likely.
Once silver's price moves below $26 and the breakdown is verified, the declines will likely accelerate. This appears likely also as a result of the reverse cup and handle price pattern seen thus far in 2012.
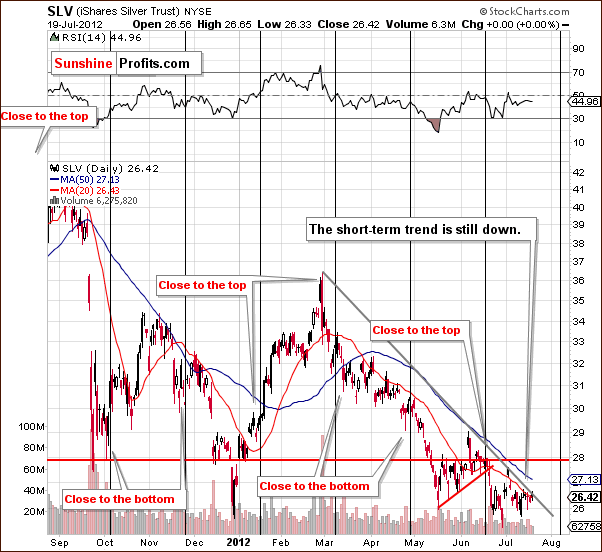
In the short-term SLV ETF chart, we see little more this week than some signs which continue to indicate that the trend remains down. Nothing else of importance can be seen from the short-term perspective this week.
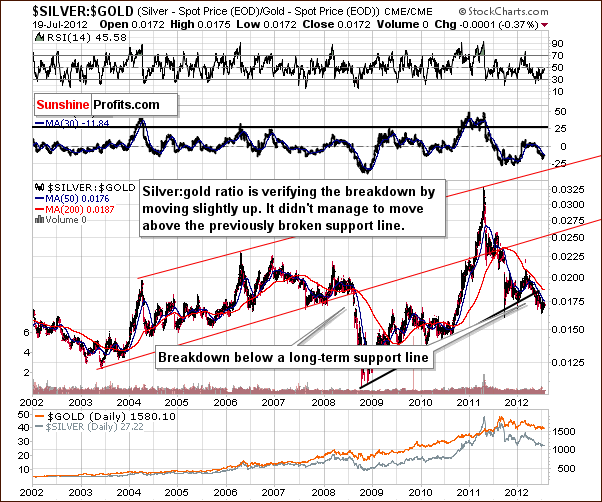
In the silver to gold ratio chart, we see the ratio pretty much unchanged this week as it declined a mere .002. This chart along with many of the varied gold charts is provided simply to have you keep your mind on the many different perspectives from which to monitor the precious metals markets and make the proper investment decisions. The implications in this ratio chart are quite bearish. The last time such a serious breakdown was seen was in 2008, when a very volatile decline in gold, silver and mining stock prices resulted.
Summing up, the situation for the white metal is bearish based on the inverted cup-and-handle pattern and the same factors which caused a bearish outlook for gold, mainly the USD Index.
Gold Mining Stocks
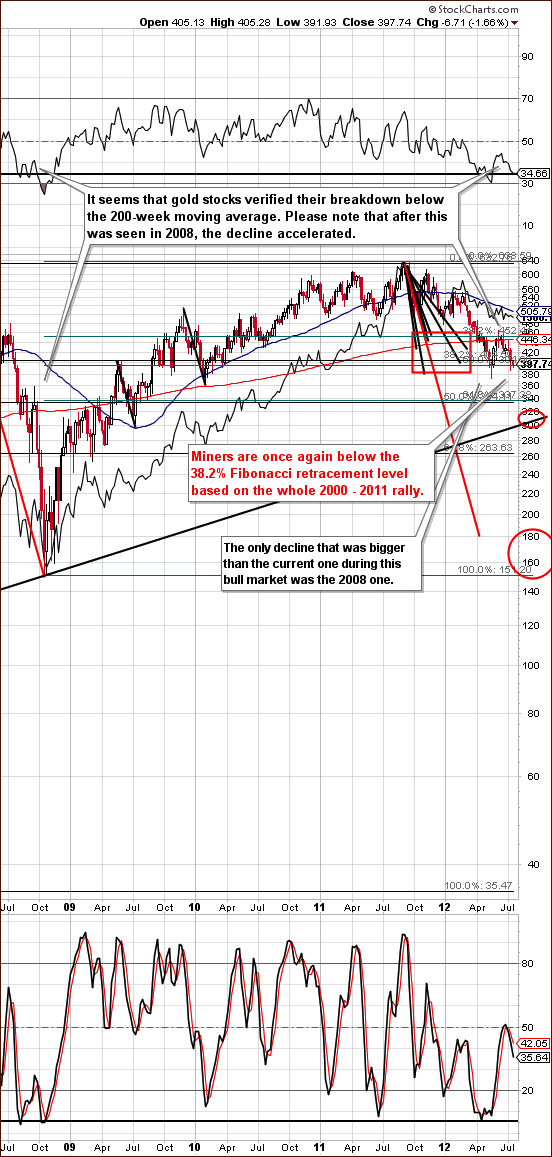
In this week's long-term HUI Index chart (please click the above chart to enlarge), it seems most interesting that the miners are close to their 2012 low while gold prices are visibly above theirs. In fact, with gold prices between their low and their June high and the gold mining stocks almost to their lows, the implications are quite bearish. Multiple times in the past, this has signaled that lower prices were ahead and such was the case earlier this year as well when the miners underperformed gold.
Two target areas have been added this week, but the “when” aspect is really not so simple to estimate. A pullback or two could very well be seen before the declines continue here. Our best bet appears to be a decline to one of the target levels within the 1-6 months, probably in 2-3 of them.
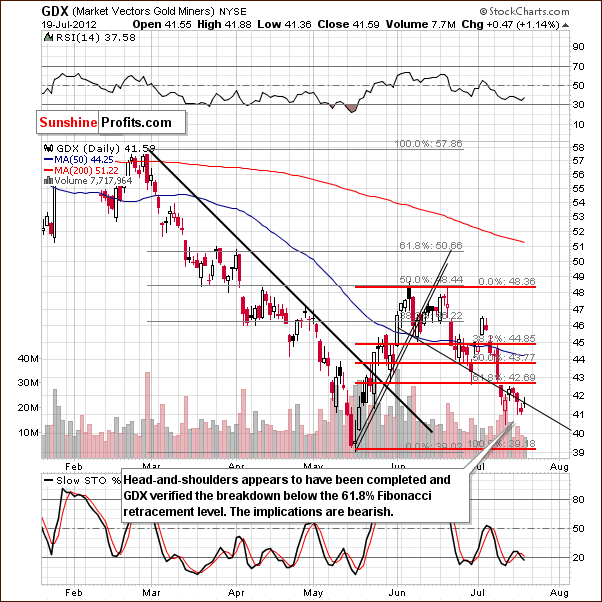
In the GDX ETF short-term chart, we have one more sign of the overall weakness prevalent in the mining stock sector and in the lack of their daily rallies. Days which have seen higher prices have also seen low volume, whereas higher volumes are seen on days when prices decline.
In last week's Premium Update, we stated that “the mining stocks moved below the lowest Fibonacci retracement level and have closed there twice. If Friday's close is below $42.69, the breakdown will be confirmed.”
The breakdown below the neck of the head-and-shoulders pattern was also not really invalidated and this is yet another bearish sign. Whereas last week we stated that we may see “at least a temporary rally in the mining stocks” based on our SP Gold Stock Extreme # 2 Indicator, but other factors did not indicate this, it turns out to be exactly what we saw last Friday and during this week.
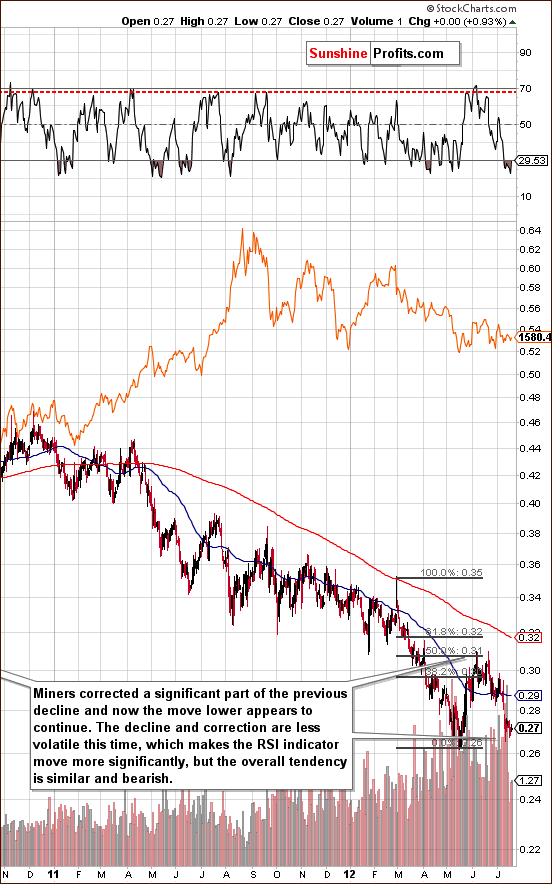
In the GDX:GLD ratio chart (please click the above chart to enlarge), we see a clear illustration of how the gold stocks have underperformed gold as the ratio has declined heavily. This is a bad sign for things to come.
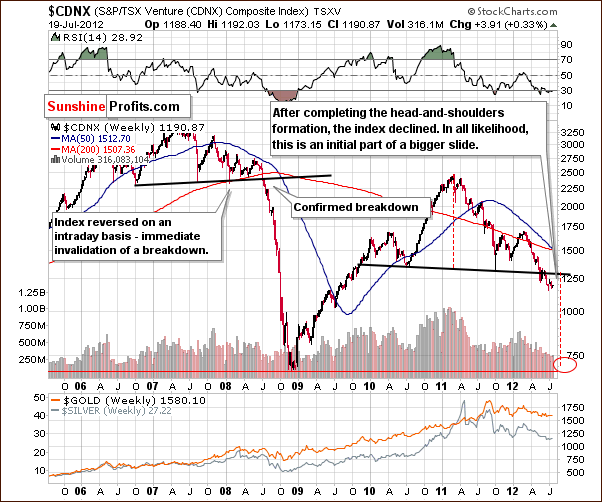
In the Toronto Stock Exchange Venture Index (which is a proxy for the junior miners as so many of them are included in it), we have further confirmation of the breakdown below the neck level of the head and shoulders pattern. This move is clearly visible, the breakdown is confirmed, and the mining stocks outlook is very bearish.
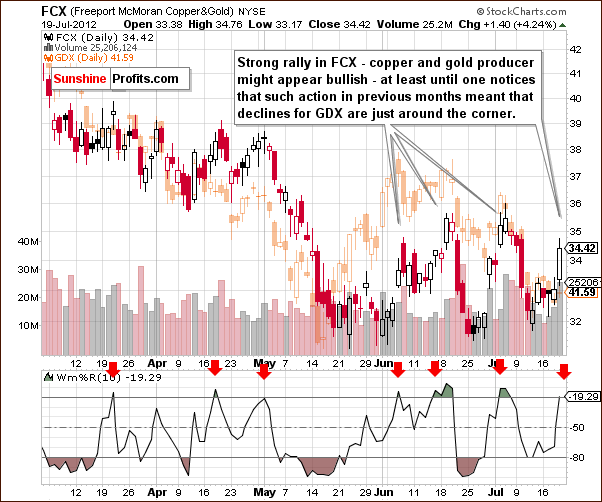
We now look at the Freeport - McMoran (FCX) Copper& Gold chart. This chart shows the FCX stock price in comparison with the GDX ETF, which is shown in orange in the background of the chart. Prices of the FCX rallied significantly on Thursday with significant volume and in all previous cases when we've seen such developments, declines in GDX ETF followed.
In the Williams %R, seen in the bottom section of our chart, when the indicator (based on FCX) moves to the upper overbought line (it actually crossed it), declines in the GDX ETF generally follow. This holds true even more so than what we stated earlier concerning the FCX. So even though the recent FCX rally looks encouraging, we view this situation as overall bearish right now.
Summing up, the outlook for mining stocks continues to be clearly bearish. The sector shows little signs of strength and its weakness is really apparent from all perspectives this week. There is really no bullish news to speak of (except the positive long-term case). It seems that betting on lower mining stocks' prices with speculative capital is a good idea right now.
Sunshine Profits Indicators
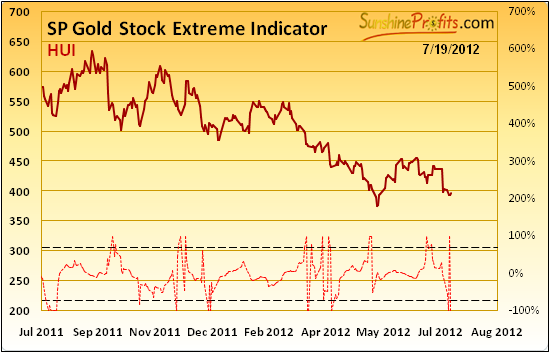
Looking at the SP Gold Stock Extreme Indicator, we once again see something, which just may appear to be bullish. We chose not to issue a market alert for reasons similar to last week's statement regarding our SP Indicator #2. This week, a tiny rally was seen on Thursday (as indicated by the above indicator), but it did not seem worth betting on. This small move was seen along with strong performance for stocks and gold, so this lack of a significant rally is actually a bearish sign for the mining stocks and precious metals.
Letters from Subscribers
The following letter touches several interesting points, so we decided to put our comments alongside it, in addition to answering the reader's final question.
---
Q: I appreciate greatly your regular analysis, but cannot help but have doubts on one aspect of your technical analysis. It is significantly influenced by the USD index movement, in which when the euro falls, the Index rises and risk assets fall off, including gold (in an environment where inflation is for tomorrow and global growth is slowing).
A: Yes, our analysis is currently heavily influenced by the movement in the USD and euro, but the key word here is "currently". There will be a time (as you write below) when gold will move higher whether the dollar moves higher or not. In fact, this has already happened before. At times we have even analyzed currencies and used tops in USD as a signal for tops in gold. Just because USD is currently the key factor for precious metals investors and traders, doesn't mean that it will remain so going forward. That's why we constantly monitor correlations between various markets and see how they change, so that we know when to pay extra attention to the currency markets and when it's only optional.
Q: But hiding behind the USD and US Treasuries as an alternative safe haven is a short term game, as real returns on 10 year treasury paper is negative, and US debt is still too high with slowing growth. At some point market players will start to diversify from concentrating so much in the USD and start to simultaneously diversify into gold because of the headwinds visible in the US economy (fiscal cliff, etc.). No market player in this environment will put too many eggs in just the USD because it is also clearly perceived as only the least dirty shirt in town. When this diversification happens, gold and the USD Index could initially both rise. And this will be the first leg of a bigger move in gold when the USD shirt looks even dirtier.
A: Agreed.
Q: Traditional technical analysis cannot tell us when this will happen in this current environment where traditional technical correlations are more susceptible to macroeconomic/political developments.
A: Agreed. Technical analysis cannot currently tell when these fundamental factors will come into play. Again, the emphasis is on "currently". We could also add "directly" to that. Technical analysis will probably tell us that in the form of a bullish formation and the overall strength in the gold market, for instance relative to underlying factors like stocks, currencies and commodities. Support lines, cycles and Fibonacci retracements don't explain why a given move is likely to be seen. They just tell you that it is the case. So you will never know if a given formation is the result of one fundamental factor or another one.
The most important comment that we would like to make here is that it is not the point of using technical analysis to detect the timing of the market's recognition of certain factors months ahead. When you buy a sports car you don't complain about it not being a good vehicle for a transportation company - you enjoy the ride. Technical analysis is just one of the tools at our disposal. We put great emphasis on it in our weekly analysis because this is where the biggest changes can be observed. The fundamental picture is bullish for precious metals. And even though we discuss the latest news, our long-term views on gold and silver really don't change (we will make relevant comments on medium-term moves, though). So, we use the technical analysis to predict what can be predicted and we use fundamental analysis (including macroeconomic and political developments) to establish the main trend and position ourselves accordingly. Additionally, we hold some in physical form as insurance against serious financial turmoil. This way, the fact that not everything can be predicted using technical analysis becomes less important. Also, without it, one's forecasting abilities would be much more limited.
Q: What most are saying is that to stop the US shirt from getting dirtier, the Fed will intervene again with QE3 and so push the USD Index down and gold/risk assets up. However we all know that this debt problem is structural and requires fiscal reform. More and more monetary easing will push the problem further back, make it worse, and in the meantime incorrectly convey the view that past correlations still hold as in better times.
A: If the correlation numbers are significant then the correlation will be in place and analyzing one market will help to analyze another. When the abovementioned factors kick in, the correlation numbers will start to reflect that and we will know not to pay attention to these other markets anymore.
Q: With (a) more QE by the Fed, the USD Index goes down and gold instantly up because of the USD/gold correlation.
A: Probably yes.
and with (b) no QE the USD Index stays strong for the foreseeable future as concern increases about the US economy and traders/investors simultaneously hedge their USD exposures with more gold.
A: The USD may not stay so strong for the foreseeable future. It could move higher and then decline again or move sideways. It would depend on what happens with other currencies. After all, currency exchange rates are just comparisons of speeds at which each currency sinks. If other currencies improve somewhat, it could be seen as weakness in the dollar. Also, traders and investors don't have to automatically hedge their USD exposures with more gold. This is likely to be seen at some point in the future, but we can't tell how soon.
Q: For me these macro considerations, (a) and (b), will drive the gold wheel going forward more than technical analysis.
A: Technical analysis is not the main factor behind the precious metals secular bull market. Macroeconomic problems in the world, massive money supply, artificially low interest rates, BRIC countries' growth and other fundamental factors are. Technical analysis is just a tool that helps to time the best entry and exit points within this major move up. As such it will not drive gold, just as it has not driven it in the past. However, will the moves continue to be detectable by technical analysis? Most probably yes.
Q: Technical analysis is useful in indicating the support levels to watch out for while the USD Index rises. But it may be only that – an indication, because market participants know either way gold will win out. And precisely because of this gold may not fall below USD 1500--with an indicated potential bottom around USD 1350. I think these considerations need to be more openly discussed even if one argues that gold will eventually win out but may have a technical drop of another, say, 20% before we get there.
A: We will be happy to discuss technical factors pointing to higher or lower prices in gold in the short term. However, the abovementioned factors neither support nor contradict gold's decline in the short run. It is simply something that will likely be seen "in some time," probably months or even years from now. Here's one of the ways that we're going to monitor it: if USD rallies to 86 or so and gold is still above 1500, then we will most likely believe that it will not go below this level and even if so, the drop would just be temporary. However, at this time we think the odds favor a breakdown below this line followed by further weakness.
Q: There are ways of staying in a gold position and hedging the downside risk, and even making money on the volatility in the short hedged position through playing (in/out) the intra-week volatility in the price ranges, even as they shift going forward. But I understand this may not be everyone's cup of tea! That's what I do currently building up a bigger positive spread between my long/short positions so that I have additional spread to play with when deciding when gold has reached a bottom and I start closing out my shorts. I hope to do this in 2013, if not sooner, and would be surprised if gold loses another 15%. But you might prove me wrong, so I am keeping my shorts for the moment. I know it is a tough call as you have customers, and need to position yourselves accordingly, but if you had to call it (based on your view about QE timing, and other economic/political interventions) , do you think that the next big move up in gold will be this year or next and what upside range would you foresee?
A: We think that the next big move might start close to the end of this year or in 2013. At this point we see this as a 60/30/9 probability: 60% for this year, 30% for next year and 9% for the following years. The remaining 1% is for the case that we are wrong about the secular bull market in precious metals and that the next big move up in gold doesn't arrive for at least 10 years.
---
Q: Any thoughts as to whether the continuing drop in oil prices will be, in itself, an effective QE3, thus rendering a move by the Fed unnecessary? The Saudis are pumping like crazy to help their buddy Obama. Lower gas prices + improvement without the need for QE3 (thus, Obama plan is working) = good tactic until the elections. Nothing is going to help unemployment in time anyway.
A: We don't think that lower crude oil prices will be enough to really help the economy. Sure, that's a positive factor if prices stay low for a long time (which we doubt), but there are many other factors that it will not solve like the European solvency crisis and structural inefficiencies.
We believe that lower oil prices will be something that Bernanke uses as an excuse for another round of QE in order to stimulate the economy. After it is announced, stocks and commodities could rally, but we guess that Bernanke wants to save this bullet for a time when it is really needed - after stocks really start to slide and people begin to panic.
Q&A: Poll
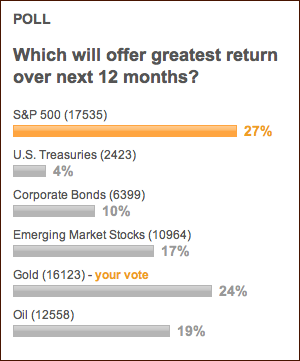
Last week we featured one of the polls seen on finance.yahoo.com. Here's another one - it shows two interesting things. First, only 24% of visitors to the website believe in the gold market, thus we are likely far from the end of the bull market. Second, only 27% people believe that stocks will outperform other asset classes. This is neither bearish nor bullish and suggests that a big move in either direction in stocks can be seen, based on the analysis of sentiment. So, the Fed's bearish actions (or rather the lack of the key bullish one: QE) might come to fruition. The impact on precious metals will likely be bearish.
Q: Hello, I have a few questions. If gold goes down as we are expecting, how low can the GDX go? What is your target? How long will this play out? A few months? Another year? Thanks.
A: We have two targets for the HUI Index: 300 and 160. This translates approximately into $31 and $17 GDX. Our best guess is that the decline will end in 1-6 months which means before the end of the year. Out of this time frame, the next 2-3 months appear most probable at this moment. In all cases, we will be watching gold and silver because a bottom in one of them might mean a bottom in mining stocks regardless of the price of the GDX ETF.
Summary
The situation in the USD Index continues to impact the precious metals. The recent breakout appears to have been verified and this along with the breakdown in the Euro Index has very bearish implications for the entire precious metals sector.
The technical analysis of this week's gold charts is a bit more bearish than not. The situation would actually be much more bearish if the USD Index and the current Fed approach is taken into account. This bearish outlook holds true for silver and mining stocks as well.
The mining stocks have a few additional bearish factors. These are the implications from the Toronto Stock Exchange Venture Index and the significance underperformance of mining stocks relative to gold and other stocks. This suggests that the declines for mining stocks are not over yet, so betting on lower prices with speculative capital is a good idea.
Being partly out of long term precious metals holdings still seems like a good idea today. Keeping some physical gold and silver for insurance purposes is suggested, however. In closing, we do wish to emphasize that hedging one's positions (especially long term) is, in our opinion, superior to selling them.
This completes this week's Premium Update. Our next Premium Update is scheduled for Friday, July 27, 2012.
Thank you for using the Premium Service. Have a profitable week and a great weekend!
Przemyslaw Radomski

