This week marked the Year of the Dragon in the Chinese calendar, and according to Chinese mythology, Dragon years bring powerful changes and optimism representing imperial power, prosperity and good luck. This year is supposed to be even more auspicious since it's a Water Dragon year, something that occurs once every 60 years. We admit that we don't yet use the Chinese Horoscope as a technical indicator, and who knows, perhaps we should. One thing is certain—the Year of the Dragon began with an auspicious move for precious metals. The dragon that breathed fire into precious metals prices was the Federal Reserve which announced this week that it is planning to keep interest rates at rock bottom for some years and hinted at further economic stimulus measures. Gold prices hit 6-1/2 week highs on Thursday as stock markets, commodities and the euro all rallied. This followed Wednesday's biggest one-day rise in three months after the Fed said it might consider further monetary easing through bond purchases (creating fiat currency out of thin air) and pushed back the likely timing of an eventual interest rate hike to late 2014.
Since many view a U.S. rate hike as a kiss of death to the gold bull market (we disagree), the news that it won't happen for at least three more years prompted those on the sidelines to join the ride. Gold closed above its 100-day moving average, a technical factor that further boosted confidence.
In the chipper Market Alert we sent Thursday morning we said we are encouraged by the fact that the rallies took place on huge volume, which in itself speaks volumes for further increases in the price of precious metals. We suggested that those who are waiting on the sidelines with their capital should consider buying gold, silver and platinum sooner rather than later. Traders who are not risk-averse may consider increasing the sizes of their long positions.
The Fed said in a statement that the economy had expanded “moderately” in recent weeks, but that unemployment remained at a high level, the housing sector remained in a deep depression, and the possibility of a new financial crisis in Europe continued to threaten the domestic economy.
Usually after the Asian gold buying binge for the Lunar New Year gold demand tends to drop along with winter temperatures. We have reasons to believe that will not be the case in the short term. Generally, central bank demand is not subject to seasonality (although one could argue about the business and election cycles impact). Accumulation by countries has removed several hundred tons of gold from the market in each of the past two years and there is no reason to think that this year will be different. Central banks use periods of price weakness to step up their buying which reduces downside risk for all of us while setting the stage for sizable snap-backs. Central banks around the world added 157 tons to their holdings in the six months through November, recent World Gold Council data show.
The gold accumulated by Chinese for the Year of the Dragon is not likely to go back into the world market since most Chinese savers and investors buy gold as long-term, quasi-permanent holdings. That coupled with buying by central banks whose holding periods can be measured by decades, means that there is less supply and any rise in demand for jewelry is likely to have a greater effect on the metal's price than might have been the case several years ago.
According to Goldman Sachs, gold provided the best returns of all commodities in the past five years when adjusted for volatility and says the rally will continue as options traders signal no change in the metal's relatively low risk.
The Bloomberg Riskless Return Ranking shows the Standard & Poor's GSCI Gold Total Return Index produced a 6.5 percent risk- adjusted return in the five years that ended this week, the highest among 24 commodities tracked by S&P, data compiled by Bloomberg show. Silver, the next-best performer, yielded a risk-adjusted gain of 3.1 percent, while a total-return index for all raw materials slipped 0.2 percent.
Goldman Sachs forecasts gold will reach a record this year. In a Jan. 13 report Goldman Sachs said that gold futures will advance to $1,940 an ounce in 12 months. Morgan Stanley forecasts the metal will climb to a record average $2,175 in 2013. David Einhorn's Greenlight Capital Inc. said in a Jan. 17 letter to investors that the fund continues to hold gold and gold-mining equities because of concern that global fiscal and monetary policies "tempt fate." George Soros increased his stake in SPDR Gold Trust (GLD), an exchange-traded fund tracking the metal, to 48,350 shares as of Sept. 30 from 42,800 and added options, according to Securities and Exchange Commission filings. Soros reinvested in gold shares after selling 99 percent of his holding in the first quarter of last year.
Nouriel Roubini, the economist who predicted the 2008 financial meltdown, said this week that the risks that spurred market volatility last year will keep swaying asset prices and the global economy. He listed as "persistent problems" rising commodity prices, saber rattling and uncertainty in the Middle East, the spreading European debt crisis, increased frequency of “extreme weather events” and U.S. fiscal issues.
We were just kidding when we said that the Chinese horoscope should be considered a factor in analyzing gold, but perhaps it is not a laughing matter. While in the West horoscopes are regarded as a bit of fluff, in the East they are taken very seriously. So if millions of Chinese believe that the Year of the Dragon is a good time to buy gold, perhaps it's time to factor this into our forecasts. China overtook India in the third quarter as the largest gold-jewelry market, according to the World Gold Council.
We ran across unconfirmed reports that India may barter some of its gold holdings with Iran, in exchange for crude oil. The report, which appeared in an Israeli website, coincided with the visit of an Indian official delegation to Tehran last week to find ways to continue the bilateral trade despite the sanctions imposed on Iran. Use of gold as currency may help India get around the proposed freeze on Iranian central bank's assets and the oil embargo that the EU foreign ministers have agreed to impose on Monday. India depends on imports to meet around 80% of its oil requirements and Iranian crude accounts for a 12% share in India's total oil imports. Naturally, this is a step toward re-introducing gold as a major international currency, which is a very bullish factor for yellow metal's price.
To see if the Year of the Dragon will be as auspicious as millions of Chinese believe it will be, let's turn to this week's technical part with the analysis of the USD Index. We will start with the very long-term chart (charts courtesy by http://stockcharts.com.)
USD and Euro Indices
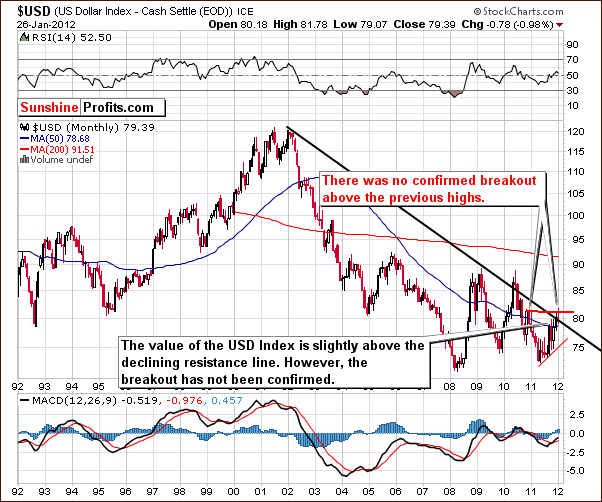
Our first chart this week is the very long-term USD Index chart. There has been virtually no change within the past week, but we can clearly see that the recent breakout above the long-term resistance line is being verified or invalidated at this time. The latter is more likely (70% probability or so) since the recent breakout was not confirmed. A reversal to the downside is more probable and likely underway already. The downside target level at this time appears to be in the 75 range based on the red rising support line in our chart created from recent bottoms.
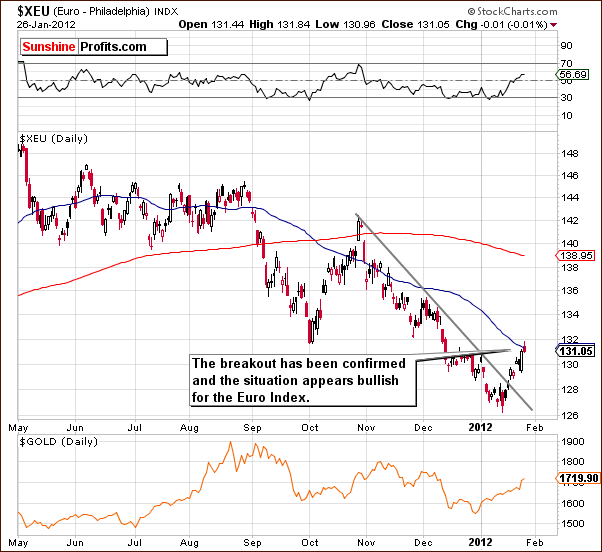
In the short-term Euro Index chart, we see a confirmation of the recent breakout. Last week we had discussed the lack of a confirmation and a possible breakout in the Euro Index. Several days of closing prices above the support line without any significant moves to the downside not only confirm the breakout, but they also point to strength in the Euro Index at this time – actually that’s more likely weakness in the dollar that we’re seeing here, as currency exchange rates are ultimately relative valuations of currencies against each other and the recent statement from the Fed did not help to boost confidence in the greenback.
Summing up, the situation in the USD Index is bearish at this time as the previous unconfirmed breakout above the resistance line is being invalidated. At the same time, the breakout in euro above the short-term declining resistance line has been confirmed, which is bullish for euro and bearish for dollar. The recent statement by the Fed, where interest rates will be held at zero percent is likely grounds for a well-founded, medium-term decline for the USD Index.
General Stock Market
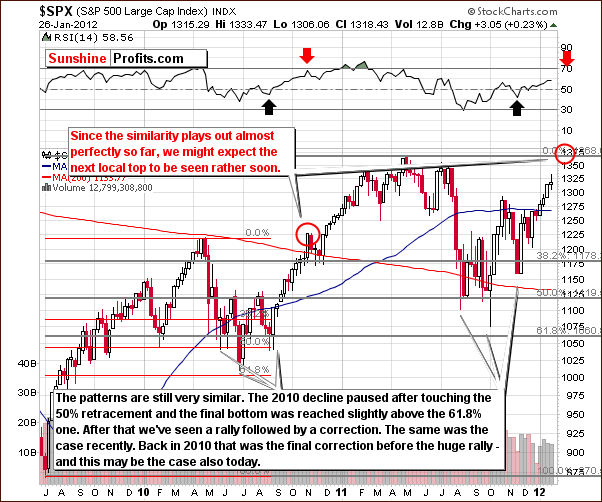
In the long-term S&P 500 Index chart, the self-similar pattern which we’ve been discussing for a few months has continued to play out well. If this goes on, the next local top will probably be close to the level of the 2011 high. The recent trading pattern has been consistent with the period leading up to the local top in 2010-11. In October-November 2010, declining prices were seen for a few weeks but were quickly followed by a continuation of the rally. We may have a similar situation here.
RSI levels should be looked at as well and are also indicating that a rally is likely ahead. It appears that it could last for two to four weeks as the RSI level will then likely be close to 70. This has coincided with local tops in the past.
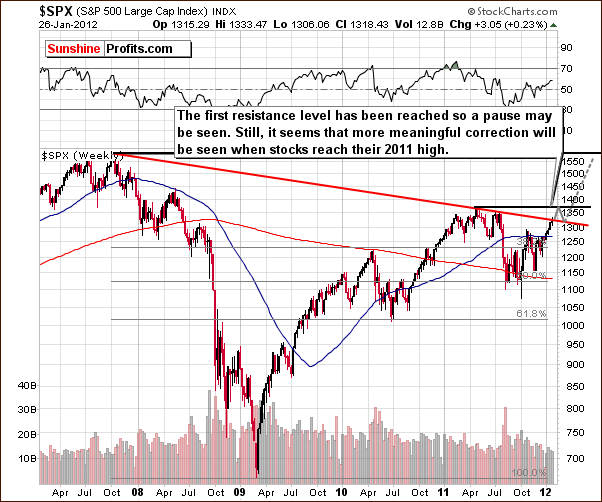
In another long-term S&P 500 chart, we once again see that an upside move up to the level of previous highs could be in the cards if the recent pattern holds. If the index reaches this 1,375 level and then consolidates, pauses or declines slightly (likely outcome in our view, as indicated on the above chart), this will confirm the breakout above the red declining resistance line. Another move to the upside would then seem likely.
Such a move is likely to more or less follow the dotted line from around 1,325 to 1,500 in our chart; it may not be quite as direct or straight.
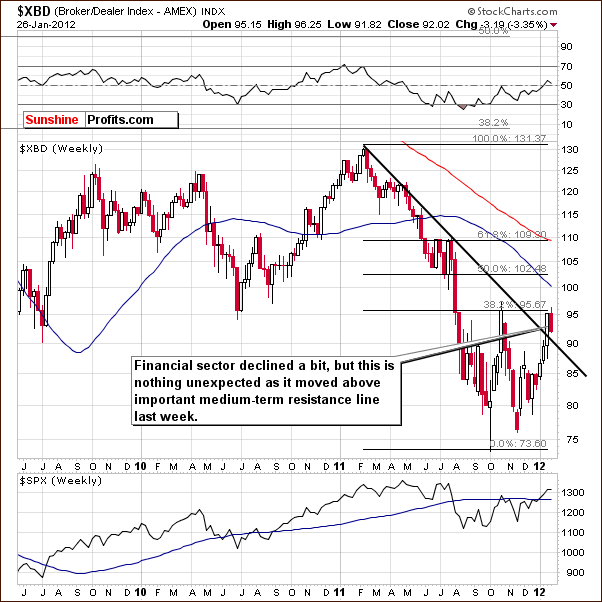
In the Broker Dealer Index (proxy for the financial sector) chart this week, some weakness has been seen but is not of real concern. The financials have reached the 38.2% Fibonacci retracement level so a pause is nothing uncommon; they are now verifying the breakout above the declining resistance line. It is quite normal to see a short period of consolidation after such a move, and if the index moves above the 38.2% resistance line, a clearly bullish picture will also be seen in the financials.
Summing up, the situation for the general stock market is a bit unclear for the next few days, but the outlook remains bullish for the weeks and months ahead. The “ground-zero” interest rate decision by the Fed was a positive move for stocks and precious metals as low cost financing is beneficial for corporations and Investors alike.
Correlation Matrix
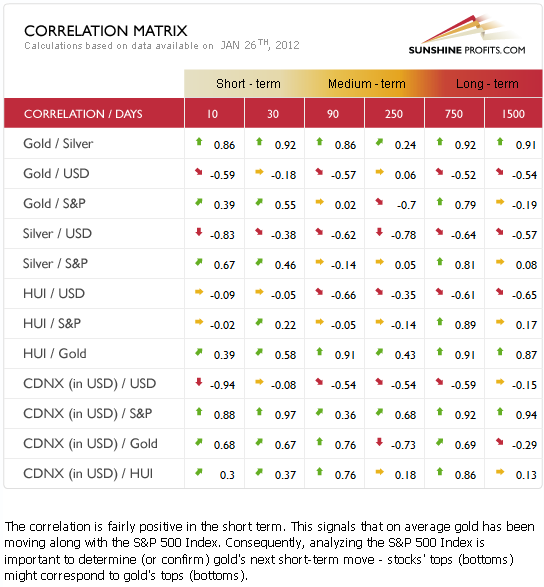
The Correlation Matrixis a tool which we have developed to analyze the impact of the currency markets and the general stock market upon the precious metals sector. Significant changes have been seen here this week. The correlation between the USD Index and the precious metals is rather weak and can be attributed to the strong European demand for gold. The yellow metal's price has rallied in all currencies and the correlation between the dollar and gold's price has therefore weakened.
A declining USD Index is medium-term bullish for gold and the precious metals, and the coefficient in the 90-day, medium-term column indicates this. The precious metals and the general stock market both have bullish outlooks at this time and several of their coefficients reflect this although the relationship cannot be described as strong. It seems best at this time to look directly at the precious metals themselves in order to analyze their likely short-term and long-term trends.
Gold
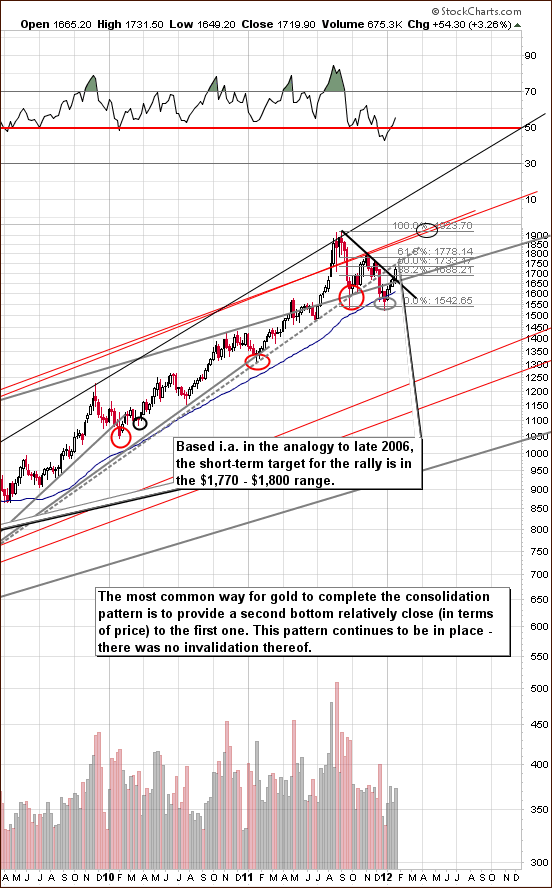
We begin our gold section this week with a look at the very long-term chart (please click the above chart to enlarge). This week gold broke out above the declining resistance line and since it's visible even from the very long-term perspective, it is likely a true direction. For this reason (along with other reasons mentioned below), the lower downside target levels have been removed (compared to the previous week’s charts). Higher prices appear likely from here and are expected in the week ahead.
Based on this chart and looking back to trading patterns seen in late 2006, it seems that gold's next meaningful target level is between $1,770 and $1,800. Back then, gold moved close to its previous high, and this analogy is preferred here since the pattern has been repeating remarkably well up to this point.
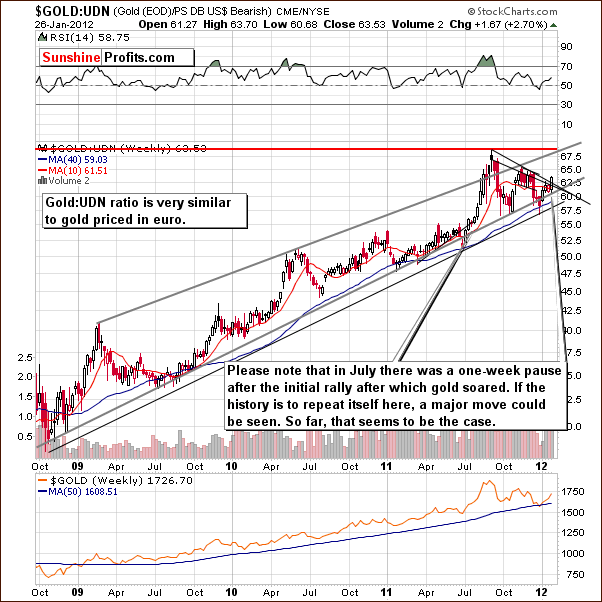
In this week's long-term chart of gold from a non-USD perspective, we also see a breakout. This is a bullish development and indicates that investment demand for gold is high in other currencies in addition to the dollar-related one. This makes the rally and the breakout more credible as it reflects the attitude of world-wide investors, not just those that use the USD on a daily basis.
The additional bullish implications here are due to the self-similar pattern seen when comparing mid-2011 and recent weeks. A continuation of the pattern means a significant rally without any corrections and although this does not appear to be the most probable scenario right now, it is still a possibility.
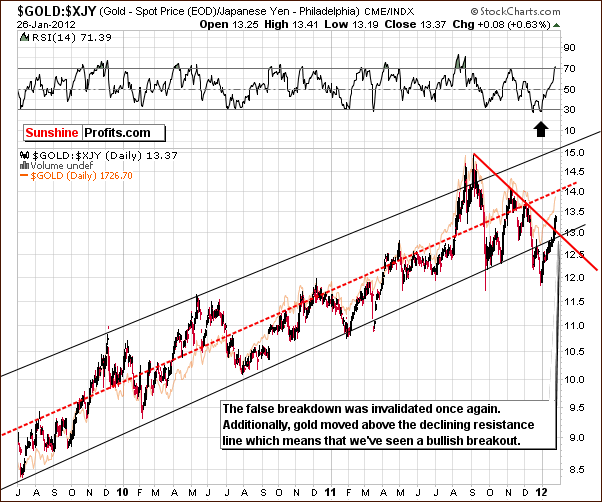
In this week's long-term chart of gold from the perspective of the Japanese yen, the index has moved back into the trading channel and above the declining resistance line (marked with red). This is also a bullish development. Based on the previous significant top, it seems that the index will rise to around the middle of the rising trend channel (rising dashed, red line). This would coincide with a level around 14 in the ratio, considerably higher than where we find it today.
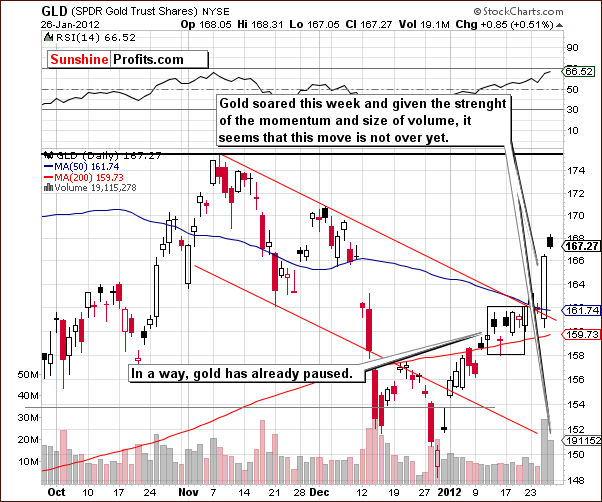
In the short-term GLD ETF chart, this week has seen higher prices and the next significant resistance is at the level of the November 2011 top. This is considerably higher than Thursday's closing level and it seems likely that the rally seen this week will continue.
The breakout above the declining trend channel has been accompanied by huge volume and a session where the gains held, also on significant volume. The move is therefore confirmed. A small pullback is possible at this time and if seen on low volume, will present a buying opportunity for those who have missed out. Note that in late October 2011, a small pullback was seen with prices declining on low volume. A sharp rally followed and such a pattern is likely to be seen once again.
Summing up, the situation for gold is very bullish at this time. A small pullback appears possible in the next few days, but the rally seems likely to continue thereafter. The upside target levels are between $1,770 and $1,800 for spot gold and $174 for the GLD ETF. If gold moves to $1,700, we will view it as a buying opportunity and those who did not get in the market yet will have another very favorable opportunity to do so.
Silver
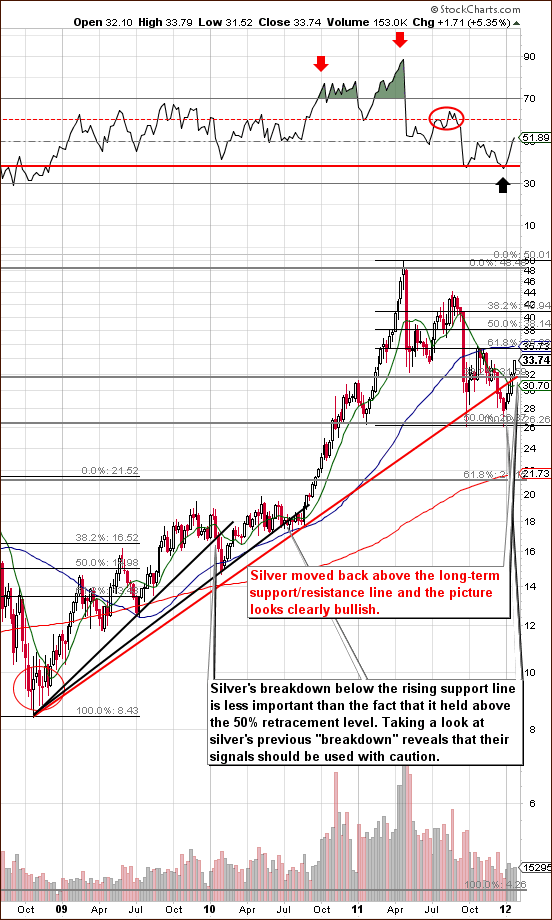
In this week's very long-term chart for silver (please click the above chart to enlarge), we see yet another breakout. It appears that this really has been a week of breakouts for the precious metals. Silver has moved above the 38.2% Fibonacci retracement level based on the 2002 to 2011 upswing. What is even more important, it also moved above the rising red line in our chart, which represents very long-term support and resistance. This move is not yet confirmed but likely will be if the week closes with silver's price still considerably above this line. Likely target levels are the 50-week moving average and the 61.8% Fibonacci retracement level, which equates to a price level slightly below $36. This is where we believe that the next local top will form.
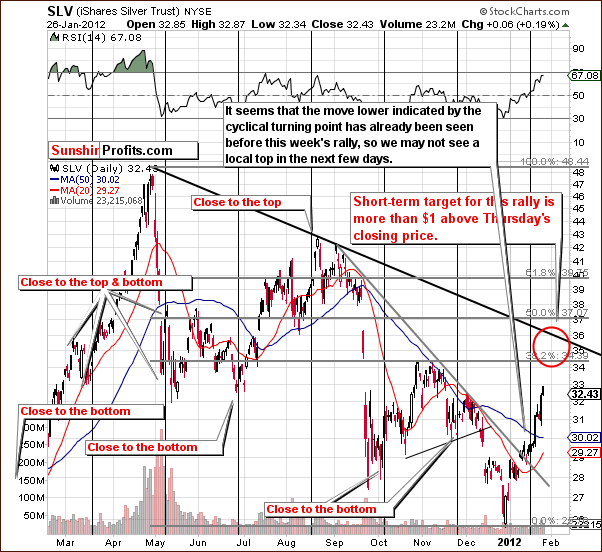
Looking at silver's short-term chart, we see that prices have rallied sharply and are approaching a target level likely in the $34 to $36 range. There is little to definitely stop the rally at this point and higher prices are probable for the days and week ahead.
In the previous Premium Update, we discussed the short-term situation as follows:
Looking at silver's short-term chart, the situation is somewhat ambiguous, much as we saw in the case of gold this week. Here we have a cyclical turning point upon us and the small correction seen recently may or may not be the expected local bottom to coincide with the turning point. There could be another move to the downside to create the true local bottom.
At this point, it seems about 50/50 as to whether we'll see another local bottom form or whether a move to the upside will be seen right away. The small decline seen recently did provide a verification of the breakout above the declining short-term resistance line; this is bullish in and of itself.
It turned out to be a move to the upside right away, much to the delight of investors in the white metal!
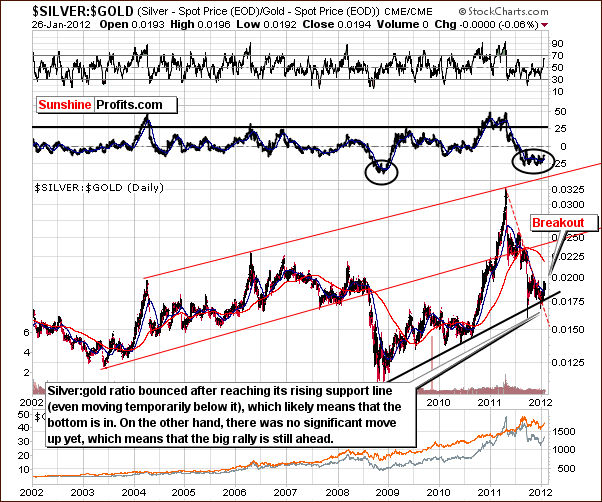
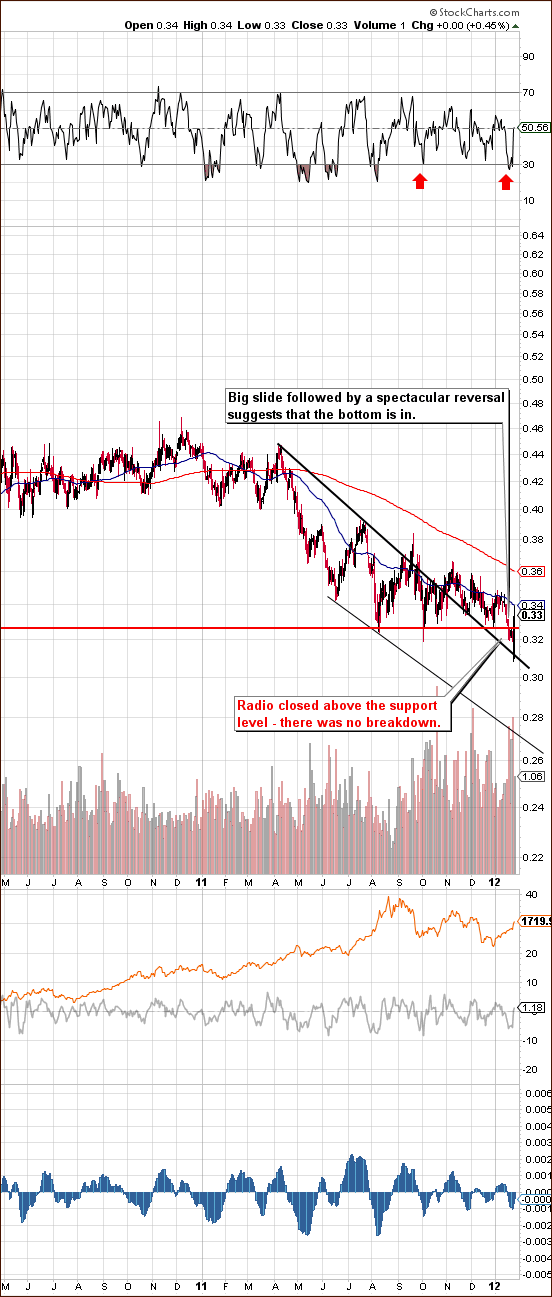
Looking at the silver to gold ratio chart, we see yet another breakout. The ratio has moved above the declining resistance line created by previous highs and indicated by the red dotted line in our chart. The situation here is bullish and indicates higher prices not only for silver but also for other metals, as silver used to outperform gold during most major upswings in the precious metals sector.
Summing up, the situation is bullish for silver in much the same way as we saw for gold. We have also seen a few breakouts in silver's charts this week. In short, the bullishness seen for the white metal provides confirmation of the bullish outlook for gold. If silver moves to $32, we will view it as a buying opportunity and those who did not get in the market yet will have another very favorable opportunity to do so.
Gold and Silver Mining Stocks
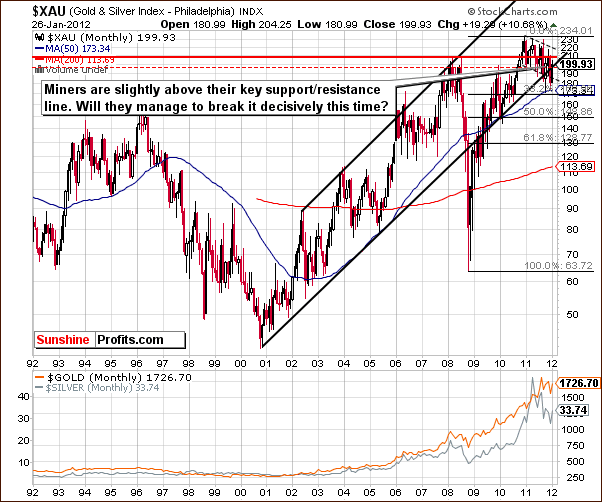
In this week's very long-term XAU Index chart, a move above an important long-term support/resistance line is seen. The recent breakdown is therefore invalidated (just like it was the case with previous similar moves), and Thursday's strong move should be viewed as a bullish confirmation of this fact.
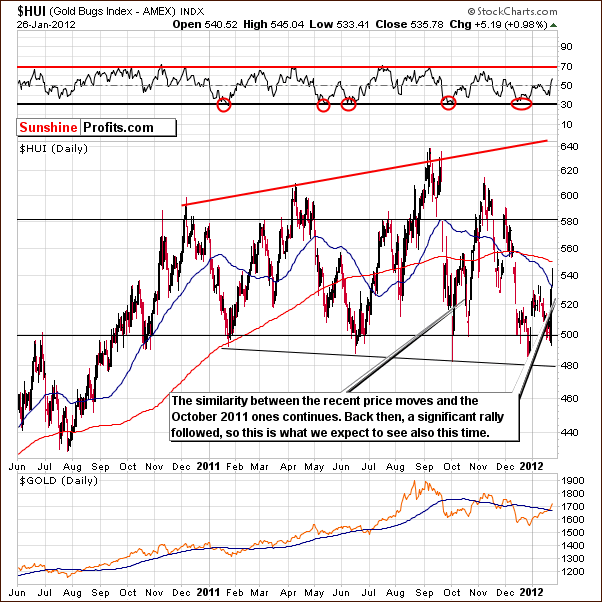
In this week's long-term HUI Index chart, a sharp rally has taken place following the recent fake-down (instead of breakdown) below the 500 level. This is very much in tune with last October's trading patterns which were followed by a sharp rally in which the index rose in excess of 20%. Such a rally appears possible once again.
The next few days could see a small move to the downside, but a reversal will most probably follow. The 580-level appears to be a valid upside target for the coming weeks. A local top near this level would then likely be followed by a period of consolidation/decline with a subsequent rally thereafter possibly approaching the 650 level.
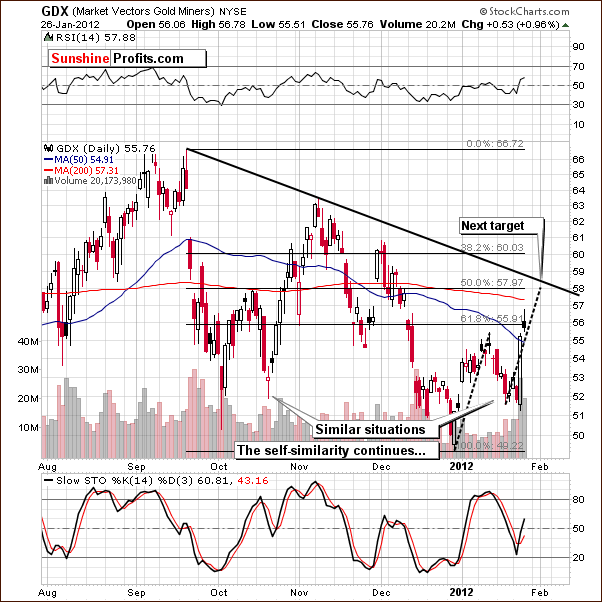
In the short-term GDX chart this week, the miners have followed the path outlined in the previous Premium Update. We stated the following: "The recent decline took miners to the October 2011 level. If the correction is over, then expect a move to the upside similar to the previous one. Calculating the medium-term resistance line brings us to a likely target around $58."
The miners appear to be heading to the $58 level where the declining resistance line and the 50% Fibonacci level coincide. Once this short-term resistance line is reached, a pause in the rally is probable after which an additional period of rally seems likely.
Once again we have included the miners to gold ratio chart. This week, we have seen a small false breakdown to the declining support line and then a huge move back up. This is a sign of strength and more likely than not, the local bottom has already formed – the odds are now higher then during the previous similar moves in the previous months.
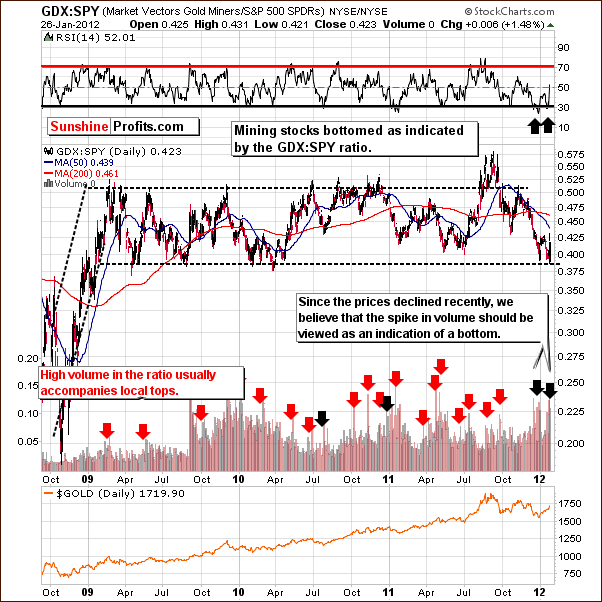
In the GDX:SPY ratio chart, we see a confirmation of the recent bottom with the huge spike in volume. This indicates that higher prices are likely in the days ahead. We do have a word of caution however and will use our next chart to explain.
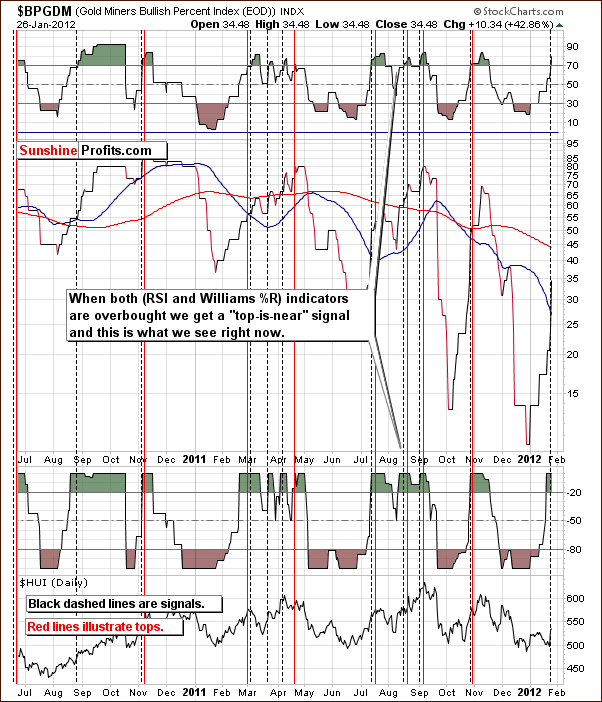
In the Gold Miners Bullish Percent Index chart, we see that both the RSI and the Williams %R are overbought and a “top is near” signal has flashed. Please note that it usually takes some time before this signal comes into effect, and at this time, this – combined with other signals covered earlier – makes us believe that the local top will likely not be seen until late next week or the week after. It will likely be reached when GDX ETF moves near $58, the SLV ETF is near $35 and gold is slightly below $1,800.
Summing up, the situation in mining stocks remains bullish and very much like the outlook for gold and silver. The miners' sharp increase this week has confirmed the similarity with the late October trading pattern, and the implications are bullish from here. A period of consolidation throughout the sector is likely once target levels are reached, and the rally could very well continue thereafter. Immediate-term downside targets for the miners are unclear, but if gold moves to $1,700, we will view it as a buying opportunity also for the mining stocks and those who did not get in the market yet will have another very favorable opportunity to do so.
Sunshine Profits Indicators
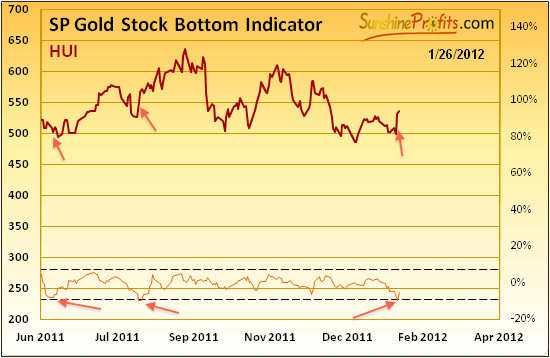
Turning to our Sunshine Profits Gold Stock Bottom Indicator, we see that a buy signal has flashed this week. In the recent past, similar signals were seen in June (technically, there was no signal in this case, but the indicator was very close to providing it) and July. Both of these previous points in time were followed by periods of significant rally and this is yet another confirmation of the bullish case described earlier in this week's Premium Update.
Letters from Subscribers
Q: Great market update! Do you think this dollar decline will last for a month or is it more likely to be a six month cycle? Also, are we looking at silver running upwards for a month or two (you mentioned similarities to October) or are we looking at a longer up move?
A: It depends on the steepness of the decline, and at this point we don't have clear signals on that. The initial decline followed by a corrective upswing should provide more details, but right now, we are simply guessing that this decline will last at least a month. Of course, it depends on how you measure a decline, because some would say that in 2011 we've seen 2 declines and 2 upswings, while others will insist that we have had at least 10 small declines and 10 small rallies. At this point our best guess is that the USD Index will decline at least to the 75 level. The most important thing, though, is that gold can rally even without lower USD values because of the strong European demand.
Summary
The situation in the currency markets is clearer now as the USD Index outlook turned more bearish and the euro has shown more strength in the past week. This is likely to lead to higher precious metals prices in the month ahead.
The general stock market situation is a bit unclear for the next few days but remains bullish for the short and medium term. A small consolidation is possible fairly soon, but there appears to be a good chance that the current rally will continue thereafter.
The most positive analysis this week was seen in the precious metals sector charts themselves. Gold, silver, and the gold and silver mining stocks have all broken out above important resistance levels this week, generally on huge volume levels as well. The bullish developments have also been confirmed by analysis of ratios and the buy signal our SP Gold Stock Bottom Indicator chart's buy signal.
The situation is currently very bullish overall for the precious metals sector and it appears that a bet on higher prices for gold, silver, and the gold and silver mining stocks is a good idea at this time. Target levels of $1,770 to $1,800 for spot gold, close to $36 for silver, 580 for the HUI Index, and $58 for the GDX ETF appear to be valid and are all representative of the expectation that strong moves to the upside are likely ahead. Once these levels are reached, we might expect to see a corrective decline most likely followed by another upswing. If gold and silver move lower very soon - to $1,700, and $32 respectively, we will view it as another buying opportunity.
This completes this week's Premium Update. Our next Premium Update is scheduled for Friday, February 3, 2012.
Thank you for using the Premium Service. Have a profitable week and a great weekend!
Przemyslaw Radomski

