
The new year started off with a bang with precious metals out-shining the competition. Is this a harbinger of things to come? We think so and we are not alone. Forecasts for gold for 2012 include a price per ounce of $2,200 by Morgan Stanley, $2,050 by UBS, and $2,000 by Barclays.
The year 2011, for other than gold investors, has been a disappointment, more like a train wreck. Growth has been paltry, unemployment remained high, sovereign debt in the stratosphere. The U.S. political system has been dysfunctional unable to make easy decisions, never mind the hard ones. There was no housing rebound and the eurozone looked like it was a house of cards. But look on the bright side. Despite a prophecy by Harold Camping, the world did not end on May 21.
There was also some other good news. There was no double dip in 2011. Osama bin Laden was “laid to rest in a solemn ceremony concluding upon impact with the Indian Ocean at a terminal velocity of 125 miles per hour,” (at least that’s the official version) in the words of Dave Barry, humor columnist for The Miami Herald. Moammar Gadhafi and other dictators also suffered major setbacks (to put it mildly.)
There are some issues hanging over the economy in 2012 that will determine if the upcoming year will also be a disappointment. Here are some questions to ponder in no particular order of importance.
Will the U.S. political system behave like an adult?
In 2011, American politics was silly undermining confidence in ways that damaged economic prospects. There was the April battle over spending that nearly shut down the government and would have had a devastating effect on the ability of Congress to continue spending insanely more money than it actually has. The December standoff was over whether to continue a cut in the payroll tax that both parties agreed to in principle. But most damaging was the summer brinkmanship when many House Republicans threatened to block an increase in the debt ceiling — which would have meant a default on U.S. debt — unless they got their way on major spending cuts. The sides hammered out an agreement under which the government will continue to spend tons more money than it has while a super committee will devise a plan to solve this problem once and for all. This committee fell short of its goals. Perhaps in 2012 we will see “a Super Duper Committee.” Even after a deal was struck, Standard & Poor’s cut the U.S. government’s credit rating, blaming the downgrade on the reduced “effectiveness, stability and predictability” of American policymaking.
Will Barack Obama be re-elected?
Stay tuned. It’s going to be a cliffhanger. Obama has going for him the lackluster Republican lineup. He may actually win. But with a razor thin mandate and a Republican-controlled Congress, Obama in his second term will not have much room to maneuver. With the economy in such a fragile condition, it would be best, whatever the outcome of the November election, that the result be decisive and unifying. Meanwhile, a move toward a libertarian approach sill appears unlikely.
Will the eurozone hold it together?
This may be the year that weaker member-states are booted from the euro. Will the continent fix its financial troubles or spiral out of control affecting not only the U.S. economy, but the global economy? The answer rests with Europe’s leaders. The sacrifices and austerity needed to preserve the currency zone and prevent a global financial collapse could become too heavy a burden for the political systems of one or more of the European nations. The whole house of cards is perched on thin ice. One wrong move and the world financial system would be in peril in the same way it was in fall 2008.
In the words of Dave Barry: "Moody's announced that it has officially downgraded Greece's credit rating from "poor" to "rat mucus" following the discovery that the Acropolis has been repossessed."
But seriously, more eurozone troubles this year could mean more dollar (and gold!) buying even though there is no way to know how the euro will react in the short-term to such threats that may already be priced into the market. There is no doubt that the eurozone will be stronger without its weaker members. The problem is that the act of removing anyone from the eurozone will cause instability and will be a bullish factor for gold. If the European recession turns out to be mild or nonexistent, it could create a stock market rally and boost confidence worldwide.
For a funny look at the Eurozone problem we again turn to Dave Barry, who wrote that this past year “the economic crisis continues to worsen in Europe, especially in Greece, which has been operating under a financial model in which the government spends approximately $150 billion a year while taking in revenues totaling $336.50 from the lone Greek taxpayer, an Athens businessman who plans to retire in April. Greece has been making up the shortfall by charging everything to a MasterCard account that the Greek government applied for — in what some critics consider a questionable financial practice — using the name ‘Germany.’”
Will the Arab Spring turn into winter?
Religious Muslim parties are gaining power in the various Arab countries dampening hopes for Western-style democracies. Egyptians have not forgotten the directions back to Tahrir Square and the generals’ days seem numbered as are President Asad’s in Syria. The future of the Middle East remains a big question mark as well as the effects on the price of oil.
Can China manage a soft landing?
Troubling signs suggest that the Chinese growth juggernaut, an anchor for the tumultuous past few years, could be slowing down, which raises risks for the global economy.
Can Chinese leaders guide their economy, the second largest in the world, to a soft landing making some overdue economic changes without halting growth? China’s growth has been fueled by exports of manufactured goods and real estate investments. Exporters could be hampered by the likely European recession, and the Chinese housing market is showing signs of trouble, a bubble about to burst. Now the question remains if China can shift to domestic demand for consumer goods and services, and away from exports and housing, without a major recession that could endanger global growth? That answer will help determine the health of the global economy in the coming year.
However, we do not need a fortune cookie to know that China will continue to buy gold, as much as it can get its hands on. China has every motive to move some of its massive $3 trillion-plus reserves into gold, the only currency that no other country can control. At the moment, the richest Western countries, including the United States, Germany, Italy, and the Netherlands, hold between 60% and 80% of their entire reserves in gold. The figure for China is less than 2%. The rest is simple math.
To see what the future has in store for precious metals in 2012 let's begin this week's technical part with the analysis of the US Dollar Index (charts courtesy by http://stockcharts.com.)
USD Index
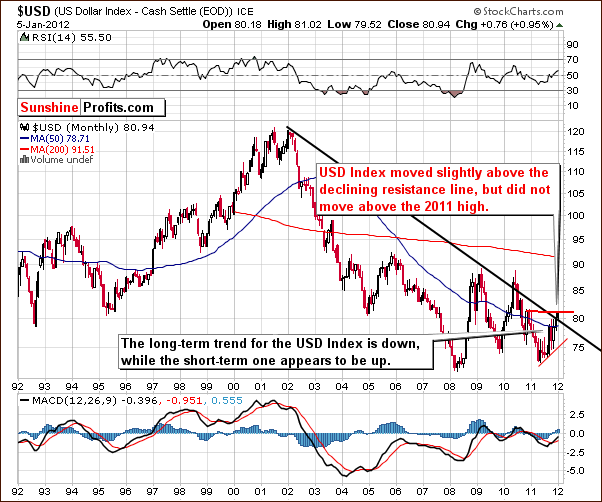
Our first chart this week is the very long-term USD Index chart. The situation is very similar to what we reported in last week’s Premium Update and some of what we wrote bears repeating:
We would like to stress that the dollar has not truly broken above the declining long-term resistance line, and it has not moved above the 2011 high. Consequently, one should not be overly bullish on the USD Index just yet. The index is still below the early 2011 highs and we do not view the breakout above the long-term resistance line as being verified. A move to the downside appears to be quite likely in the coming weeks.
The index has moved to the level of the 2011 highs (though not above) and it is still very close to the declining resistance line. The breakout here has not been confirmed and we are not overly concerned about this recent small move to the upside. The situation still does not appear to be truly bullish. Gold rallied on Thursday in spite of a higher USD Index level. All-in-all, the situation here continues to seem a bit more bearish than not.
General Stock Market
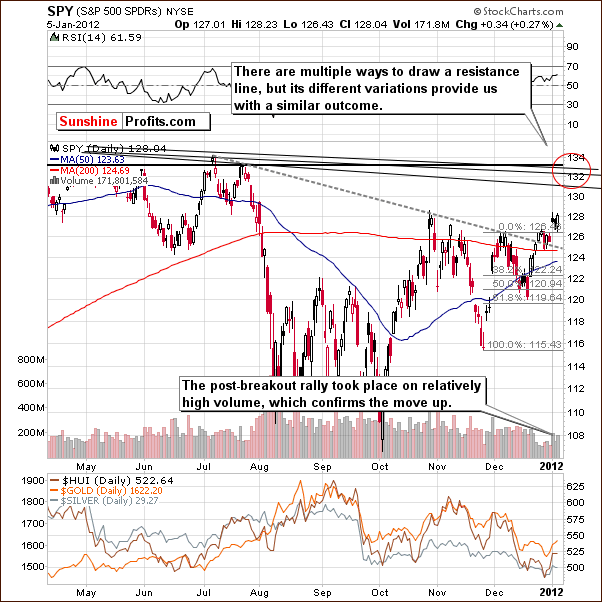
In the short-term SPY ETF chart, we see that the breakout we discussed last week has now been confirmed as high volume levels have accompanied recent moves to the upside. Low volume levels were cause for concern last week, but this is no longer the case.
There appears to be a good possibility that stocks will continue to move higher. The next target level is close to the July 2011 high, about 4% above Thursday’s closing level. We will discuss other target levels when analyzing our long-term chart.
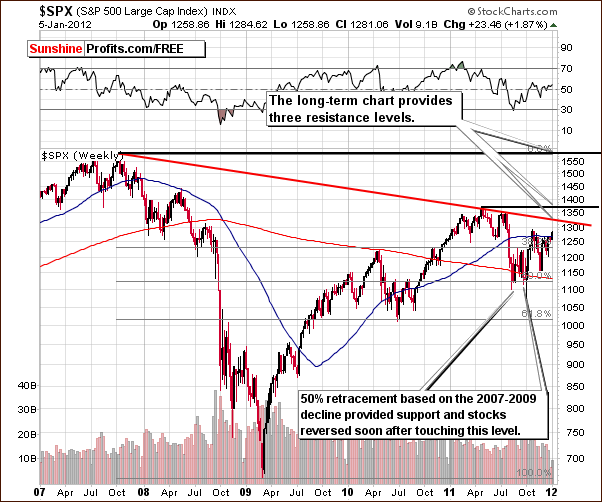
In the long-term chart this week, we see the declining resistance line based on the 2007 and 2011 highs and a second resistance line at the level of the 2007 highs. It seems that an attempt to move above the level of the 2007 high may be seen, but the index will have to break though the two key resistance lines first. At this point, a breakout above these two resistance lines and a move to (possible above) the 2007 high does appear to be likely at some point in the coming months.
Summing up, the situation in the general stock market has improved further this week and definitely appears to be more bullish now than it was a week ago. Price moves to the upside are now supported by significant volume levels, an important factor in technical analysis and generally required for strong moves in any market.
Correlation Matrix
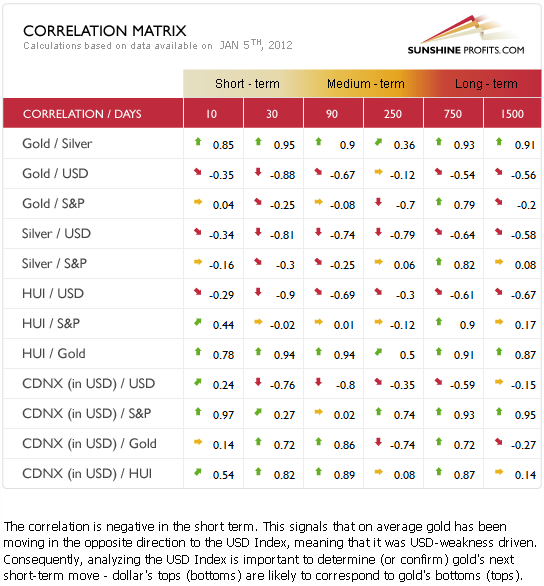
The Correlation Matrixis a tool which we have developed to analyze the influence of the currency markets and the general stock market upon the precious metals sector. The coefficients this week between the precious metals (gold, silver, miners) and the general stock market are a bit more negative but they are too close to zero to be meaningful. The correlations between the dollar and the precious metals markets are the only significant ones this week. These coefficients have been and continue to be negative meaning that declines in the USD Index will generally lead to higher prices in the precious metals sector.
Speaking of USD and gold, Thursday’s higher price levels for both gold and the USD Index are a bullish combination for gold. This clearly indicates a strong overseas demand for the yellow metal.
Gold
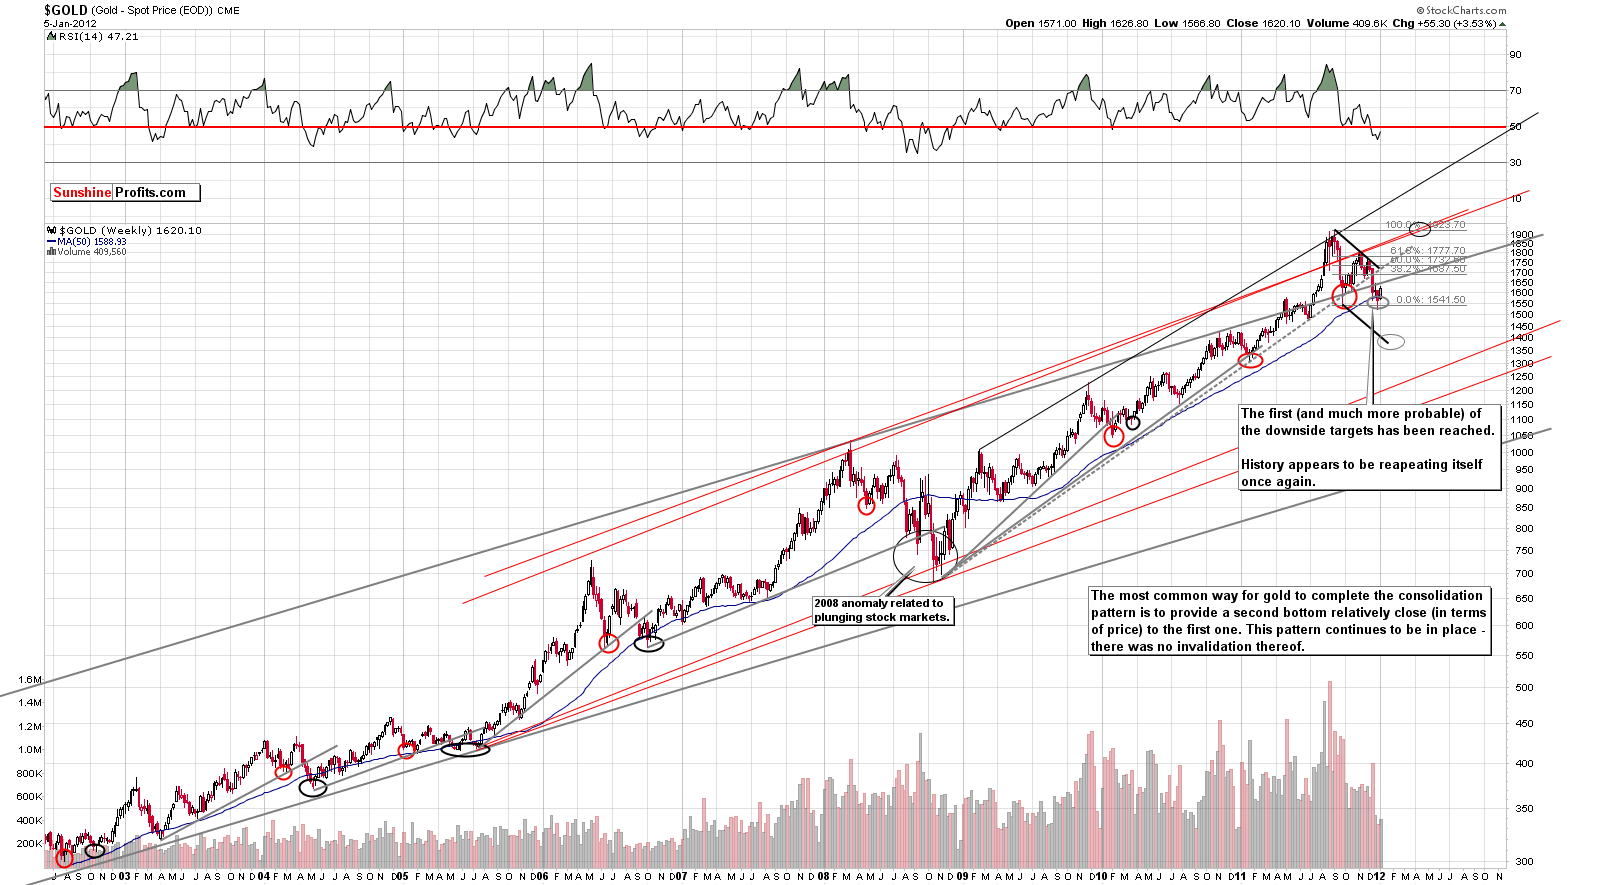
This week, we begin our gold section with a look at the very long-term chart (please click the above chart to enlarge). The double bottom, which we have discussed for some time now, appears to have formed after gold’s recent breakdown. Many times in the past, this has been seen and is generally good news. Completion of this pattern normally leads to a subsequent rally, and with the bottom forming perfectly in our target area, higher prices are now quite likely. Clearly the long-term tendency here at this time is bullish.
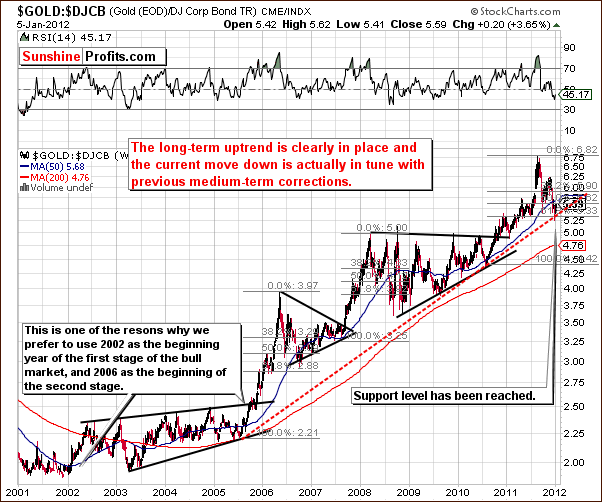
In the gold to bonds ratio chart, we see that a bottom has formed close to the very long-term support line. The ratio looks like it’s ready to rally from here. No breakdown was seen as the support line held, and a rally is therefore likely. This will, of course, coincide with rallies for gold and the precious metals sector overall.
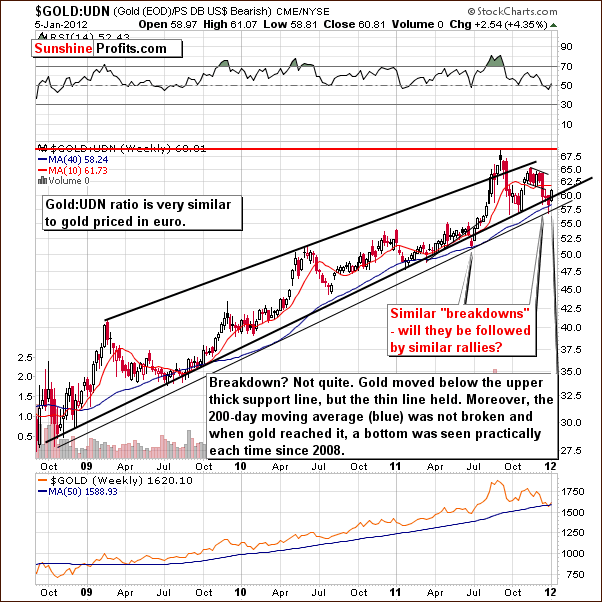
In this week’s long-term chart of gold from a non-USD perspective, we see a pattern similar to what we saw in mid-2011. There has been an initial breakdown below the thick support line in the chart but the 200-day moving average has not been broken. The thin support line has held and prices have now risen back above the support line previously broken.
Indications are that the bottom is in and higher prices are likely from here. A rally could be beginning as gold showed strength on Thursday when it rallied in spite of the dollar moving higher as well.
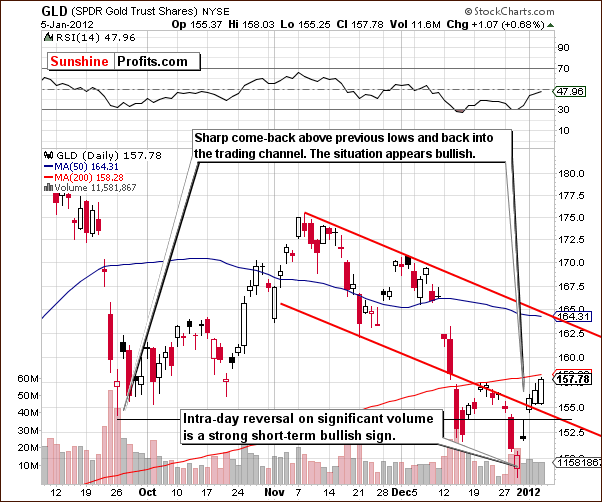
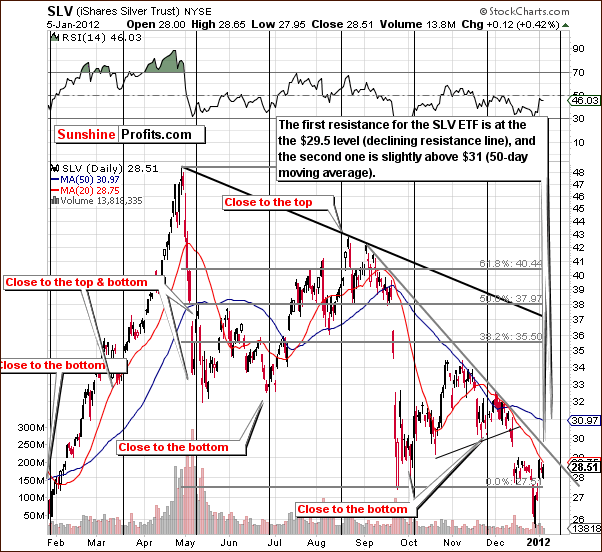
In this week’s short-term GLD ETF chart, we have a bullish confirmation of the previous bullish candlestick pattern. When a rally is seen on significant volume, it is regarded as an important development.
There have been three consecutive closings above the level of previous lows and above the lower border of the declining trend channel. The previous breakdown has been invalidated, and the situation appears quite bullish at this time.
Summing up, the medium-term consolidation for gold appears to be over as a double bottom has formed and prices have begun to rise. Higher prices appear to be likely in the days and weeks ahead.
Silver
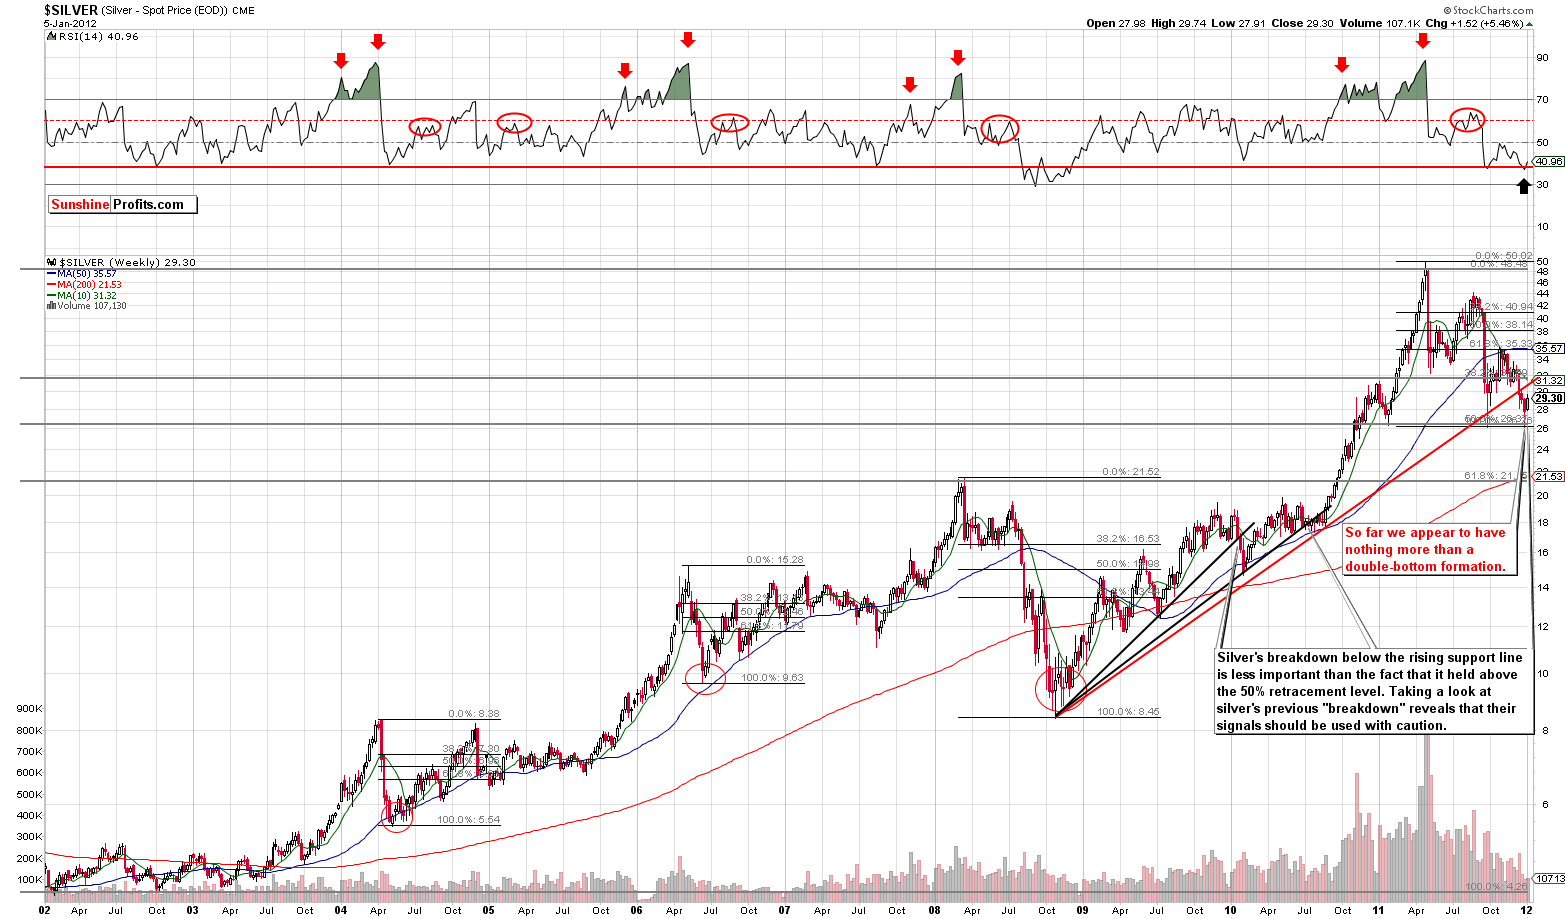
In this very long term chart for silver (please click the above chart to enlarge), we see that silver has bottomed once again. If the nearest resistance level is broken, a significant rally is possible. RSI levels support the significant rally theory beginning now.
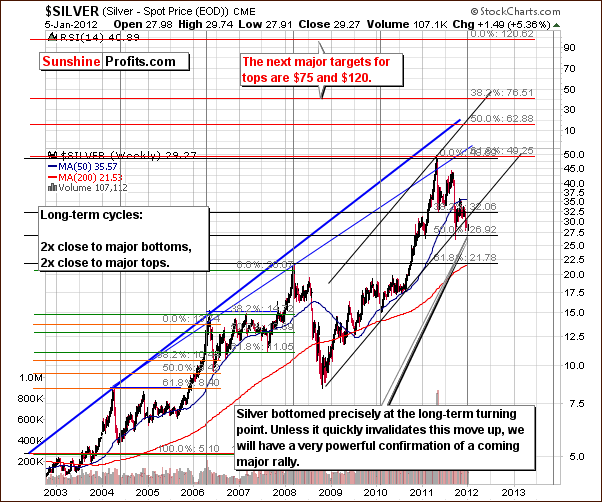
In this second very long-term chart for silver, we see that the cyclical turning point worked perfectly as prices reversed sharply right at that point and then began to rise. These moves further increase the odds that we have seen a major bottom and it could very well be years before silver’s price is as low as it has been recently (or we may never see silver price as low as we just did).
This is by no means a sure bet, but twice previously, when silver bottomed at cyclical turning points in 2004 and 2010, we have seen an ultimate low – lower prices never followed. The long-term charts this week suggest that at least a medium-term rally is underway at this time.
Looking at silver’s short-term chart, the situation is a bit less clear. A cyclical turning point is close at hand and it is not yet clear whether we will see a bottom or a top. Neither appears to invalidate the points made previously since long-term implications are more important and carry more weight than those obtained from short-term charts. For example, we could see a small pause (a local top and then a local bottom) within a rally close to the end of the month.
When silver finally breaks above the declining resistance line (gray) and the 50-day moving average, much clearer signals will emerge. The outlook based on this chart appears bullish at this time but another week or two seems to be needed to tell the whole story.
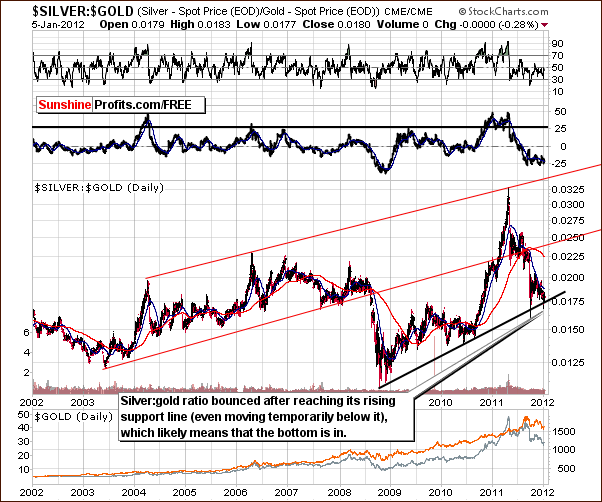
In the silver to gold ratio chart, recall what we said in last week’s Premium Update:
The important point here is that it may very well have reached a bottom. The ratio between silver and gold right now is at an important support line. Based on similar bottoms in the past, it is unlikely that a breakdown will be seen at this time. Moreover, taking a look at the ROC indicator (just above the ratio) reveals that the situation is quite similar to what we’ve seen in late 2008. Since that time, the ratio has never been as oversold on a medium-term basis as it is right now.
Here the bottom appears to be close or – more likely – already in as the ratio moved to the support line. Actually, the ratio moved below it but it quickly reversed and moved back above it. It seems that another rally is now underway.
Summing up, the situation in silver appears to be very bullish at this time based on the long-term indicators. Short-term signals here are more bullish than not. Overall, the situation appears to be quite bullish since long-term indicators carry more weight than short-term signals. In 2004 and 2010, powerful rallies emerged after similar trading patterns.
Gold and Silver Mining Stocks
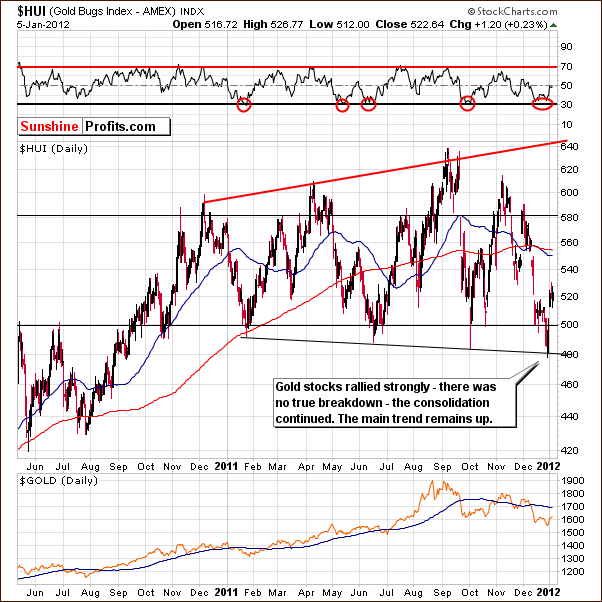
In this week’s long-term HUI Index chart, we see that the index bottomed at the final support line and quickly rallied back above the 500 level. At this point, it appears to have reached the final bottom of this consolidation period. Gold stock prices are likely to soar much higher. It seems that a breakdown back below the support line is very unlikely now as the index level is significantly above it.
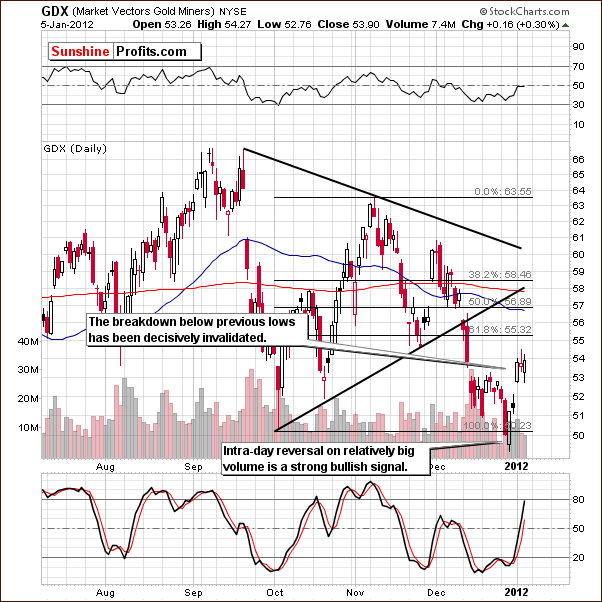
In the short-term GDX chart this week, we see that the rally has paused somewhat in the last 2 days. The sharp move higher on significant volume was followed by a low volume pause on Wednesday and Thursday. Consequently, it appears be just a pause and another rally is likely to be seen next.
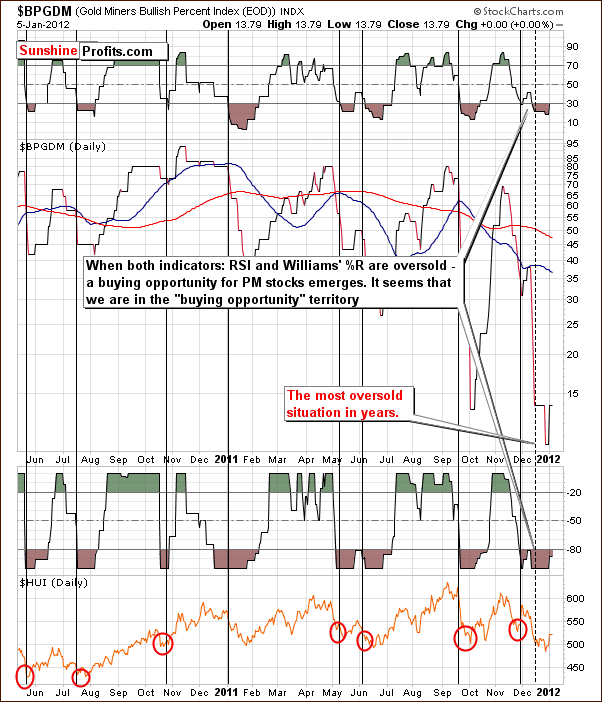
The Gold Miners Bullish Percent Index chart has recently indicated good buying opportunities. This did not mean that a final low had been reached. It simply was a good time to buy. Gold stocks have since moved a bit lower but are now higher and apparently acting on the buy signal over the past couple of weeks would have been a good idea.
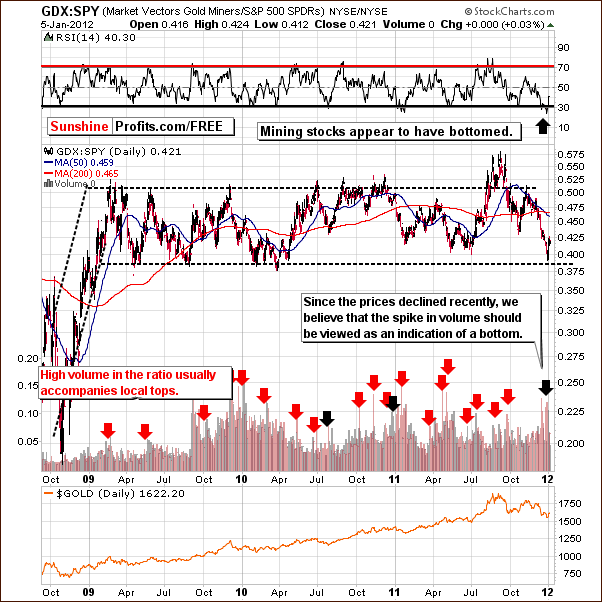
In the GDX SPY ratio chart, a bottom is seen and the ratio is still close to the 2010 lows. Precious metals have been extremely oversold and the RSI levels confirm this. Although this week’s rally may seem sharp, it is truly not significant from a medium or long-term perspective. There is still a lot of room to the upside.
Summing up, the outlook for gold and silver mining stocks appears to be bullish, similar to the situation for gold and silver. To be precise, the technical analysis based on miners’ charts is not as convincing as the signals seen in gold and silver charts featured earlier. Since it is unlikely that the mining stocks would move in the opposite direction of gold and silver, having a bullish outlook on gold and silver provides us with strong bullish case for miners as well. The miners’ charts simply support this analysis.
Junior Mining Stocks
As stated in the Key Principles section, the list of top juniors will be updated approximately every 4 weeks, so this is the Update that should contain the revised version of the lists.
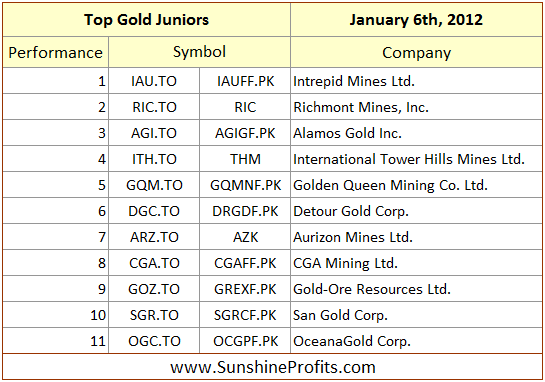
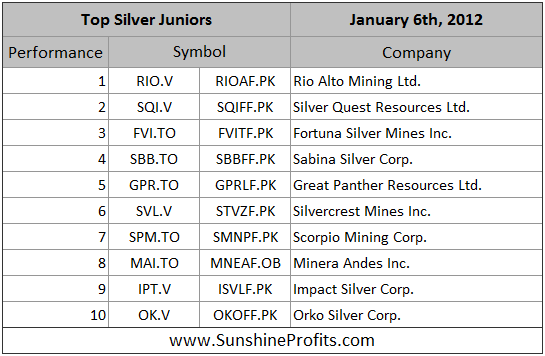
There are no major changes as far as our gold and silver junior selection is concerned.
In our gold list, based on the performance of the respective companies, we substituted Centamin Egypt Ltd. (CEE.TO) with San Gold Corp (SGR.TO) and OceanaGold Corp. (OGC.TO).
We also removed Trade Winds Ventures Inc. simply because it has been acquired by Detour Gold Corp (another company from our list).
Please note that we’ve recently written that we favor junior mining companies to big senior producers. The current bullish case for the general stock market makes us continue to believe that this is a good way to approach the mining sector. As you may see in the last 4 rows in this week’s Correlation Matrix, there is a very strong correlation between juniors and main stock indices – consequently, what’s bullish for stocks, is also bullish for juniors.
Letters from Subscribers
Q: Do you pay attention to the long term upward slope of the trendline for GLD going back to 2009? That trendline has been decisively broken to the downside, thus signaling an end to the bull market. In addition, there are near unanimous predictions for a rise in the price over the next year, and only a tiny minority that says otherwise. Is the crowd going to be right this time
There is also a very large descending right triangle topping formation which indicates a possible $350 - $400 drop below the low point recently reached. Does this concern you?
A: Actually, we pay attention to this particular line and we commented on it two weeks ago. We wrote the following and it is still valid:
Much has been written recently about gold's breakdown below the rising support line. Some analysts talk about gold's bull market being over because of that. The above chart should provide you with enough proof to deny this theory. First of all, technical analysis is not something that can determine if a bull market is to continue or not. Yes, it is very useful when identifying tops, bottoms and likely price paths, but when it comes to analyzing the very long-term tendencies, we need to consider the fundamental and macroeconomic facts. Were any of the world's economic and political issues resolved recently? No, Europe just bought some time, and nothing else changed. Nothing changed regarding the US debt situation, trade and currency ‘tensions’ with China, etc. The fundamental reasons that are responsible for this bull market's existence are still in place.
But, is the technical picture for gold really bearish? No, it's not, and the above chart has been created to prove it. One of the reasons is described right on the chart - gold quite often consolidates in a way similar to what we've seen in the past months. We're not in uncharted waters - we're seeing a quite common pattern in play. However, the most important point - something that deals directly with the breakdown mentioned in the previous paragraph - is not described on the chart at all.
The key action that one should take before applying any trading technique is to check if it at least worked in the past. At this moment, you might want to take a few seconds and check the bearish gold analyses that you've read recently which include charts that cover the 10-year or at least a 5-year time frame. Anyway, this is not the first time that we're seeing a breakdown below a rising medium-term support line. We have marked the current support with a gray, dotted line. Other gray lines represent analogous lines in the past - ones that were viewed as key support some time ago. Please take a few moments to examine them and to check what followed the previous ‘breakdowns’.
What followed was not a plunge that erased the whole bull market. It was not a prolonged consolidation either. The fact is that similar ‘breakdowns’ (in all cases seen on the chart) have been followed by the final bottom of the consolidation (not too far below the line that is has broken), which was in turn followed by a strong rally. In these cases, lower prices were never seen thereafter.
Consequently, from both fundamental and technical perspectives, gold remains in a bull market, and what we're seeing right now may be the best buying opportunity that we'll see in the coming years.
The above also covers the descending triangle issue.
As far as the crowd being bullish on gold - we disagree that this is really the case. Those who are bullish are not the investing public, but rather experienced analysts that specialize in the field of precious metals. If you consider popular media, the main press reports on gold are quite bearish. We’ve seen “Soros says gold is on the brink of a bear market,” “gold is over, diamonds are forever,” and similar headlines and we have personally been asked if we are still in a bull market by people who we considered to be believers in the gold/silver story.
Summary
Based on the analysis of volume, the situation in the general stock market has improved this week, but the implications for precious metals are somewhat unclear in the short term. As we stated in last week’s Premium Update: The situation in the USD Index is more bearish than not. With the closest support line more than 4% below the current index level trading range, a move to the downside may be quite significant. The outlook for the general stock market, however, is more bullish than not.
We believe that the medium-term consolidation period for the precious metals is likely over and higher prices could be seen soon (despite today's $10 decline in gold). It seems that quite a few markets have put in major bottoms recently. This is confirmed by the long-term gold picture, very long-term silver cycles and several other factors.
It seems that long positions in precious metals, both investment-based and speculative appear justified at this time. The upside potential appears to far outweigh the limited downside risks in most markets this week.
This completes this week’s Premium Update. Our next Premium Update is scheduled for Friday, January 13, 2012.
Thank you for using the Premium Service. Have a profitable week and a great weekend!
Przemyslaw Radomski

