
This is one of those weeks where it is truly difficult to know where to begin. This is August. Nothing is supposed to happen in August. But this week gold shot up when markets plummeted, and gold shot up when markets soared. It was one of those weeks when gold could do no wrong. Those of you who followed our suggestion in Monday’s Market Alert to open a speculative long position in gold with the target at $1,800 made some nice profits.
Do we begin with the downgrade by Standard & Poor rating agency of the U.S. that took place only last Friday but already seems like old news? (Like Jon Stewart said, you’d think that we would not take so seriously a company whose name literally translates to Average & Below Average.) The Democrats are calling it — the “Tea Party downgrade,” hoping blame for the fiasco will stick to the Republicans. Nobel Prize winning economist Paul Krugman, writing in his weekly column in the New York Times, called the downgrade “chutzpah.”
“If there’s a single word that best describes the rating agency’s decision to downgrade America, it’s chutzpah — traditionally defined by the example of the young man who kills his parents, then pleads for mercy because he’s an orphan.”
He says S&P and its sister rating agencies are largely responsible for the budget deficit in the first place since they are the ones that gave AAA ratings to mortgage-backed assets that later turned out to be toxic waste. “Nor did the bad judgment stop there. Notoriously, S& P gave Lehman Brothers, whose collapse triggered a global panic, an A rating right up to the month of its demise.”
It gets even better.
Krugman brings up the point that before downgrading U.S. debt, S&P sent a preliminary draft of its press release to the U.S. Treasury where officials spotted a $2 trillion error in S&P’s calculations. S&P conceded that it was wrong but downgraded America anyway.
“The episode hardly inspires confidence in S&P’s judgment,” writes Krugman and we tend to agree. Does anyone rate the rating agencies? We can’t help but think how quickly concepts set in stone can become unhinged. It was not so long ago when it was deemed unthinkable that America could lose its AAA.
Nonetheless, the above-mentioned error doesn’t mean that the U.S. is in a really good shape – it’s not and right now S&P is fighting for its own honor after ridiculously high ratings of money-losing financial institutions in 2008.
Perhaps we need to talk about the subsequent Wall Street bloodbath that took place on Monday when the Dow Jones industrial average fell 5.6 percent on the heels of a 5.75 percent drop the previous week. All this happened while President Obama was giving a televised speech to calm the markets. (It brings to mind Nero fiddling while Rome burns.) On Monday gold prices soared above the $1,700-an-ounce barrier and it was only three weeks ago when we were giddy about gold having crossed the $1,600-an-ounce barrier.
If ever there was a time in Washington for the three Rs, -- remorse, repentance and regret-- it should have been that Monday after the embarrassing downgrading of the nation’s credit rating. Poll numbers showed public support for Congress at record low of 14 percent.
Then we get to Tuesday when markets rallied with the Dow Jones industrial average up almost 430 points. The interesting thing is that gold prices continued to climb hitting yet another record slicing through the $1,750 milestone. Gold’s gains seem incongruous with huge market upsurge when normally gold tends to decline. However, this was after the Federal Reserve announced that it would keep interest rates low through mid-2013 in order to help the U.S. economy. Gold, which doesn’t pay dividends or interest and costs money to store, becomes more attractive when interest rates are low making Treasuries less attractive. Actually, with negative real interest rates, gold becomes the only sure bet there is (except other precious metals), as bonds provide you with negative return.
However, all of Tuesday’s gains were wiped out on Wednesday when at the end of trading, the Dow was down 520 points, or 4.6 percent, and the Standard & Poor’s 500-stock index was off 4.4 percent. Now it was worries about European banks that caused a frigid wind to blow on both sides of the Atlantic. But again gold was unstoppable. Gold futures rose to a record gaining $45.80, or 2.7 % to $1789 an ounce, benefiting from the U.S. Federal Reserve's decision to keep ultra-low interest rates. Again, was it only three weeks ago that we were giddy about gold having passed the $1,600 mark, and here we with gold having nicked the $1,800 mark? Pinch us.
Events have been moving so quickly recently that one can barely catch one’s breath.
And we haven’t even yet gotten to this week’s story that stayed under the radar of most media. As we wrote in Wednesday’s Market Alert, this week gold became more expensive than platinum, something that has happened only a few times during the previous 20 years. It was only as recently as July 1st that platinum held a premium of more than $200 over gold. On that day, October gold hit a six-week low of $1,479.60. Platinum, at its weakest point that day, was $1,704.70.
Each time after the price was gold jumped past the price of platinum, platinum would move substantially higher relative to gold. While this is no proof that this will happen again, we believe that it is very likely. Platinum typically is more expensive to extract from the ground than gold. The average platinum cost is in the neighborhood of $1,200 to $1,300, while gold is around $900 to $1,000.
As we told you in the Alert, Platinum is much more of an industrial metal specifically in catalytic converters in motor vehicles, and since 2008 it has followed the main stock indices.
We wrote:
Now, what's particularly important is that in the past the platinum:gold ratio used to bottom at one of the local bottoms during a decline in stocks without waiting for the final bottom in stocks. For instance, back in 2008-2009 time frame, the platinum:gold ratio bottomed in late 2008 while stocks continued their decline and bottomed in early 2009. We are not certain whether this is the final bottom for this decline for the general stock market, but it's most likely at least a local one. In the case of the gold:platinum ratio, that's all the information we need - so, in a way, this ratio allows us to take advantage of the bottom without knowing for sure if it's the final one or not.
Based on previous moves in the ratio, we expect platinum to become 10%-50% more expensive than gold in the following months or years.
In other words, we believe that it's a good idea to move half of your long-term gold investments into platinum. While we don't recommend using ETFs for long-term holdings, if that's a way that like to proceed, you could use the PPLT ETF.
We will get back to this topic in the following part of the update.
Did we mention that nothing is supposed to happen in August? This is the month that the “sell in May and go away” crowd heads out to the beach or the mountains. Someone should tell that to British Prime Minister David Cameron who had to cut his vacation short to deal with the riots spreading in the UK.
Just for your information, history shows that August is not all suntan lotion and poolside cocktails. It was in early August of 1914 that World War I broke out and twenty-five years later, in August 1939, the Molotov-Ribbentrop pact between the Soviet Union and Nazi Germany was announced. On the night of August 31, Adolf Hitler ordered the German army to attack Poland. In August of 1945 The U.S. dropped an atomic bomb on Nagasaki. The United States entered the Vietnam War, authorized by the Gulf of Tonkin Resolution in August of 1964. The Prague Spring in Czechoslovakia was crushed when the Soviet Union and its Warsaw Pact allies invaded in August 1968. In August 1990, Saddam Hussein’s Iraq invaded Kuwait precipitating the first Gulf war. A year later, in August 1991, a coup was under way in the Soviet Union and within days, the Soviet Union begun to break up.
And if you think bad things happened in August only in the modern era, we need only point out that August 28th, 476 was the last day of the Roman Empire. Perhaps T.S. Elliot got it wrong and it is not April that is the cruelest month, but rather August.
Given events such as these, we hope that the rest of August will prove to be calm. If you are reading this by the pool, or in your mountain getaway, we will now take you to this week's technical part. We will start with analysis of the US Dollar Index (charts courtesy by http://stockcharts.com.)
USD Index
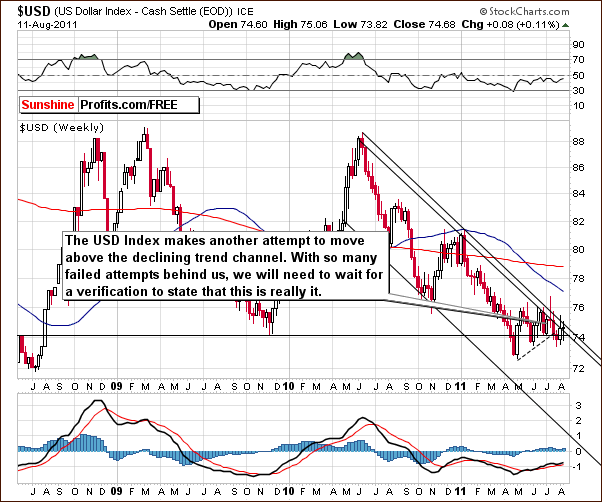
This week’s currency section contains only a single chart as the developments have been fairly insignificant in both the Euro Index and the USD Index. The back-and-forth price movement seen recently in both indices has continued throughout the current week. No decisive moves in either direction have been seen. At this time, it seems best to wait until the situation plays out further and a rally or decline becomes more evident before attempting to analyze the impact of the currency markets. No clear signals are seen at this time, so the jury seems to still be out as to what will happen next.
General Stock Market
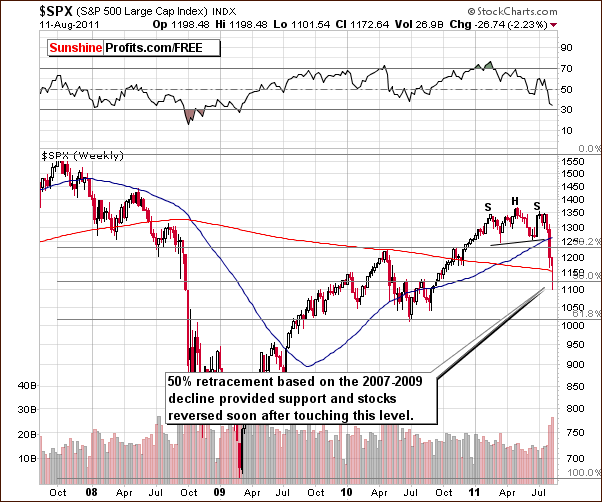
In the long-term S&P 500 Index chart, we see that this week’s move in stock prices has been quite profound and certainly the biggest decline of the current year. It was indeed significant and touched a few important support lines. The long-term 50% Fibonacci retracement level (based on the 2007-9 decline) was touched and provided support as stocks reversed soon after move below this level. The quick reversal created a weekly candlestick pattern, which looks like a bullish hammer reversal pattern. This was also accompanied by strong volume and confirms the bullishness of the candlestick. Naturally, the week did not end yet, but the odds are that the pattern will hold.
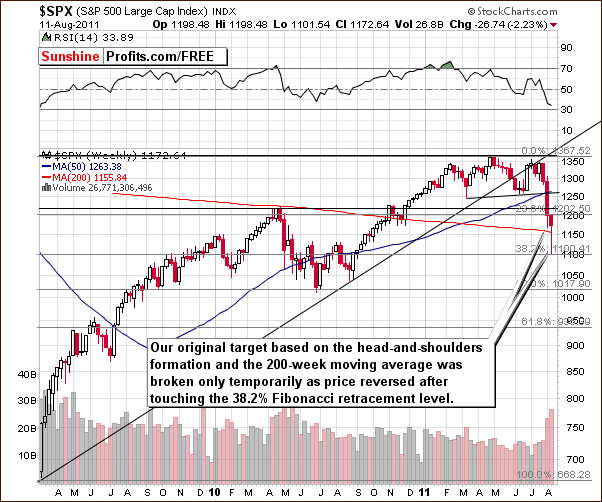
In the medium-term S&P 500 Index chart this week, we see that the 38.2% Fibonacci retracement level, based on the 2009-2011 rally was touched. This coincided with our original target based on the 200-week moving average and the head-and-shoulders pattern. At this point, the situation looks quite favorable for stocks.
Although, the general analysis of sentiment across the financial news portals has recently been scary and very pessimistic, the pundits declare, often in the same breath, that Warren Buffet is buying. So given the latter, is it more likely we are at a local top or local bottom? Surely Mr. Buffet is known for buying low (when others are selling), not high and it therefore seems probable that we are close to or at a local bottom. The situation could be similar to what was seen last year (April-May) when stocks declined, moved back and forth a and then moved slightly lower before bottoming and beginning a significant five to six month rally.
Summing up, the situation for stocks in general looks bullish in the short term based on the price volume action seen this week. The medium term, at this point, is somewhat unclear but the long-term outlook for the general stock market is bullish in nominal terms based on the low interest rates, which appear to be set for the next 24 months.
Correlation Matrix
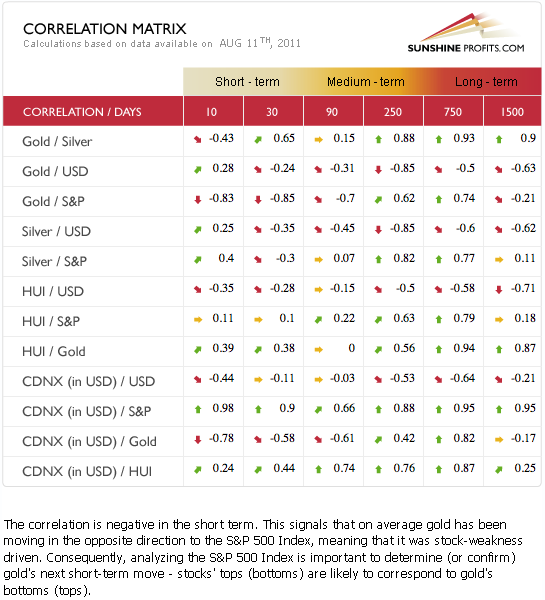
In this week’s Correlation Matrix, we see a very interesting phenomenon in that gold and silver are negatively correlated over the past 10 trading days. What this means is that their prices have moved in opposite directions. Silver’s price declined while gold’s price moved higher within the past 2 weeks.
As we stated in Monday’s Market Alert:
Silver and mining stocks move up but they lag gold - not necessarily on a daily basis, but any quick corrections would likely be bigger in silver and miners than in gold. For instance, if gold moves higher, we could see silver and miners move 1.5 times as high, but when it corrects, we could see 5x more severe correction in silver and metals. These multipliers are just examples to illustrate the point which is that gold has better upside potential than silver and miners right now.
Gold and the general stock market have a significant negative correlation in both the 30-day and 90-day columns. Therefore, if stocks rally, gold prices are likely to decline. Based on this and the bullish sentiment discussed previously for stocks, lower gold prices appear more likely than not for the near term.
Silver and gold mining stocks currently have a very weak correlation with stocks in the 30-day column. The same holds true for gold with the gold mining stocks. This contributes to the lack of clarity seen presently for silver and mining stocks.
Historically, gold has been much more important to silver and to gold mining stocks than the general stock market has been. At this time, it appears that the situation is more bearish than not for silver and for the mining stocks.
Gold
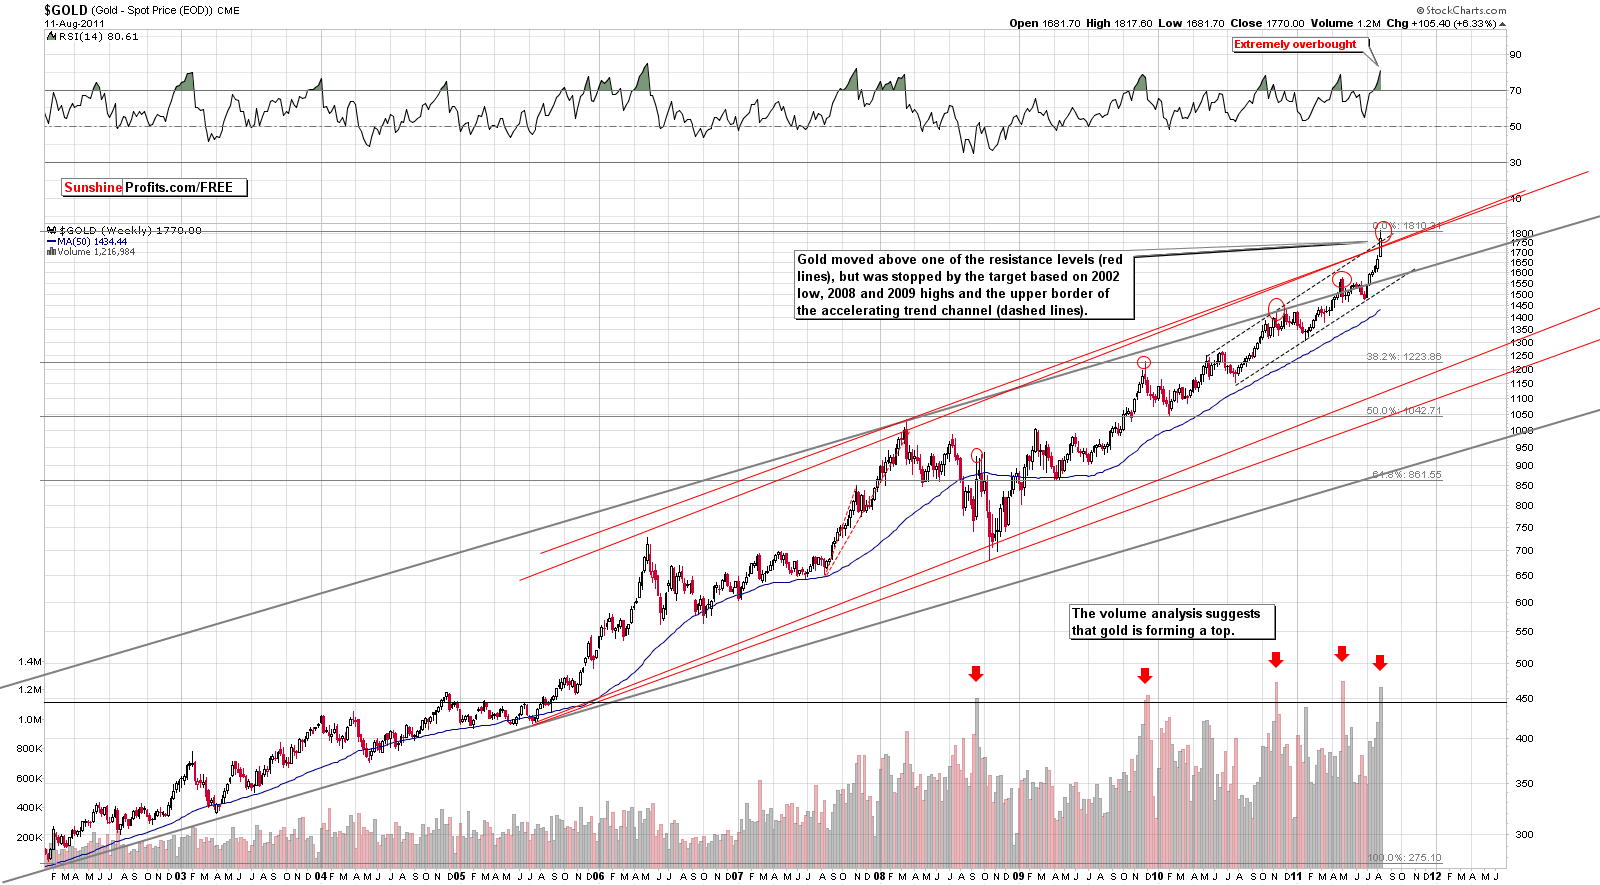
In this week’s very long-term chart for gold (click the above chart to enlarge), the current week’s incredible ride is clearly visible even from the very long-term perspective. Because of the size of the rally, it is critical that we view it from a proper perspective and clearly the very long-term chart is invaluable for this purpose. It allows us to properly analyze this week’s important developments.
It is of great importance that we note the resistance levels which are now very much in play. The red line in our chart represents the long-term rising trend channel and gold’s price has broken above this level but the move has not been confirmed at this time. In fact, gold’s price appears now to be reversing back to the trend channel once again.
The resistance level created by the 2002 low and the highs of 2008 and 2009 (these highs and lows have been extrapolated with the use of the Phi 1.618 number), and the upper border of the accelerating trend channel (dashed lines in chart) stopped the recent price rise of gold slightly above the $1,800 level. Gold’s price is now close to the upper border of this smaller accelerated trend channel and a resistance level therefore is in play.
The current RSI level indicates an extremely overbought situation and, in the past, this has usually been followed by a decline in gold’s price. Weekly volume levels are also giving a similar signal and this week’s volume is already well above the normal total weekly volume range – even though the week did not end yet. This has often coincided with local tops in the past. Normally, a quick downturn usually follows. It does seem that we are now at a local top for gold or very close to it.
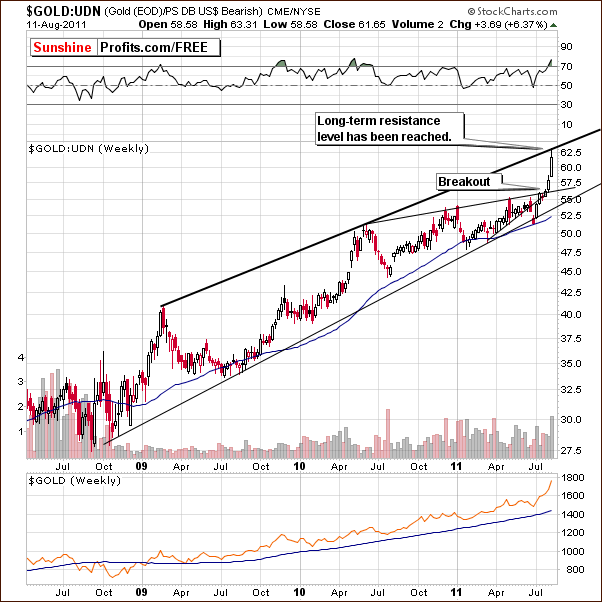
In this week’s long-term chart for gold from a non-USD perspective, we have a confirmation of points made previously. The non-USD price index for gold has moved to a strong resistance level after breaking out last week. In addition, the RSI level here is also in an overbought range and this has normally indicated a sell signal in the past.
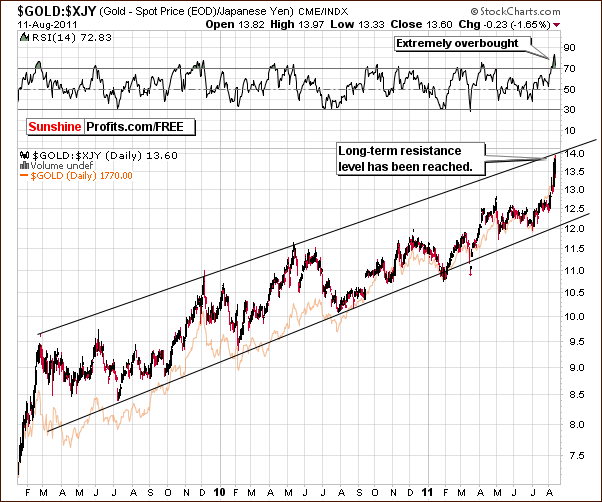
Looking at gold from the perspective of the Japanese yen, once again we have an overbought situation based on the RSI level and a long-term resistance level also in play. In this chart as well, a local top appears to be upon us. It is important to note that when multiple perspectives all point to the same general outlook, it greatly increases the odds of the outlook being right on.
On a side note, the reason that we feature the Japanese yen separately is that gold viewed from this perspective is particularly different than from other non-USD perspectives.
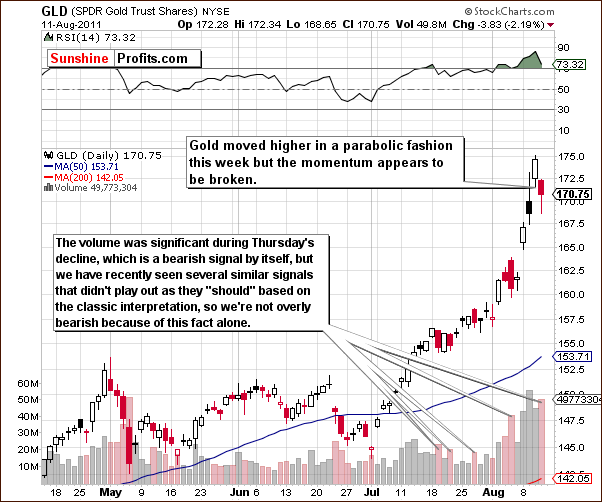
In this week’s short-term GLD ETF chart, the situation is not nearly as clear mainly because the recent moves have been so huge. It does appear that gold’s momentum has been broken as prices declined with significant volume levels on Thursday. However, in our opinion the situation is not overly bearish from this short-term perspective. In the past, similar signals would often lead Investors in the wrong direction, so it is important to use numerous tools before drawing conclusions upon which to act.
Summing up, the analysis of volume levels does not give significant details this week from a short-term perspective. The weekly volume levels seen in the long-term charts, however, and analysis of RSI levels suggest that gold is overbought. This is true from a non-USD perspective as well as from the dollar side. Furthermore, the overbought situation comes at a time when price levels are at or near very strong long-term resistance lines. It does appear that we are quite close to a local top and long positions in gold at this point seem very risky at least for the short-term.
Silver
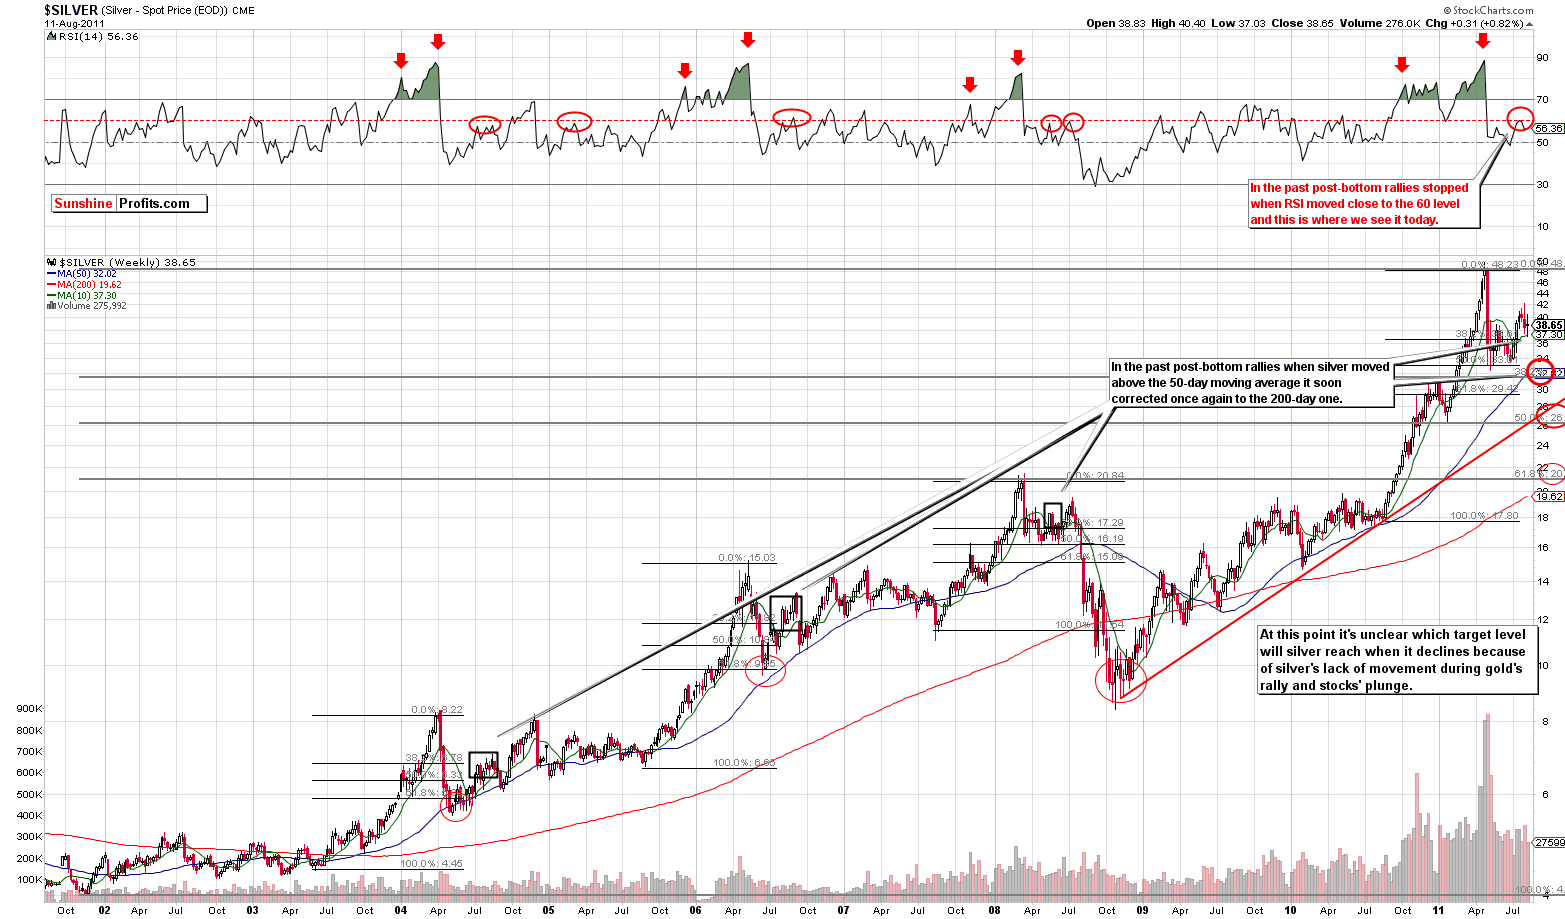
In this week’s long-term chart for silver (please click the above chart to enlarge), we have a rather bearish indication from the RSI levels but the situation is unclear as far as a target for the possible decline is concerned. Three possible target levels are still valid. The first is around the $32 level and appears to be the most likely of the three. Less likely is the $26 to $28 range and the $21 range appears to be the least likely of all the target levels. These have been in place for some time now and discussed in previous weekly Premium Updates.
The situation is unclear mainly because silver did not follow gold or the general stock market this week. If both of these markets reverse, which one, if any, will silver follow? The situation is bearish but precise targets are difficult to estimate. We will wait to see how it begins to play out initially when gold starts to decline and adjust our analysis accordingly. As always, we will keep you informed as more details become available.
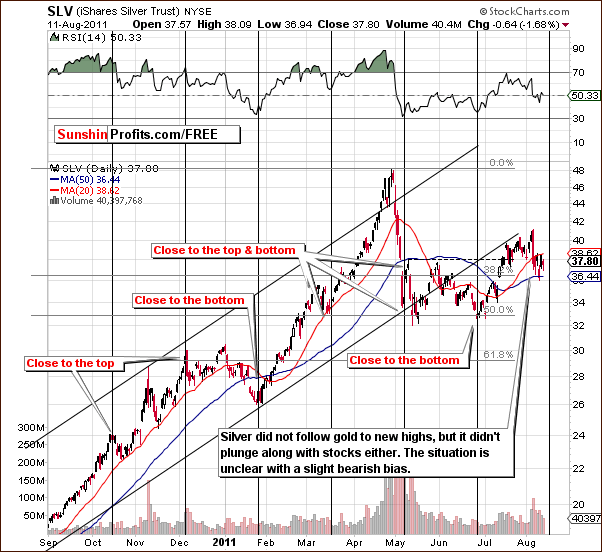
In the short-term SLV ETF chart this week, very little new information comes forth. Silver did not follow gold to new highs this week and the situation is quite unclear. The white metal is near a cyclical turning point and increased volatility is probable in the weeks ahead. If silver’s price declines from here, the local top was that which we saw early last week. An upwards move from here would obviously indicate that we have just seen the local bottom towards the end of the current week.
Summing up, we are likely to see increased volatility in silver. Based on the situation in gold, declines in silver’s price are more likely than not. It seems best at this time, however, to wait for a signal before suggesting a move towards opening speculative short positions in the white metal.
Gold and Silver Mining Stocks
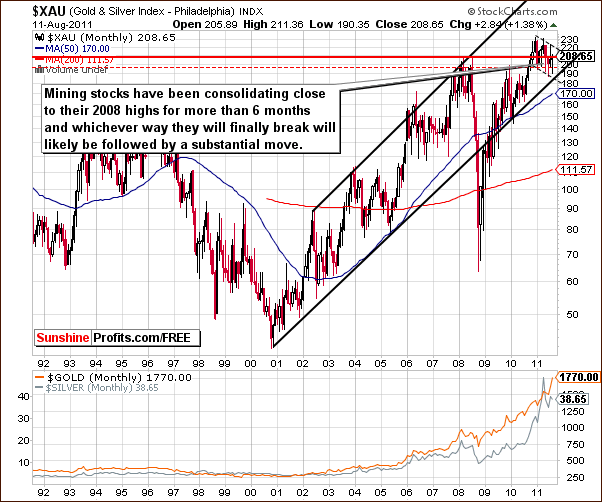
In the very long-term XAU gold and silver mining stocks index chart, very little has changed this week. The back and forth price action has continued within the consolidation patterns seen in recent weeks. Which way the gold and silver mining stocks move from here will likely determine their next big move but at this point, no clear signals have yet been identified.
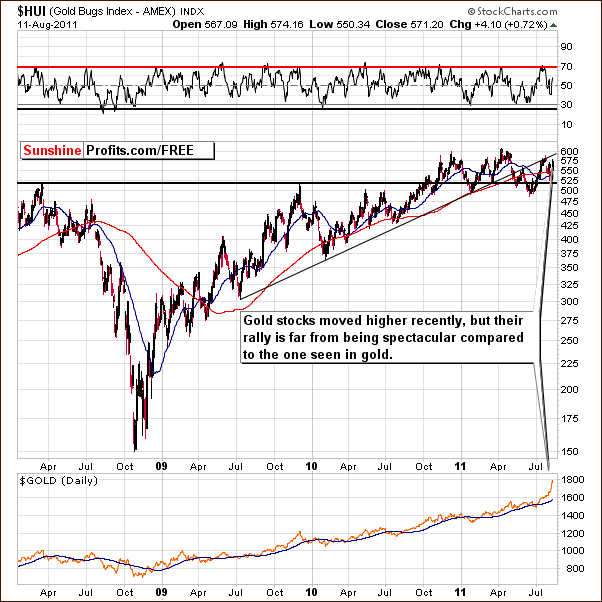
In this week’s long-term HUI Index chart, we see that gold stock prices moved higher in the past several days but their rally has been rather weak compared to that of gold. Based on the recent topping signal which has been seen in the gold market, it is likely that the gold mining stocks are catching up with gold right now (in this situation the gold mining stocks market may be perceived as a weak one, and the gold market as a leading one). This is a normal occurrence in the final part of a rally but is by no means a certainty. Whether or not the rally is ending right now remains somewhat unclear, as indicated earlier in the Correlation Matrix section.
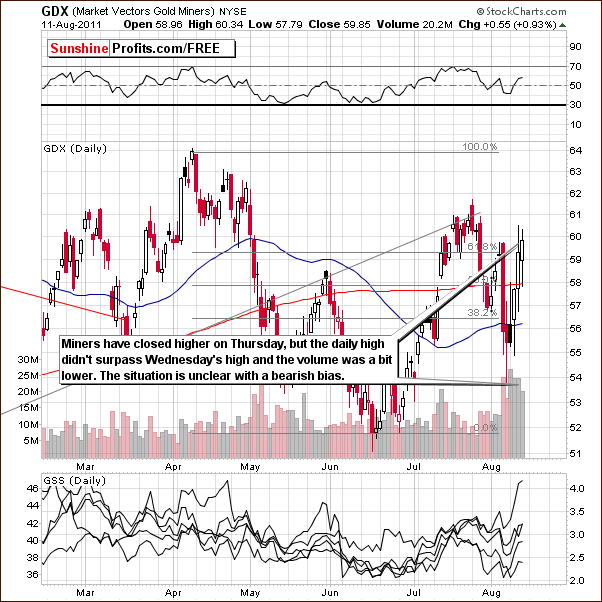
In this week’s short-term GDX ETF chart, the miners moved higher with respect to Thursday’s closing price level but the daily high has been lower than on Wednesday. Moreover, the volume levels were slightly lower on Thursday. This could be a small indication that the buying power could be drying up, though this is far from a certainty at this point. The situation is still somewhat mixed here.
Summing up, the tense situation in the gold market appears to be having an effect upon the gold and silver mining stocks. The exact influence, however, is still not clear at this point as a number of questions have arisen during the past week as we study the daily price action and volume levels. It seems best at this time to wait to see what happens next and, of course, we will continue to keep you informed.
Platinum
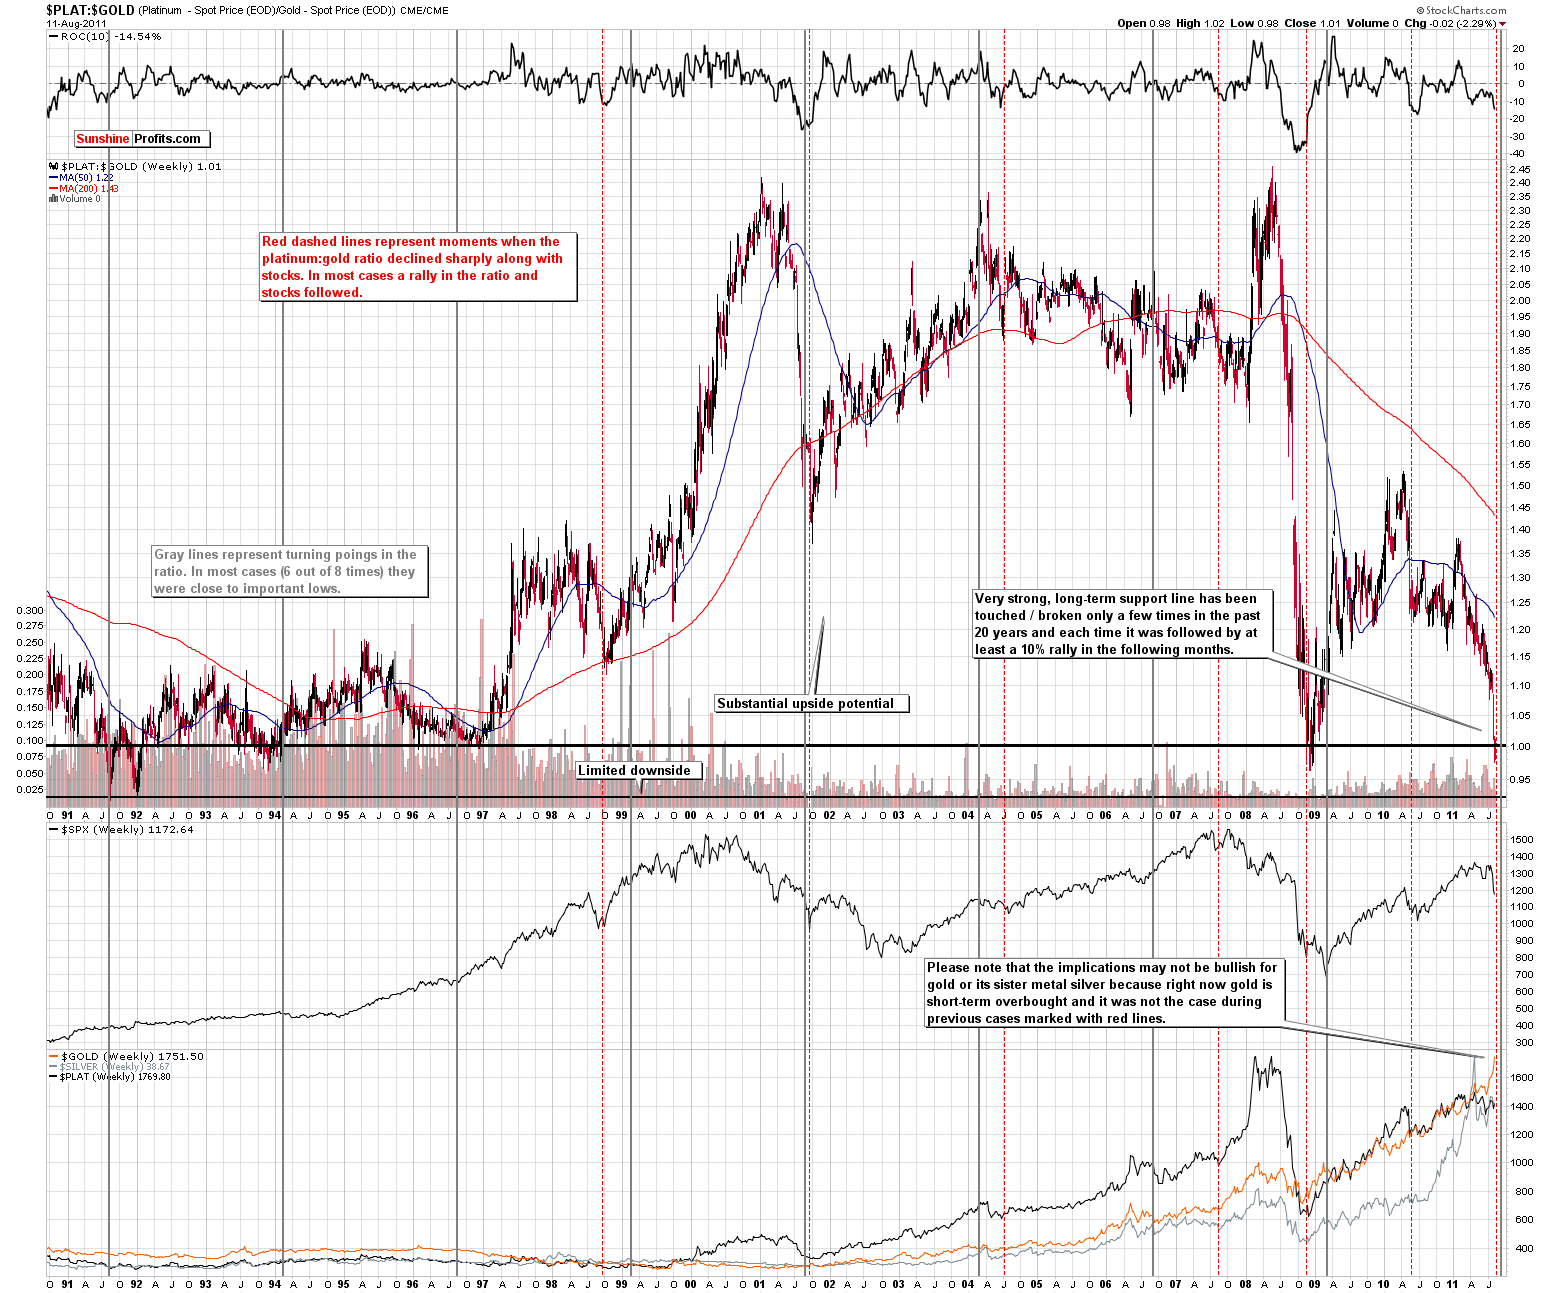
In this week’s platinum section, we begin with a look at the very long-term platinum to gold ratio chart (click the above chart to enlarge). Several important details are apparent this week. First, gold’s price recently moved higher than platinum and this has only been seen a few times in the past 20 years. Each time, the ratio moved to or below 1, it soon rallied by at least 10% meaning that platinum’s price, which is in the numerator of the ratio, moved quickly higher within a few months. It seems likely that what has been seen in the past could very well happen once again. A rally (even bigger than 10%) appears probable and it seems to be a good bet that platinum’s price will move higher soon.
The vertical gray lines represent cycles in platinum’s historical price patterns. Six of the eight of these were close to local bottoms and a rally soon followed in the ratio. We are about to hit this cycle now as the ratio is at a historical support line and a turnaround is therefore likely.
The recent decline in the platinum:gold ratio has been quite sharp as indicated by the ROC (rate of change) indicator. Similar (sharp declines) situations that took place along with sharp declines in stocks are marked with dotted red vertical lines.
The recent sharp decline in platinum has coincided with the sharp decline in the general stock market and it appears that both are at or near bottoms. Even if stocks move lower from here, it still seems that platinum will retain its upside potential relative to gold. Since a turnaround is likely in the price of platinum, it may be a good idea at this time to switch 50% of long-term holdings from gold to platinum (as suggested on Wednesday).
So what about the rest of the precious metals sector (besides gold and platinum)? In most cases, the red vertical lines on the chart above meant also higher prices for silver and mining stocks as well, but it is important to note that gold was generally not as overbought in these cases as we see today. So in short, the situation may not follow the normal path this time around. Therefore, the probability of platinum moving higher relative to gold is bigger than the analogous probability for silver and mining stocks right now.
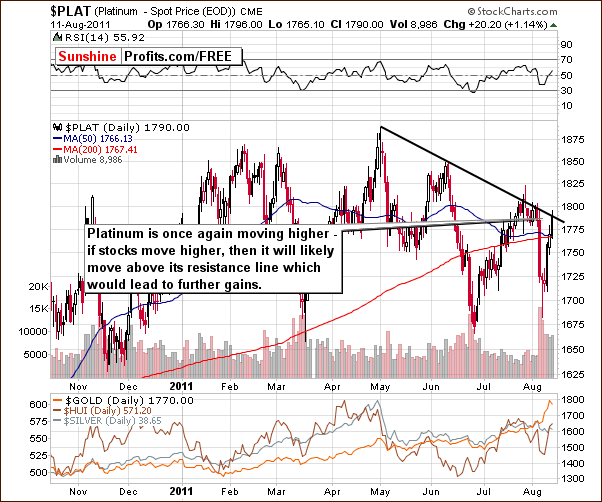
In this week’s platinum chart, we also see price levels at the declining resistance line. If the general stock market rallies, then a breakout and higher prices appear probable indeed for platinum.
Summing up, based on historical trends, the situation for platinum appears more bullish than that of gold at this time. It may be wise to move 50% of long-term holdings from gold to platinum. The upside potential here appears to be quite good.
30-year US Treasury Bonds
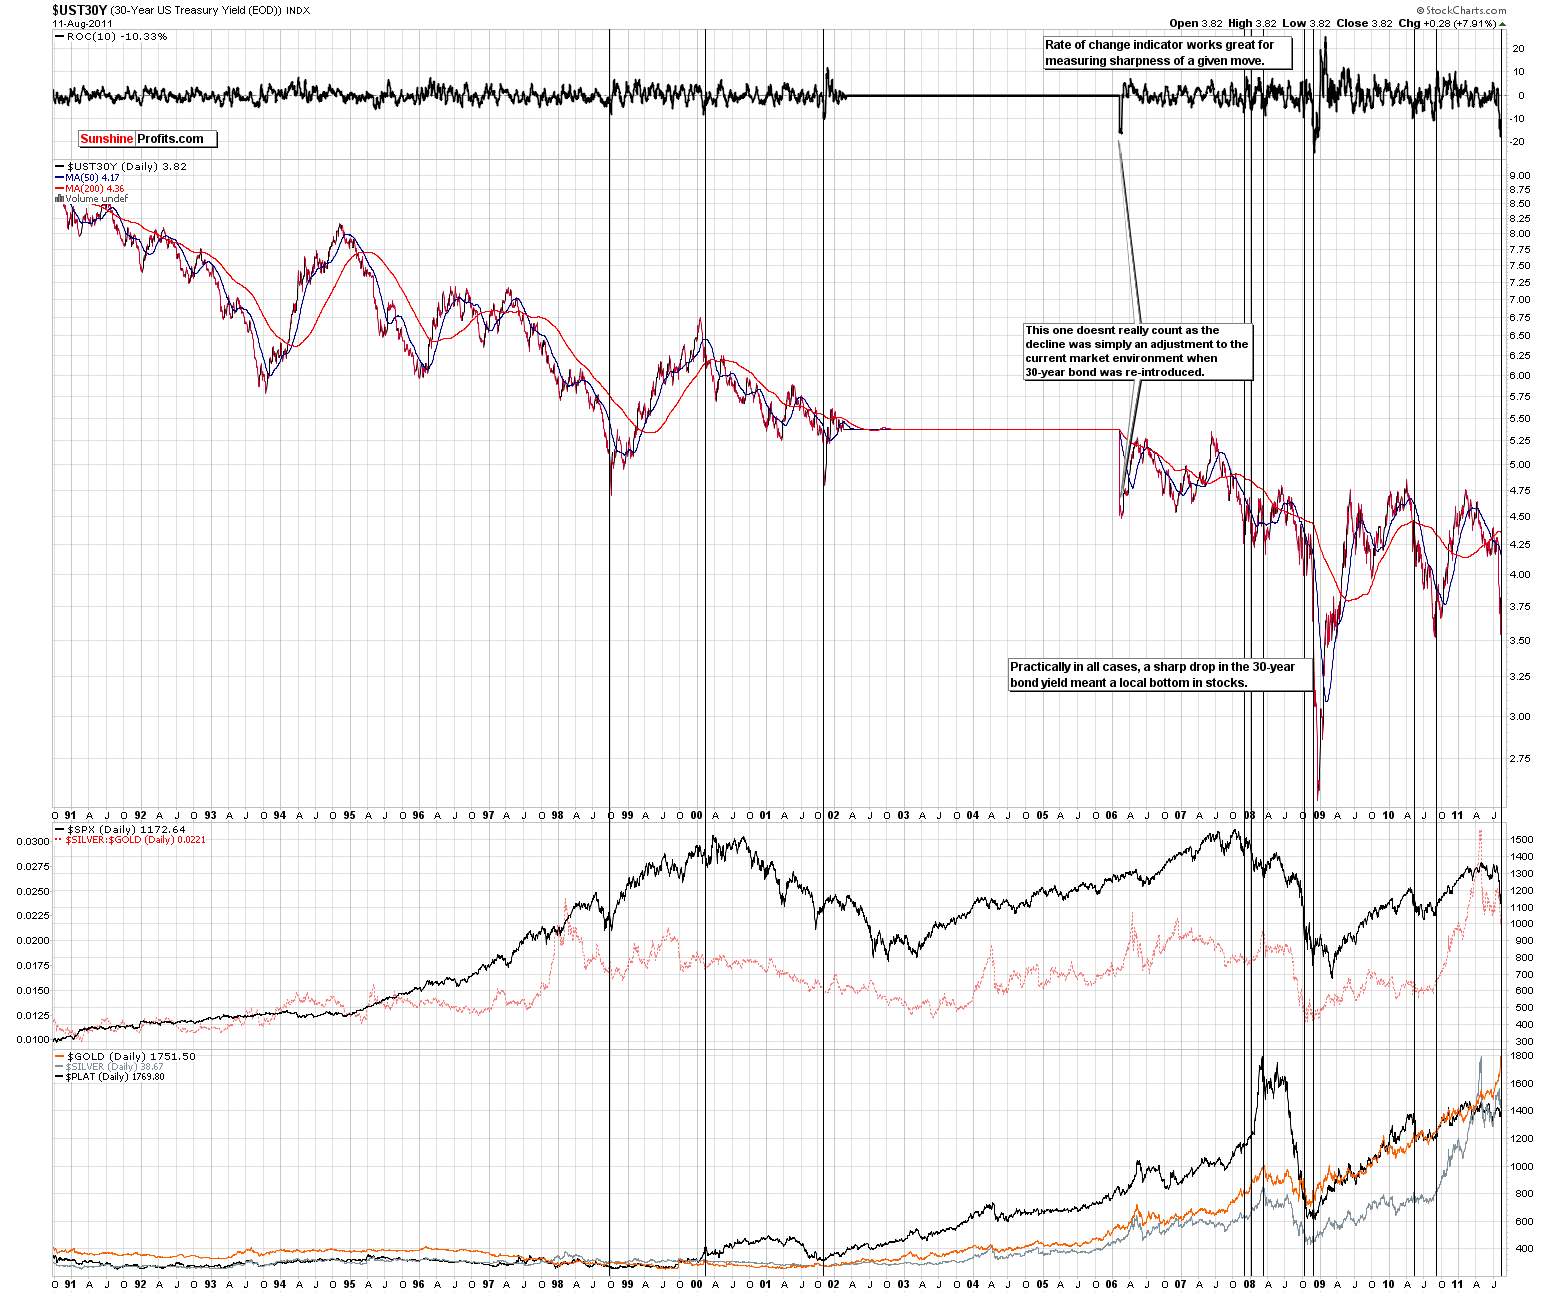
We’ve included the 30-year US Treasury bond yields chart (click the above chart to enlarge) this week as it provides important implications for the general stock market. The chart is an analysis of 30-year bond yields and was actually suggested by one of our Subscribers. It is very interesting indeed! The sharp decline in the yield is clearly seen and with the US Fed promising to hold rates near zero for 2 more years, the longer term bond yields have declined and declined sharply.
Comparing this to what has happened to the general stock market in the past (not only in the last couple of years), it seems that with the sharp plunge in yields, the odds of a turnaround in stocks are greatly increased. In the past, the implications were generally bullish for the precious metals as well. However this was usually under the condition that the precious metals were at the end of a consolidation period and not at the end of a short-term parabolic rally (which seems to be the case for gold right now). Therefore, the impact upon the precious metals sector is presently not quite as clear. This was also discussed in our Correlation Matrix section.
Summing up, the 30-year bond yield picture has mainly bullish implications for stocks in general. The possible impact on precious metals is not clear.
Letters from Subscribers
Q: Is it better to buy gold from BullionVault.com or better to buy "paper" gold through normal banks?
A: Yes, we believe that it's a better option than "paper" gold through normal banks.
Q: I know of two companies that mine for Platinum--PAL and SWC. Are these companies good to invest in? Do you have others that you would recommend more?
A: There is also AAUKY.PK that's big enough to be considered suitable for long-term investments. However, in our view, physical platinum is preferred to platinum stocks right now. Platinum stocks were hit badly during this decline in the general stock market, while platinum didn't fall deeply. This suggests that we may have a similar situation in platinum as we have in gold right now - and gold moved hundreds of dollars higher recently and mining stocks didn't do much.
Q: I assume that you do not mean for us to exchange our gold bullion for platinum, but would like confirmation on this. Do you meant that we should consider moving half of our gold stocks (and ETFs, etc.) to platinum, right?
A: Different investors have different portfolio structures, but it seems that the following would be appropriate for most. Estimate how much long-term gold investments you have including gold, gold etfs, gold stocks etc. and sell half to purchase platinum. Don’t take into consideration gold held as insurance against the collapse of the financial system - don't touch this part.
Q: Thanks for increased attention during these crazy times! Could you please elaborated more on the "switch half your long-term holdings to Platinum?" This is a new angle for Sunshine Profits. Since platinum tends to mirror the indices more than gold... are you really that bullish on markets in the long term and what other vehicles do you suggest for purchasing platinum since you do not seem to like the ETF's?
A: In the long term we're bullish on stocks, but please note that only in nominal terms. This means that we don't think that stocks will be able to keep up with gold and the rest of the precious metals sector, but think that The Powers That Be will do a lot to avoid seeing a true bear market in stocks, especially after they have invested so much effort in the monetary stimulus. Low interest rates are positive environment for stocks, and since we were just assured that they will stay low for at least 2 more years, we think investors will take advantage of that.
So, we wouldn't call ourselves truly bullish on stocks - yes, we think they will move higher in nominal terms, but we believe that precious metals area far better investment.
The point that we were trying to make in our latest Market Alert is that the pessimism regarding stocks has become extreme and the opposite was case for gold - and it usually pays off to be contrarians in moments like that. Moreover, since we can achieve this goal by staying in the precious metals sector - only by switching from gold to platinum, then the most profitable action appeared clear.
Actually, we were pondering making a transition from gold to platinum in late 2008, but we were not absolutely convinced at the time and did not suggest this to our Subscribers. It turned out that we should have done so. This time, the situation is very similar, except that now gold is very overbought on a short-term basis, which makes this switch an even better idea.
As far as the issue of what is the preferred way of owning platinum, the situation is analogous to gold. Physical is best, then there are allocated accounts (also ok), then there's the rest, like unallocated accounts, unbacked certificates and so on (not ok).
You will find out more in the section dedicated to physical bullion.
Q: What about the continued weakness of mining stocks?
A: As we explained previously there are reasons for miners' underperformance even without taking the manipulation theory into account. Each stock's share prices are ultimately driven by a company's earnings power. In other words, the sustainable net income a company generates per share, the bigger the price of this share. Profits are not only drive by revenues but also by costs. If costs rise, then profits may not rise even despite an increase in revenues.
In case of mining stocks we need to consider not only the price of metal that a given company produces, but also this company's costs. Since a big share of company's costs is related to the price of crude oil (the most versatile commodity), we need to take into account its price. With oil around $100 and expectations of higher prices investors discount this i and project lower profits. Thus, the share price does not increase as one would expect it to - based on the gold price alone.
Summary
In the currency markets, the situation is mixed and will remain so until a breakout is seen in either the Euro Index or the USD Index. There was basically no excitement here this week as the recent back-and-forth movements continued in both indices. The influence of the currency markets on the precious metals sector is also mixed at this time.
The general stock market appears to be poised for a rally in the short term. The medium-term picture is unclear at this time as there is some uncertainty as to whether the local bottom is in. For the long term, the sentiment is bullish based on the low interest rates currently in place and destined to remain so. Long-term bullish is however in nominal terms.
There’s a way to take advantage of this situation without leaving the precious metals sector and it means switching half of long-term holdings from gold to platinum – and it appears a good idea to do so.
The correlation between markets this week is most significant between gold and stocks in a negative way. If stocks move higher, gold prices are likely to decline and it seems that gold may have already formed its local top. Several signals in this week’s gold chart indicate this to be the case. Most notably, resistance levels have been reached in both the non-USD and USD perspectives. Gold is making headlines and investors’ sentiment is very positive. This is something that we see around tops, not bottom. Moreover, the margins were just raised for gold futures and while it is not a decisive bearish factor, please note that in case of silver, such a move took place right at the top in early May earlier this year – a powerful decline followed.
Moving on to silver and mining stocks - gold prices recently rose as stock prices declined and it seems best to wait and see which market will lead silver and the gold and silver mining stocks. If they follow gold, prices will likely decline and higher prices are probable if they follow the general stock market. For the time being, it seems that they are more likely to follow gold lower.
As far as speculative transactions are concerned, at this time, we prefer to wait for a confirmation of gold reaching a top before suggesting opening short positions in the precious metals sector. As always, we will keep you informed as further details emerge.
Our next Premium Update is scheduled for Friday, August 19, 2011.
This completes this week's Premium Update.
Thank you for using the Premium Service. Have a great weekend and a profitable week!
Sincerely,
Przemyslaw Radomski

