
We've entered summer, a typically slow season for the metals, which is why they call it the summer doldrums. Despite that, precious metals moved higher Tuesday, Wednesday and Thursday. We said in Wednesday’s Market Alert that we would need to see hard technical evidence before we would be willing to say that this decline is really over. Gold's low so far this summer has been $1,498, a drop of 2.7% and barely more than the smallest historic summer decline in this current decade-long bull market.
Gold closedJune just 1.8% lower than it first started. Just for your information, the average summer drop over the last ten years was 8.6%, which at current levels would bring us to $1,407.53. It is also interesting to note that the summer lows have usually represented the bottom of the market for the remainder of the year, with one major exception, which was the difficult-to-forget year of 2008, which was when the summer decline was merely a harbinger of nasty things to come.
Summer is a good time to travel, so this week we will take you on a brief tour around the world to see what is happening with gold. We save the best for last.
Central African Republic: This landlocked and sparsely populated country, ranked among the 10 poorest countries in the world, could well be one of the world's leading exporters of gold in the near future. While international mining companies hope to establish operations there soon, farmers are abandoning their fields and are flocking to the gold areas hoping for a lucky strike. We wish them luck. It would be nice to have the riches go to the hands of people in that area of the world instead of corrupt governments.
Greece: One of the first things any person facing insolvency does is to sell the family silver and pay back debts. Apparently, that does not hold true for governments. Greece holds an impressive 125 tons of gold in the vaults of the Greek National Bank, worth approximately 4 billion euros. If Athens were to sell that gold, its government wouldbe able to meet at least part of the debt payments without any outside help. Portugal, another country teetering on the brink of crisis, holds an impressive 383 tons of gold with a market worth of about 13.3 billion euros. The Portuguese have just squeezed an 80-billion-euro aid package from the European Union. Of the 400 tons of gold allowed to be sold each year by central banks, according to the Central Bank Agreement, only53 tons have been soldso far during the present accounting period. About 52 tons came from the reserves of the International Monetary Fund. If central banks want to sell within the framework of the agreement, they are free to do so until September 26, when sales quotas expire. However, central banks around the world are doing just the opposite –they are stockpiling gold rather than selling it.
Iran: Iranians have a long history of buying gold coins for wedding gifts, or as a way to squirrel away savings. But recently, what was a steady demand has become a gold rush.
Instead of taking profits on the rise of gold prices, Iranians continued to buy them in ever larger numbers. The Iranian gold rush has been driven by fears about the domestic economy hit by sanctions against the country, lack of trust in the local paper currency and by fears about the global economy.
China: Silver demand in China is soaring. Silver imports have reached new highs, and analysts maintain that demand for this year will only continue to grow. The growth comes not only from industrial and jewelry demand, but also from the increased investments in silver as a hedge. Reports show that net silver imports to China have risen dramatically and will continue to do so going forward. In 2010, the net import of silver quadrupled, hitting a record of 3,500 tons. The pace of Chinese imports since the start of 2011 is still strong. Analysts see growing demand for silver in China, as well as India, rising by as much as 30% on the year. The increase in demand is also strong for Chinese silver ‘Panda’ coins, prompting the Peoples Bank of China to double the maximum issuance of coins for the year.
Great Britain: Britain's first gold dispensing vending machine made its debut this weekin west London. The Gold To Go machine, predictably gold in color, is manufactured by a German company. A computer inside the machine updates the price of gold every 10 minutes to reflect fluctuations in the world market. It sells bars and coins in various sizes, including, a special souvenir 2.5g bar with the London skyline engraved on its reverse. Shoppers pay up to 25 per cent above the spot price for the convenience. We reported in the past about the world’s first gold vending machine that opened last year in Abu Dhabi' and about another such machine in Las Vegas, so, if you travel to any of those places, take a photo and send it to us.
California: A Northern California gold mine that has been a tourist attraction for years could go back to mining as high gold prices boost the promise of profits. Sutter Gold Mining Inc. has lined up $20 million in financing to restart operations. If all goes as planned, mining could start next summer. The mine opened in 1989 to host tour groups. The owners say gold prices, topping $1,500 an ounce, make mining economically attractive again.
India: This is not an Indiana Jones summer blockbuster movie, but a true story. Precious stones, jewelry, gold and silver estimated to be worth several billion dollars have been found in the secret underground vaults of an ancient temple in southernIndia. An 18-foot-long necklace, 536 kilograms (1,179.2 pounds) of 18th century gold coins, diamond-studded plates, rubies and emeralds were found in the vaults of the Sri Padmanabhaswamy temple in Thiruvananthapuram, the capital ofKerala state. The vaults were opened for the first time in 135 years after the Supreme Court ordered the state government to take over the temple’s assets from a trust controlled by the royal family of Travancore. The temple, devoted to the Hindu god Vishnu, was built in the 16th century by the kings of Travancore. The descendants of the royal family had appealed to the Supreme Court against the petition for the takeover. Meanwhile the government has sent two dozen police officers to the previously unguarded shrine for round-the-clock security. India’s Supreme Court will decide what happens to the treasure. We’re waiting to see how this interesting story develops.
So, is the decline over? Let's begin this week's technical part with the analysis of the Euro Index. We will start with the long-term chart (charts courtesy by http://stockcharts.com
Euro - USD Indices
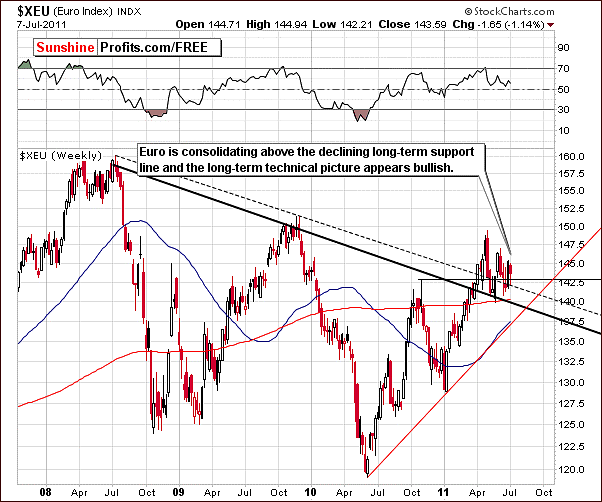
This is another week during which euro has consolidated above the declining support line and this consolidation could very well continue. The breakout appears to have been verified and the long-term picture appears bullish at this time. A move down to the 140 level is still not out of the question however. This would not invalidate the breakout above the key declining support line since the line is presently below 140 and moving lower.
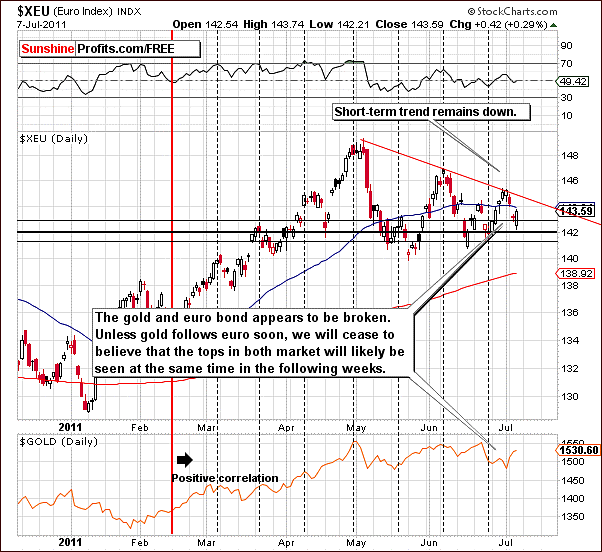
In this week’s short-term Euro Index chart, we see that the short-term trend appears to be down. The lower highs (recent highs being lower than the previous ones), which have been seen recently are a signal that the current decline is likely to continue in the near term.
The main point here is that gold appears to have stopped following the euro ever since the Greek Parliament approved the economic savings plan a couple of weeks ago. We will continue to monitor this situation since it may still be subject to change in the coming weeks.
It does appear that we have lost a previously reliable tool as the Euro Index is no longer useful in analyzing gold. Unless gold follows euro lower, we will stop utilizing the analogy and rely only on other tools.
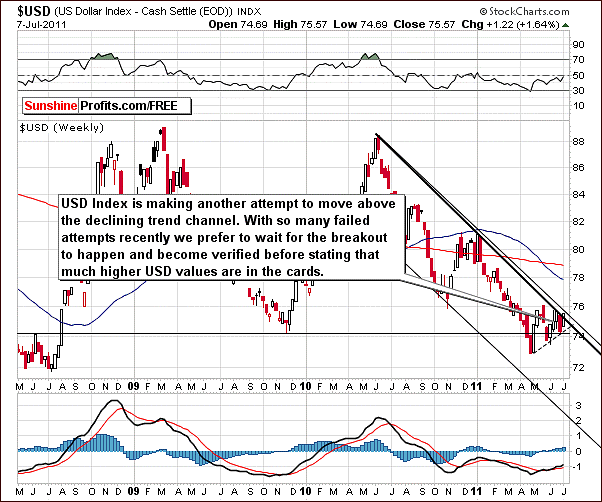
In this week’s long-term USD Index chart, we see another attempt to move above the decline trend channel. Previous attempts have, of course, been unsuccessful. We prefer at this time to take a conservative approach and wait for a breakout before calling the situation bullish. This appears only to be a possibility at this time and nothing more. The present situation is truly tense.
Summing up, the currency markets overall are presently in a tense situation. The euro appears to have a bullish long-term outlook but declines are likely in the short term. The dollar is at a crossroads and could either rally significantly fairly soon or see a significant decline within the same time frame. We will continue to monitor this in the days ahead.
General Stock Market
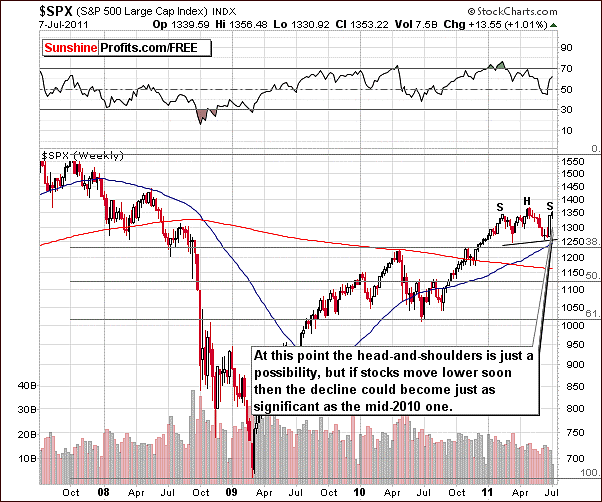
In the very long-term S&P 500 Index chart this week, we can see that the recent rally has indeed been significant. If stocks decline from here, the possibility of a bearish head-and-shoulders pattern developing will be quite likely. In this scenario it would be quite likely that a decline similar to what was seen in the middle of 2010 takes place. We will keep an eye on this situation as it develops further.
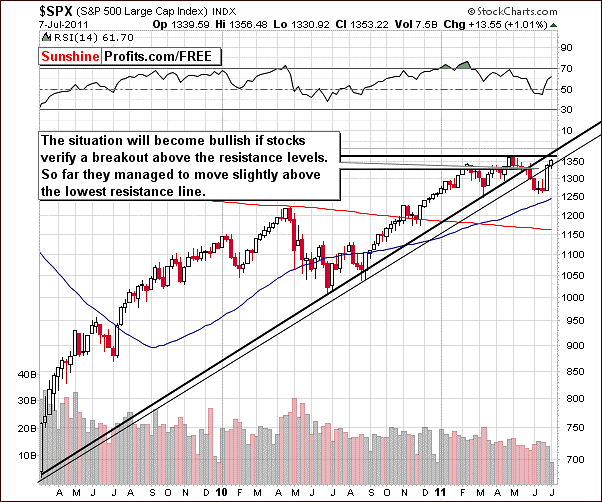
In the medium-term S&P 500 Index chart this week, the index level has moved above the resistance line created by the intra-day lows. This is a less profound resistance line than the one created by weekly closing prices. The situation on the above chart is therefore mixed with a slightly bullish bias.

In this week’s XBD Broker-Dealer Index chart, we see no evidence of strength in the financial sector. Index levels have moved sideways between the support level created by the late 2010 bottom and the 61.8% Fibonacci retracement level. Stocks on the other hand have moved close to the level of previous highs. The financials, therefore, are lagging stocks to a large extent and the situation for stocks in general is not overly bullish based on analysis of the financial sector.
Summing up, the situation is mixed for stocks and a confirmation of a breakout (above previous high and long-term rising resistance line) appears to be necessary before the situation can be described as bullish. This is due to the weakness in the financial sector which normally leads the general stock market.
Correlation Matrix
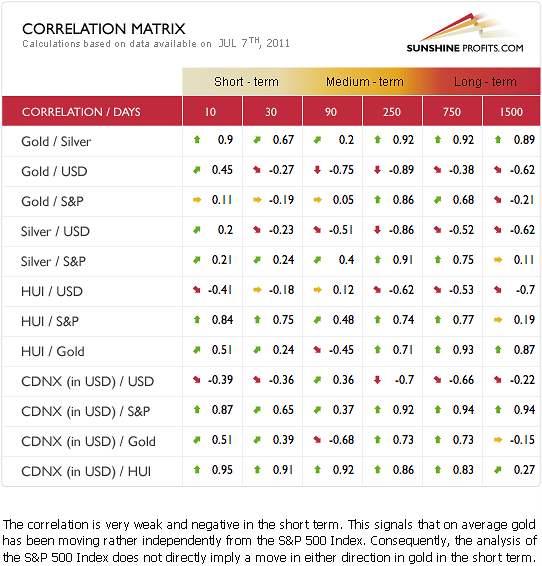
In this week’s Correlation Matrix, we see that there are no sure bets here. Out of all short-term gold/silver/gold stocks correlations with stocks and currencies, only the correlation between gold stocks and the general stock market has any merit. This is mainly due to the fact that both have been rallying recently. The rest of the coefficients are pretty much close to zero.
Therefore, short-term moves in the USD Index or the general stock market should not have profound implications on precious metals portfolios. This statement is based upon the low correlations seen in this week’s matrix between the precious metals and both stocks and currencies.
At this juncture, it appears better to analyze the precious metals and the gold and silver stock charts themselves rather than relying on the influence of other markets. In other words, the above-mentioned tense situation in the currency sector does not appear to be of key importance to precious metals investors until it becomes a major event. The same can be said about the general stock market.
Gold
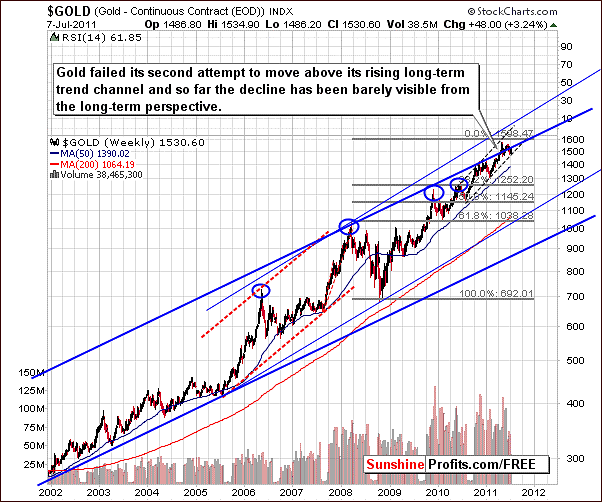
This week’s very long-term chart for gold once again shows continued attempts to move above the rising, long-term trend channel. So far the attempts have been unsuccessful and we consequently expect to see this index move lower in the coming weeks. At this time, there is really no other information forthcoming from this week’s long-term chart.
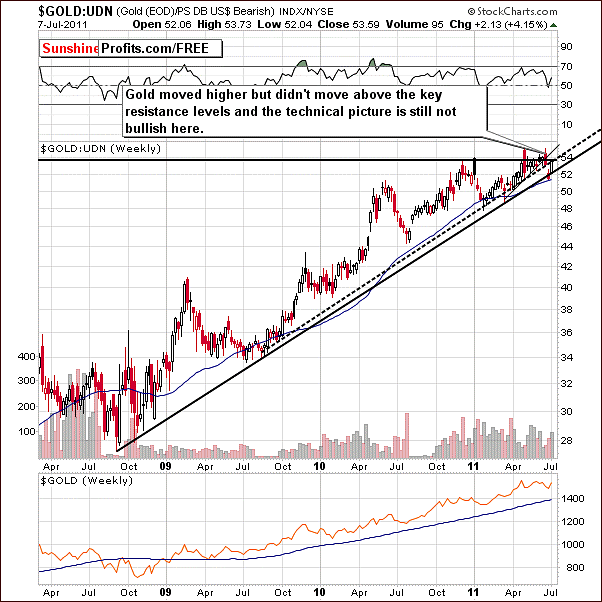
In gold’s long-term chart from a non-USD perspective, the index level has still not confirmed the move above the level of the 2010 highs. There were few attempts but the price quickly reversed and the breakout was invalidated. Now, after price reversed, it moved to the 2010 high level once again. This will likely be viewed as a confirmation of the breakdown unless a considerable move higher from here is seen.
It seems unlikely that the move from here will be to the upside and the situation still appears bearish at this time. Note that in non-USD terms, gold has moved to the rising dotted line in the chart which is formed from weekly closing prices. It is now a resistance line though it previously provided support.
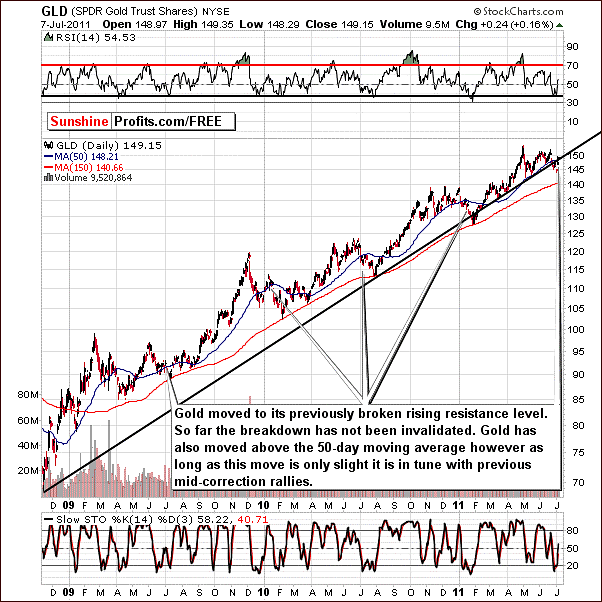
In this week’s long-term GLD ETF chart, price levels have moved slightly above the 50-day moving average. Until a significant move above this level is seen (above the previous high), it appears that the daily price movements remain very much in tune with previous mid-correction rallies. In the past, moves slightly above the 50-day moving average have often been followed by declines down to the level of the 150-day moving average.
Gold moved higher this week and this upswing appears to have stopped at the rising resistance level it previously broke below. Gold is clearly below its previous highs. Despite its rapidness, so far the recent rally doesn’t look like anything more than a verification of a breakdown below the long-term trendlines.
The situation based on this long-term chart remains bearish mainly due to the outcomes seen in several previous similar situations over the past eighteen months.
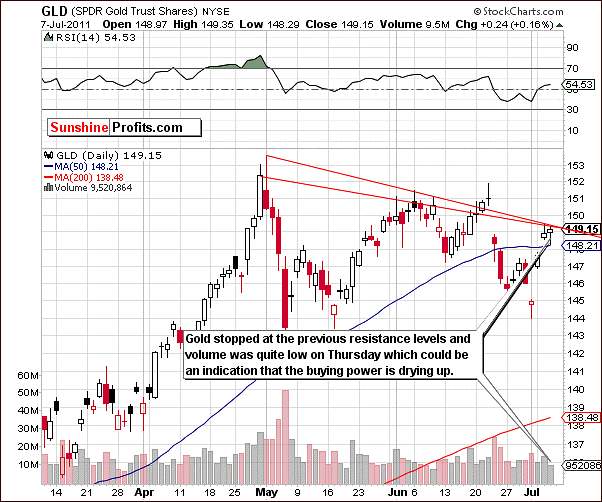
In this week’s short-term GLD ETF chart, we have our most profound view of gold’s recent rally. A close look at this chart reveals that resistance lines based upon daily closing prices and another based upon daily highs have now been encountered. Thursday’s slight increase on low volume could be a sign that buying power is drying up.
It is quite possible that the recent rally could be coming to an end. The resistance levels coupled with the price-volume action seen on Thursday make this outcome seem quite possible, although volume levels were not so low as to create a clear sell signal at this time. Barring a breakout above the resistance lines which appears unlikely, lower prices are probable in the coming weeks.
Summing up, the week has been quite positive for gold but a number of factors point to less profitable times ahead. A number of key resistance levels are now in play from both the non-USD and USD perspectives. With price levels generally just above the 50-day moving average, the situation will seemingly turn bullish only if prices move significantly higher from current levels. At this time, all seems very much in tune with a mid-correction rally and declines are therefore likely in the coming weeks whether they start immediately or not.
Silver
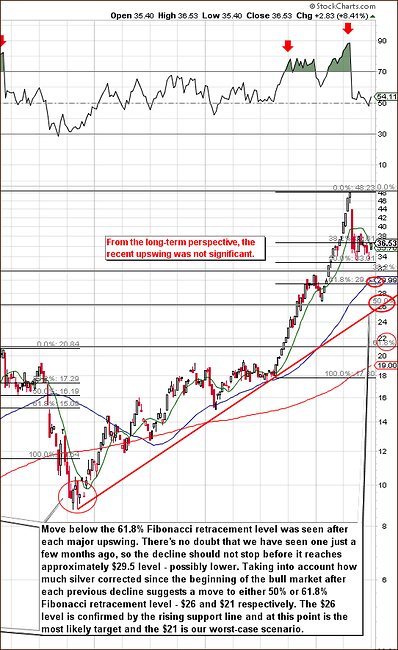
In this week’s very long-term chart for silver, we can see that this week’s rally is not too significant. There has been very little change in the overall long-term technical picture and previous target levels are still valid.
Last week, we briefly discussed how silver’s recent decline had been small compared to declines following previous rallies. To clarify what apparently confused a number of our Investors, we will touch on this subject once again.
Generally speaking, the 61.8% Fibonacci retracement level is often a valuable tool in analyzing silver’s decline following large rallies. Traditionally (for silver), this percentage of the rally is given back during the subsequent decline. The point which we wish to make for silver’s current decline is that less than 1 of the upside amount of silver’s recent rally has been given back in the current decline. Since 61.8% has been a common give back in the past, it appears that the current decline is likely not complete since it’s barely at a 50% give back point today. Hopefully this clarifies any confusion you may have had last week.
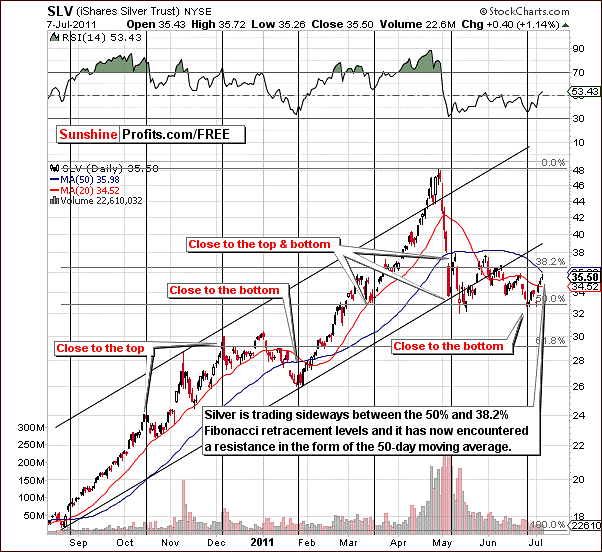
The short-term SLV ETF chart this week shows that silver reached a bottom at a recent cyclical turning point. The subsequent price rise has approached the 50-day moving average, which has in recent months stopped similar rallies.
Silver has recently shown some sideways price movement between the 50% and 38.2% Fibonacci retracement levels. When this consolidation concludes, the likely direction for silver at that time will be the same as it was prior to the consolidation period, that is to say, down. This could be invalidated if a rally is seen in gold and gold and silver mining stocks. The recent moves in these markets however, have not been very significant (not above previous highs), so it seems rather unlikely that they will positively impact silver’s next move.
Another point to be made here is that silver has recently moved to the levels seen prior to the recent decline whereas gold has not done this. Much of silver’s strength has been shown recently and where it previously lagged behind gold, it is now catching up. This phenomenon is quite universal and can be described as the leaders lagging and the laggards catching up. The premise behind this is that a lot of inexperienced Investors enter the market and are attracted to the underperforming laggards in hope that they will catch up (without any additional analysis). The demand is greater than usual since prices have generally declined for this group. Similarly, the leaders, whose prices are higher, generally draw less interest and less money because of this. At the same time experienced Investors sell strong asset groups as they realize that the top is close. The result is the leaders lag and the laggards catch up by attracting new Investors.
The above may or may not be taking place in silver – we view it as likely even though silver has very strong long-term (!) fundamentals. However, for the short term, the background information is that since a major top has been formed we have not yet seen a decline that’s big enough.
Summing up, the situation for silver is bearish for the coming weeks. Lower prices seem a good bet as the recent decline is likely to resume and still appears to have a ways to go before the next major bottom is in. More on this topic will be covered in our Letter’s section.
Gold and Silver Mining Stocks
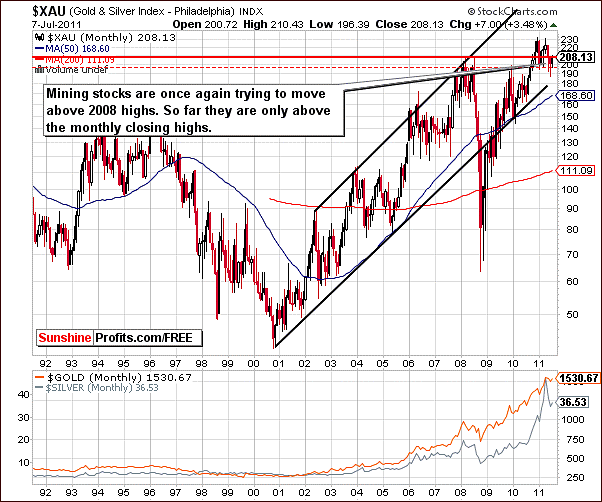
In the very long-term XAU gold and silver mining stocks index chart this week, once again we see the index level attempting to move above the 2008 intra-day highs. The monthly closing highs have been surpassed but the breakout is not confirmed without XAU taking out the intra-day highs. Consequently, with price below 2008 high, the situation remains medium-term bearish.
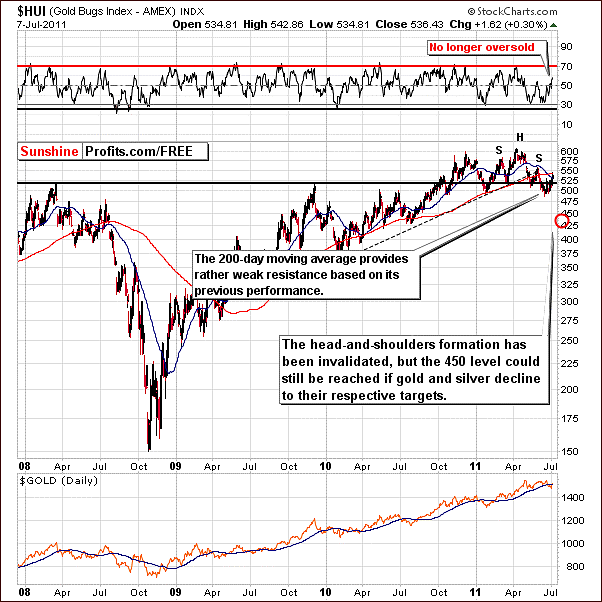
In this week’s HUI Index chart, we see that the head-and-shoulders pattern has been invalidated and there is little more information here this week. The 200-day moving average has been reached and this has proved to provide support in the past but is generally not all that precise. It’s really a slightly bearish factor at this point. Our previously stated target level of 450 for this index could still be reached if gold and silver decline to their respective targets as well.
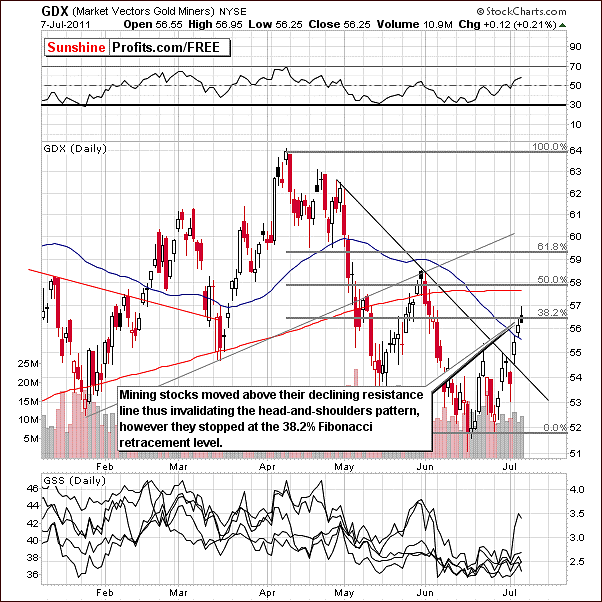
In this week’s short-term GDX ETF chart, we also see that the head-and-shoulders pattern has been invalidated as price moved significantly above the previous neck level.
The Miners’ ETF has reached the 38.2% Fibonacci retracement level based on the April-June decline in terms of daily closing prices. Given the size of the rally and the resistance level which has been reached, it appears that a short-term decline is in the cards here even if it was a beginning of a new rally. This could be the beginning of a bigger decline but it’s a tough call at this time. It is possible that some sideways movement could be seen for a while before the decline continues.
The relative performance of the Miner’s Stocks with respect to gold is similar to what we’ve seen in the silver mining stocks with respect to silver. Mining stocks in general have been disappointing in the past but have rallied strongly of late. Once again, the laggards appear to be catching the leaders and the implications could be bearish. On the other hand, once gold stocks prove to be really strong relative to gold (meaning that their relative performance to gold will continue to be strong for additional weeks) then we will begin to see is as a bullish phenomenon.
Summing up, gold and silver mining stocks have reached important resistance levels in the XAU long-term chart and the GDX short-term chart. This is similar to what was seen for gold itself. Based on this factor and rapid rally and subsequent pause, declines in gold and silver prices could very well result in declines for the gold and silver mining stocks as well. This may not happen immediately, but it is still in the cards.
Letters from Subscribers
I'm new to investing - do you have a set portfolio or do you provide trading tips?
Which do you like for speculation and which for long-term investment: GLD or the Central Fund of Canada?
In short, we prefer CEF to GLD for long-term investment. As far as speculation is concerned - if you want to bet on gold and silver price movements at the same and don't want leverage, then CEF is preferred since it is composed of both gold and silver. However, if you prefer gold and you like leverage, then GLD is preferred - based on its liquidity and availability of options.
You will find additional information here.
The current COT situation
Another Subscriber referred us to an article about the current COT report situation. In particular, the Commercial Net Short / Total Long Ratio was featured, which he said is causing much excitement. Actually, we agree that this ratio is very interesting indeed. The upshot of the piece is that contrary to the present general market sentiment, a certain graph is sending out a multi-month buy opportunity for all silver investors. There is a claim that historically this particular analysis has pointed consistently to 50% plus returns.
Our Subscriber said that at the first sight it looks quite convincing to him.
I have read it, and though I don't fully understand the basis of their conclusion (silver will bottom shortly in the mid-30's and then rocket upward to at least $50 by year’s end)
Here’s our take. Generally, the whole bullish analysis stems from the chart featuring the Commercial Net Short / Total Long Ratio. This ratio is close to its previous lows and when it was previously similarly low, silver bottomed, so the argument is that silver is bottoming right now as well. Please take a look below for details.
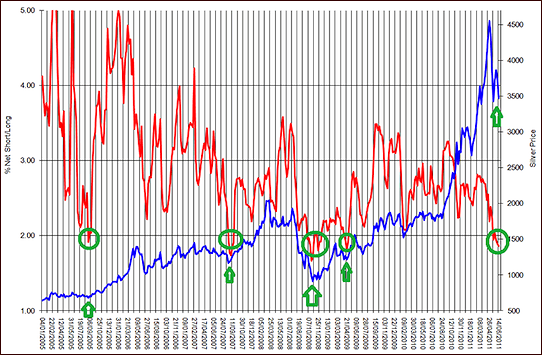
Source: http://politicalmetals.com/2011/06/21/will-it-be-up-or-down/
We agree that at the first sight it looks quite convincing. However, at the second look, we see the thing that is not emphasized on the chart, and should be, is that the ratio is in fact in a downtrend. It's quite obvious in terms of lower tops on average, but it is not that obvious when one takes a look at the lows.
There are 4 lows that are featured on the chart and actually only 3 of them mark major bottoms that mark the start of a bigger rally. The most recent one is just a local bottom seen after the correction from a true 2008 bottom.
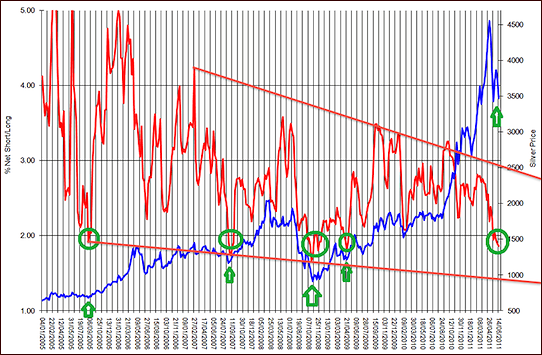
Now, if we take these three important bottoms into account, a new pattern will emerge. Namely, that the major bottoms in silver are accompanied by the ratio moving below previous lows and possibly to the lower border of the trading channel. Either way, this suggests that what we have seen so far is not yet the final bottom and that a move toward the declining support line will likely confirm that the bottom is in fact in.
Another point worth noting is that none of the major rallies (indicated by green ellipses and arrows) started soon after a previous major top and this is what the "horizontal buy level" theory would imply for today’s situation. However, taking a relative (here: trend) approach would allow for further declines that would take more time. This would make the next super buying opportunity in tune with the previous ones and since history rhymes, it seems to be the more likely outcome.It would be also in tune with targets mentioned in the Silver section earlier in this update.
There's one more interesting phenomenon that is connected with silver and taking a relative approach - the silver:gold ratio. Please note that we've written about this ratio in mid-April and soon after that ratio topped at the upper border of the rising trend channel - along with silver itself. Also note that it did not top at the previous highs, but at the resistance based on the trend channel.
Summing up, there is more than one way to analyze the Commercial Net Short / Total Long Ratio and it seems that the relative approach is more appropriate – as it is more in tune with the past patterns. Consequently, we don't view the current levels of the ratio as a strong short-term buy signal.
Chinese gold investments
A Subscriber sent us a link to an article about Chinese gold investments and asked for a comment. We read the article which says, in short, that the launch of the new gold and silver exchange in China will take the remaining gold and silver shorts out of the market and be “a big game changer.” The article noted that China is keen to diversify cash holdings and is also encouraging citizens to make investments in gold and silver. The Pan Asia Gold Exchange will ease access to physical gold and silver for bank customers.To give a picture of the enormity of the change, the article points to the Agricultural Bank of China which has over 320 million retail customers and 2.7 million corporate customers. The bank has integrated its customer account information system with this precious metals exchange platform.
Yes, we agree that the Chinese market for precious metals is a positive fundamental factor and it will likely contribute to gold's and silver's rally in the following months/years - but not necessarily right away.
Interest rate hike by the European Central Bank
The interest rate hike by the European Central Bank to 1.5 percent from 1.25 percent, the second hike this year, was the subject of another letter. The Subscriber noted that this hike may boost demand for the euro and that gold typically moves counter to the greenback. He wants to know how much this interest rate increase will affect the predicted decline in precious metals.
Well, the ECB did raise the rates, but this came as no surprise to us or to the market, which means that this factor was already discounted in the price. Consequently, it seems that it's not much of a factor for the current situation in the metals. Generally, it is only the unexpected events that cause sharp moves in prices.
Dodd-Frank Act and gold/silver
Another reader discussed notifications around the July 15th deadline (date when speculative gold and silver positions on the OTC market are closed due to the Dodd–Frank Wall Street Reform and Consumer Protection Act) and was curious if the 15th would be a good target date to use as a guide for a big sell off in gold/silver?
We say that it could be the case, but we would not bet a farm on this particular date - precisely because this information is well known in the market and is most likely already discounted in the price - which we have already discussed above.
Summary
The situation in the currency markets is quite tense this week. In the general stock market, the situation is mixed at best. In an important development, both stocks and currencies appear to no longer have significant short-term impacts upon gold and silver prices. A previously reliable similarity between gold prices and Euro Index levels might be no longer valid. We will continue to monitor this situation going forward.
It appears now that the precious metals and the mining stocks are best analyzed by studying their respective charts. Presently, the precious metals sector components have reached significant resistance levels. Silver has declined recently but the decline appears to be incomplete and therefore likely to continue. It is unclear whether it will resume immediately or sometime in the near future. Lower values across the metals sector are likely in the coming weeks and our previous targets of $1,410 for gold, $26 for silver and 450 for the HUI Index are still up to date for this summer.
Our next Premium Update is scheduled for Friday, July 15, 2011.
This completes this week's Premium Update.
Thank you for using the Premium Service. Have a great weekend and profitable week!
Sincerely,
Przemyslaw Radomski

