Bertrand Russell said that war does not determine who is right - only who is left. The lines are drawn, the cannons are loaded-- the currency war has begun. The opening shots have already been fired with the biggest battles still ahead. This is a superpower currency shoot-out with other countries trying to avoid getting caught in the cross-fire. Each nation is taking unilateral actions to defend its economy from the other in an escalating battle over the value of the world's key currencies.
This is good for the price of gold. Gold jumped to fresh dollar records above $1,350 an ounce early Wednesday, hitting its 16th new all-time high in 17 trading days.
A growing number of countries see a weaker exchange rate as a way to lift their economies. They want to export their way out of trouble. This war is over the ability to export products to other nations and about keeping your own citizens employed during a period of an extended slowdown in global demand. Nations will either vault forward or fall behind, so they are trying to protect their own turf, a worrying signal that all is not well with the global economy. Countries tend to be less bothered about a strong currency in bad times.
Brazilian Finance Minister Guido Mantega said it bluntly giving public voice to what many were saying privately.
We're in the midst of an international currency war, a general weakening of currency. This threatens us because it takes away our competitiveness, he said.
The head of the International Monetary Fund, Dominique Strauss-Kahn, warned in an interview against countries using currencies as "policy weapons." In comments to the Financial Times published Tuesday, Strauss-Kahn said: Translated into action, such an idea would represent a very serious risk to the global recovery...Any such approach would have a negative and very damaging longer-run impact.
Fears of a global forex war landed center-stage this week as Europe and China warm up for a head-to-head summit focused on the yuan, which the West says is undervalued. For years China kept its currency low and its exports high, but now with economic sluggishness, everyone is fed up with China. There is growing exasperation with China's unfair advantage. Most analysts believe the yuan could be as much as 40 percent below current value without any government interventions.
The yuan was pegged to the dollar until June. It has since been allowed to fluctuate in a tight range, but hasn't strengthened nearly enough to satisfy other economies confronted with slumping exports and massive trade deficits with China. To the dismay of Europeans, the yuan has since strengthened by about 2% against the dollar but fallen close to 10% against the euro.
Europe and the United States have become increasingly frustrated by a huge trade imbalance which they fear may hamper recovery and accelerate the seemingly unstoppable rise of China, India and others in an emerging new world order. Chinese premier Wen Jiabao asked European Union leaders Wednesday to tone down their attacks on Beijing.
Each nation is attempting to manipulate the U.S. dollar to its own advantage. Japan stole the limelight recently with a deflation-fighting combination of lower interest rates (as if they could go any lower than 0%) and a new asset-buying program-a mix that pushed the Japanese yen lower for a short time. They also printed some new yen to buy backed commercial paper, corporate bonds, exchange-traded funds and Japanese real estate investment trusts.
This was good for gold.
Gold climbed to a record in New York and London after Japan's move. Silver advanced to a 30-year nominal high.
All this came following recent Chinese purchases of Japanese government bonds that drove the yen higher. Japan responded by buying dollars to drive down the yen. China is the clear winner in this skirmish. It gets a more diversified portfolio (with more yen in it,) insurance against any fall in Treasuries, and still gets its near-term goal of a continued strong dollar vis-à-vis the yuan and the exports and jobs that means.
Meanwhile, South Korea is carefully watching its own currency, the won, and the inflows that have pushed it to five-month highs against the dollar. The Bank of Korea is reported to have sold its local currency during Asian trading hours.
Just a few weeks ago the U.S. House of Representatives overwhelmingly passed a bill that would enable the Obama administration to impose punitive tariffs on almost all Chinese imports into the United States. The move is intended to punish China for refusing to revalue its currency.
"China's persistent manipulation is a major distortion in the international marketplace," said Sander Levin, chairman of the House Ways and Means committee. The yuan "has a major impact on American workers and therefore American jobs. That's what this is really all about."
The bill may not pass in the Senate and there is little chance that the President will sign it if it does.
So, this is a war with many fronts. If you want to keep score, here are the players:
· China is keeping its currency undervalued so its exports are cheap for Americans.
· China is buying Japanese yen and European euros to hamper the exports of its rivals.
· Japan is selling yen to buy U.S. dollars, hoping to boost Japanese exports.
· Brazil is selling its currency, the real, to buy dollars, hoping to help Brazil's exports.
· Korea is selling its currency in an attempt to take it down a peg.
· Switzerland bought euros this spring and switched into U.S. dollars.
· Other countries that have intervened in an attempt, so far with mixed success, to restrain appreciation of their currencies, are Taiwan with Thailand, Indonesia and Singapore rumored to have followed suit.
With further quantitative easing in the developed world the appeal of hard, unprintable currencies like gold and other commodities will continue to shine. Given the budgetary jam U.S. leaders find themselves facing, they understand that one of the few options they have available is to boost American exports by devaluing the dollar.
All this is very good for gold.
To see just how good it will be, let's begin this week's technical part with the analysis of the Euro Index. We will start with the long-term chart (charts courtesy by http://stockcharts.com.)
Euro and USD Indices
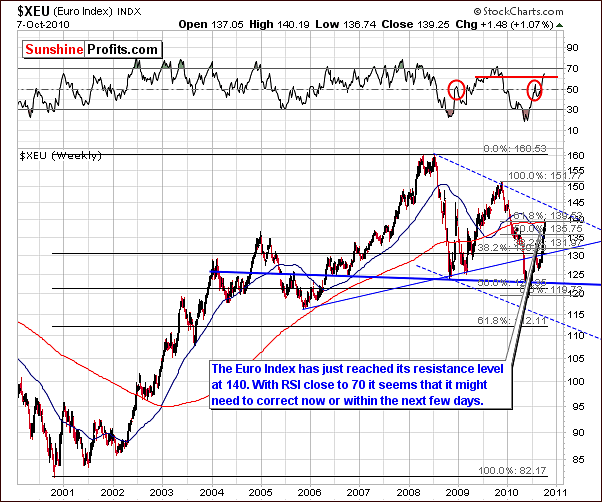
Beginning with the long-term Euro Index chart, we see a confirmation of last week's suggested topping out around 140-level. Additionally, the local bottom we expected in the USD Index has also arrived and will be discussed in a later section of this update. Although the local bottom has not yet been confirmed for the USD, it is highly likely to be in.
The last time when the Euro Index rallied after an substantial decline (in 2009), the second local top was formed with RSI close to the 60-level. Such is the case today as indicated by the horizontal red line in our chart and since right now euro is also rallying after a sizable decline, it could be the case that the history will rhyme. It is likely that a correction will be seen in the following days, most likely to the 130-135 area. The 50-week moving average, which has stopped previous corrections many times, is also within range as well.
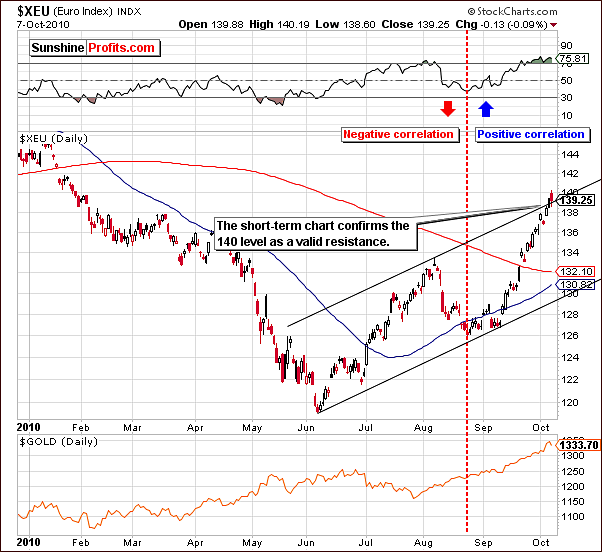
In the short-term Euro Index chart this week, we see that a strong resistance level has been reached, which makes the decline from here even more likely.
Another point worth mentioning is that since late August the correlations between gold and the Euro Index have moved from negative to positive. We therefore now expect a similar trend in the Euro Index as compared to that of gold, silver and mining stocks. A correction in the Euro Index is expected and will likely be seen in the precious metal sectors as well. It is important to note, however, that we are speaking of the near-term only at this point.
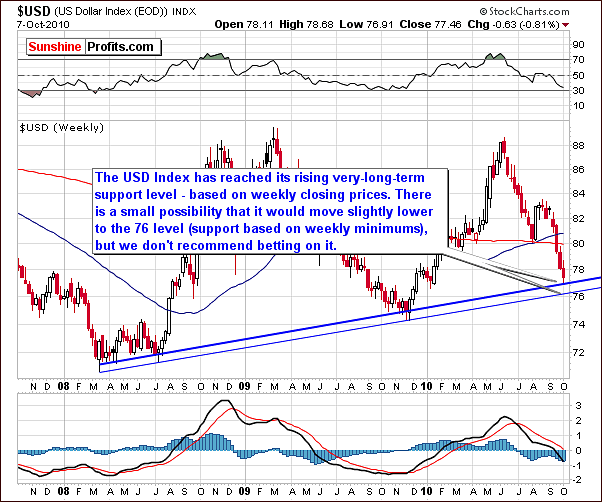
The very long-term USD Index chart, which shows trends from a weekly perspective, is clearly approaching an important support level today. Although we may see a move slightly below this level temporarily, the local bottom is likely very close to being in.
With strongly negative correlation between metals and the USD Index (we will get back to this topic later on) the implications for precious metals are obviously bearish. The local tops should be quite close although double-tops cannot be ruled out and should therefore not be surprising. It all depends on whether the support level has enough strength to stop the USD decline at 77, or will it need to move lower to 76. We believe the former is more likely.
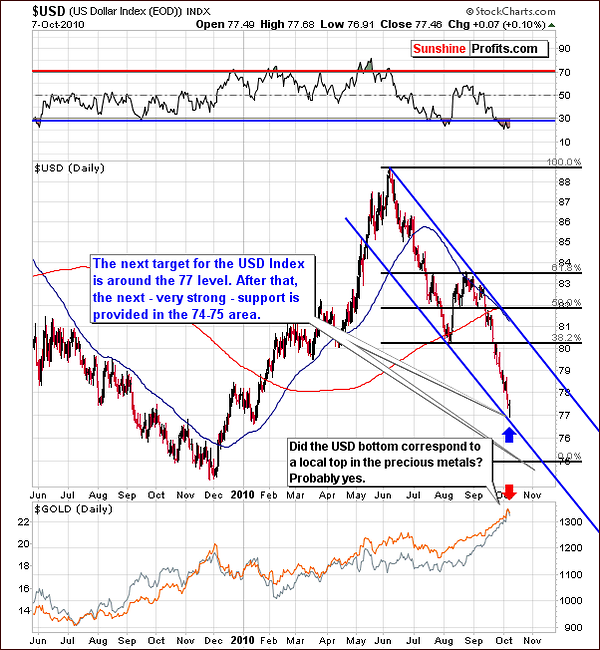
The long-term chart shows that the bottom is likely in. The lower border of the trading channel will likely provide support as discussed in last week's Premium Update - "The target level for the current decline is close to 77 and a pullback/consolidation is probable once this level has been reached." If the bottom is in fact in (and it certainly appears so), it will mean that at this time the index is following expectations remarkably well.
The above would be true also for the timing-related expectations. Last week we wrote the following:
The cyclical turning point is likely to be reached very soon although it may actually lag the vertical black line on our chart by several days. Such discrepancy is quite common and was most recently seen with the local top early last month.
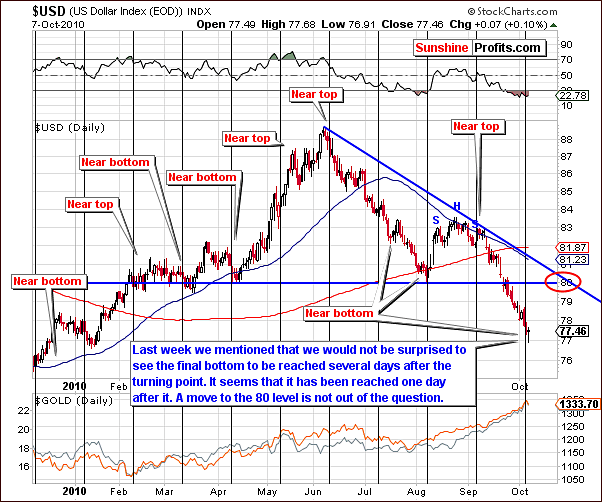
Consequently, the odds of Thursdays being the bottom are even higher. Besides this particular confirmation, the above chart provides us with the target for the coming rally - the 80 level. This is not only the multi-year support/resistance level, but it also happens to be where the declining resistance line will be when USD rallies. As is normally the case, the exact timing and ultimate target levels are greatly impacted by other world markets and financial factors. The Euro Index, of course, very much influences on what happens to the value of the dollar.
Summing up, the near-term outlook is bullish for the USD and the local bottom will be seen quite soon if it is not yet in. This is bearish news in the near-term for gold, silver and mining stocks. Local tops may have very likely been reached on Thursday and the long awaited correction could very well be underway.
General Stock Market
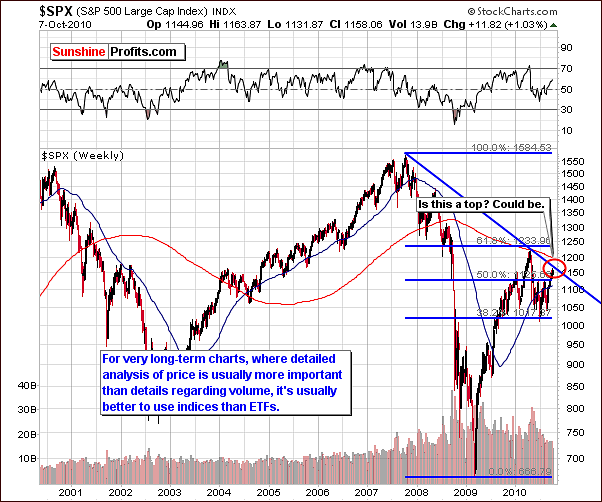
The S&P 500 Index very long-term chart shows a declining resistance line very much in play. This could stop the current rally or delay it for several days or even weeks. Because this resistance line is created from important previous local tops over a period greater than two years, it is really significant. Additionally, the recent strong volume levels on daily price declines further reduce our bullish sentiment for the upcoming period.
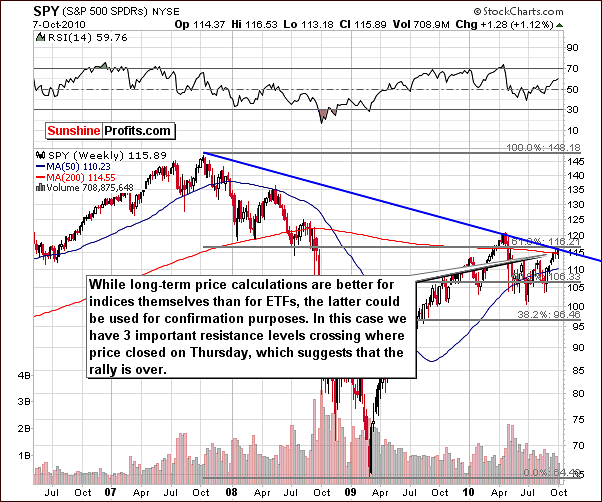
While long-term price calculations are better for indices than for ETFs, the latter could be used for confirmation purposes. On the above chart we have 3 important resistance levels: the 200-week moving average, the declining resistance line (analogous to the one on the S&P 500 chart), and the 61.8% Fibonacci retracement level.
Each of these levels is important, and by combining them we get very strong resistance at the current price level that is likely to stop the current rally. Consequently, the bias is currently bearish for the main stock indices.
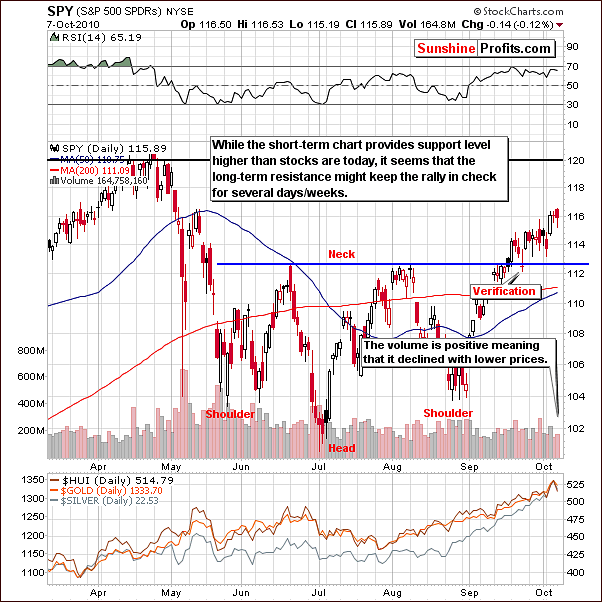
The short-term chart this week does not provide any addition bearish information. The resistance level in this chart is above today's price levels. When contradictory signals are seen, the very long-term resistance line is always given more weight than one from the short-term.
As indicated in our previous section, a correction or at least a pause in the current rally is likely to be seen in the coming days. This is also the case for precious metals which have been highly correlated with stocks in recent weeks. Reversals in two major currency markets, the Euro Index and the USD Index will likely further contribute to a reversal in the current general stock market trend.
Summing up, the outlook for stocks is generally bearish for the near term. Very long-term resistance lines point towards a pause or a reversal of the recent rally and there has been little evidence to support enough strength to break through this resistance level.
Correlation Matrix
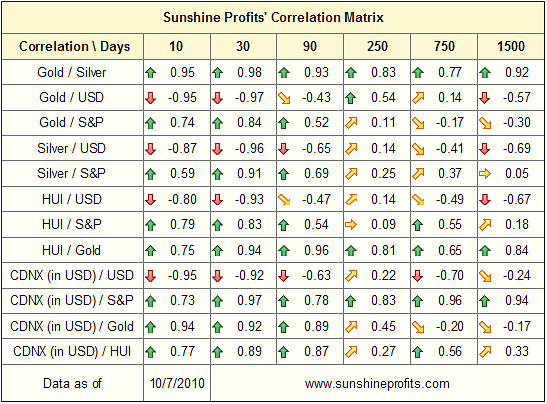
In the Correlation Matrix this week, the implications seem point to a decline in the metals and mining stocks given the rally from here for the USD and a downturn for the general stock market. Gold, silver and mining stocks appear bearish from both sides especially in the 30-day column, with correlation coefficients being extremely close to 1. This sentiment is further supported with the coefficients in 90-day column (meaning that these markets are correlated also in the medium-term).
Gold
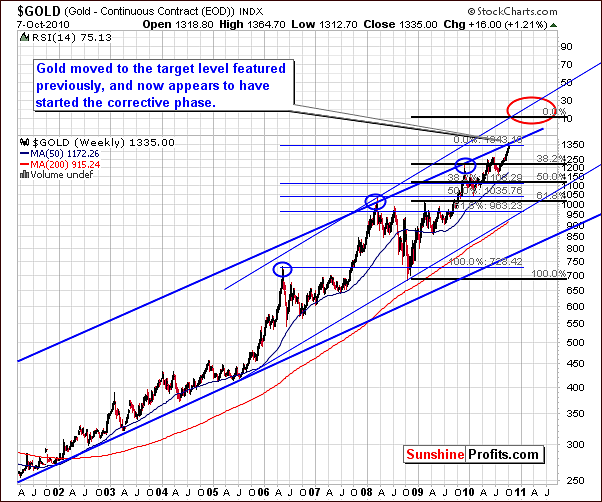
In the very long-term chart this week, we see that gold moved up to the upper border of the very long-term trading channel. Last week's stated target level was breached only temporarily. It seems as though gold's fervent rally may have ceased, although Friday's intra-day action might provide a different impression at the first sight.
Thursday's decline from intra-day highs are an indication that the corrective phase may have begun, mainly because of the size of the decline and the fact that it was accompanied by huge volume The obvious question now is how low will gold's price go? This week's shorter-term chart will provide us with some of the needed details.
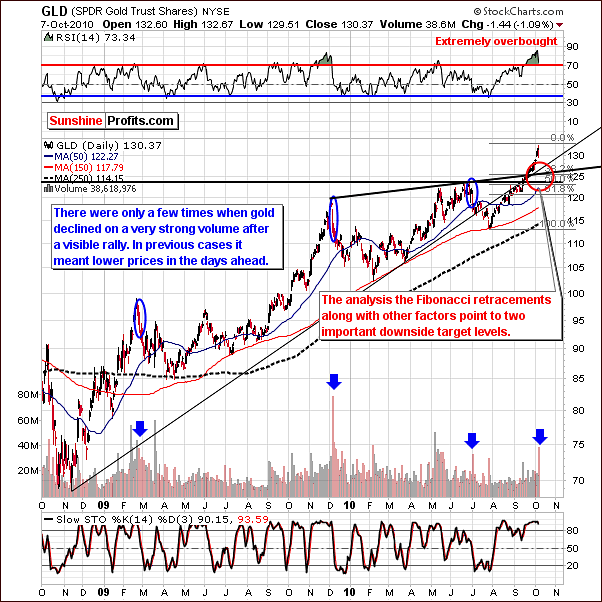
However, first, let's take a look at gold from the medium-term perspective, which will provide us with the confirmation of the abovementioned thesis. The RSI, which has been in "overbought" status, now appears to be correcting. With a price decline on strong volume, it is likely that the big rally has ended based on patterns observed in past corrections - please take a look at the areas market with blue ellipses and blue arrows in the volume section.
The signal coming from volume is quite unique - we've seen similar signals only a few times in the past, and each time a decline followed.
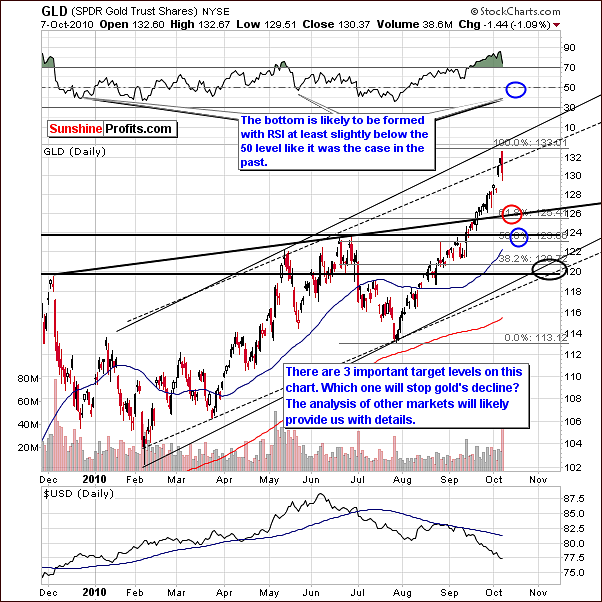
So the question remains, how low will gold's price fall? We have included three ellipses in our short-term chart this week. They correspond to several support levels including the Fibonacci retracement levels and the rising trend channel. Note that the target levels range from approximately $119 to $126 (with red and blue ellipses indicating most likely levels). It is important to monitor gold and other markets for more specific details, on which bottom target level will be most accurate. For instance if USD Index moves to the 80 level and pauses and the GLD ETF will be at $124 at that time, it will likely be the bottom.
In recent weeks, gold's price rise has been very much USD driven. As we discussed in previous updates, once the USD Index reached a local bottom, likely in the 77-level range, gold prices will probably decline. This is precisely what we have seen in the last day or so and it will be important to monitor the correlation matrix when gold's price approaches the target levels defined above to see which market is best aligned with gold at the time. This will allow us to better anticipate the likely turnaround. A final note concerns the RSI and what to look for: it is likely to move below 50 before the local bottom for gold is in.
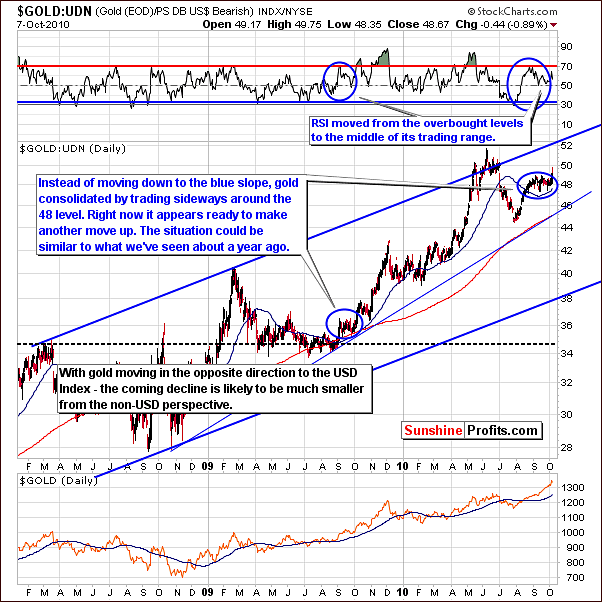
This week the non-USD gold chart shows that the correction discussed previously appears on a much smaller scale. Non-USD investors should probably sit tight with long-term holdings, as we don't suggest opening any speculative positions at this time. The correction, which is anticipated, is likely to have a much smaller impact upon those investing from a non-USD perspective precisely because while gold's value would drop, the value of the currency that it is price in will appreciate from non-USD Investors' perspective. A slight consolidation could very well be followed by a very quick upswing.
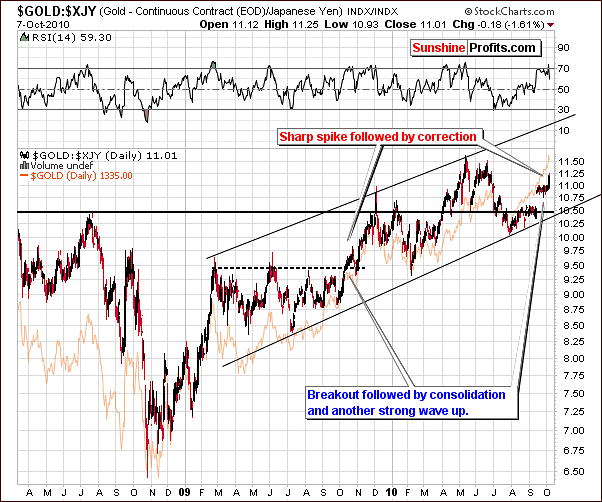
Once again, we look to the Japanese for further validation of previous observations. In this chart, we see a sharp spike followed by a correction during the following days - which took place right after a breakout above horizontal resistance level. This is what we see also today. Again, expectations are that a decline to levels a bit lower will be followed by a big rally. This is similar to what we have observed and commented upon from a USD perspective. Once again, we have further validation from yet another, independent source.
Summing up, it appears that the correction has begun as lower prices were seen on Thursday. Three target levels have been identified with a move below $120 seeming least likely to be achieved. The good news is we have the strategy to determine which target will hold this downturn. On the other hand, we will be able to utilize this strategy only when close to these levels. We will continue to monitor other markets to better determine which target level will likely hold and most coincide with the next local bottom.
So let's discuss a bet on lower gold prices. At this time, such a move would require put options in our opinion, since futures contracts are a difficult bet at this time due to uncertainty with respect to short-term prices. A sharp move higher would pose a serious problem, because it would most likely cause your stop loss order to be executed (and using futures without stop losses is not advisable). Buying put options however, could prove profitable right now. Again, futures could be bought with a stop/loss in place but still a temporary move up could cause a premature exit from the market. Put options are therefore preferred at this time over futures contracts with a corresponding stop/loss in place. Remember that we don't want to miss the next rally once this move down is completed.
Again, at this point use a small part of your capital for this bet - if we have a confirmation that this move is very likely, we will let you know that it's a good idea to add to your positions.
Silver
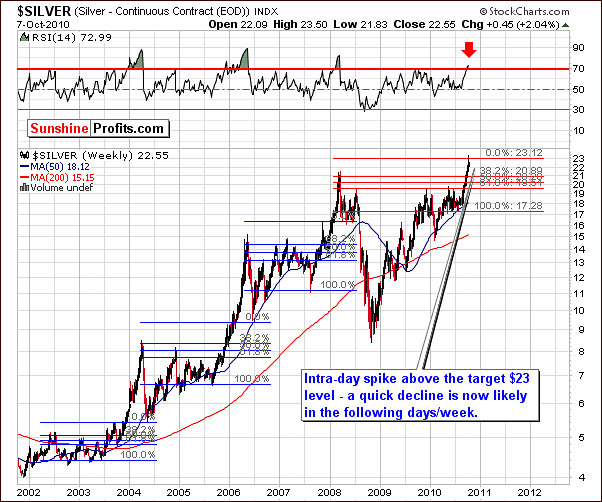
In this week's very long-term chart for silver we do acknowledge a move slightly above last week's stated target level. Last week we wrote the following: "The current rally has a target around $23 using previous tops as a guide... If silver rallies as rapidly as in the past, and there is actually a chance that it may be more rapid, cyclical turning points are of great use here. This suggestion is that a local top will be seen in the first two weeks October and it's likely that this will coincide with local tops for gold and mining stocks as well." On Thursday, silver also declined slightly and with an RSI greater than 70, it is likely that we have seen a local top based on a study of previous patterns. A consolidation period is expected now and further details will be seen in this week's short-term chart.
Based on Friday's intra-day price action it seems that we might see a double-top in silver - something that the white metal is known for.
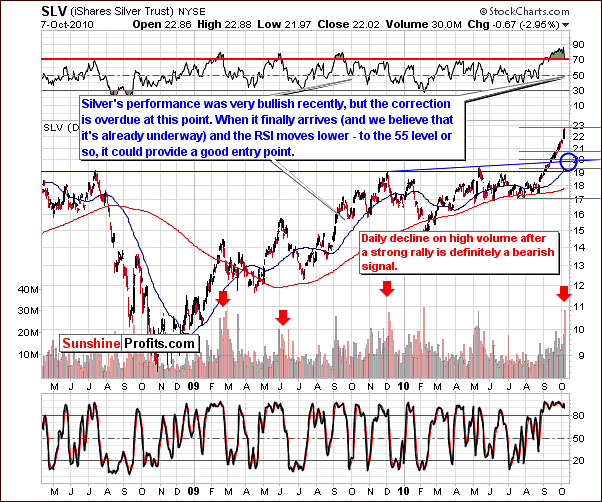
Target levels for the consolidation period are between $19 and $21. A target level of $20.5 or so for spot silver ($20 in SLV ETF) is likely based on Fibonacci retracement levels and the short-term rising support level (marked with the rising blue line on the chart above). Furthermore, the 50-day moving average will come into play close to the 20-level and may also be a factor.
Additional confirmation is likely to come from the RSI, which may very well decline to the 50-55 range before the bottom is in.
The short-term silver chart provides us with timing details.
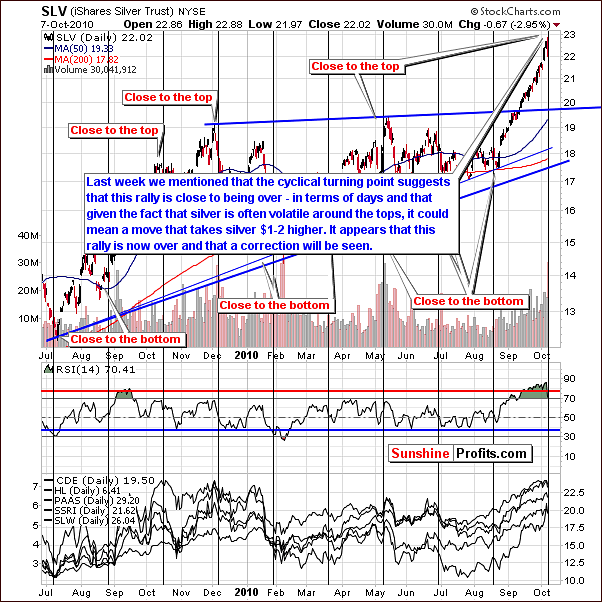
Last week we featured the analogous chart, which suggested a turning point in early October - and this is where we are today. Consequently, the "top being in" scenario is confirmed not only by the levels that silver reached, but also by the cyclical nature of the white metal.
Moreover, we would like to quote something stated last week:
The white metal breached to new nominal highs, so we've examined how silver performed during the previous times that it broke into new highs.
September 2003 - sharp correction (bottom visibly lower than the previous high) followed by a very strong multi-dollar rally
December 2005 - correction (bottom slightly lower than the previous high) followed by a very strong multi-dollar rally
November 2007 - correction (bottom visibly lower than the previous high) followed by a very strong multi-dollar rally
Let's not forget this analogy. The previous high is at $21.44 for spot silver, so the price of silver is likely to move below this level during consolidation.
Summing up, silver is likely to retrace from here with target levels close to $20 being likely. Other markets should be monitored closely in the coming days as they will likely provide implications towards silver's next move. Sunshine Profits will continue to monitor all markets and utilize its tools in order to provide its Subscribers with timely updates as we move through this consolidation period.
Precious Metals Stocks
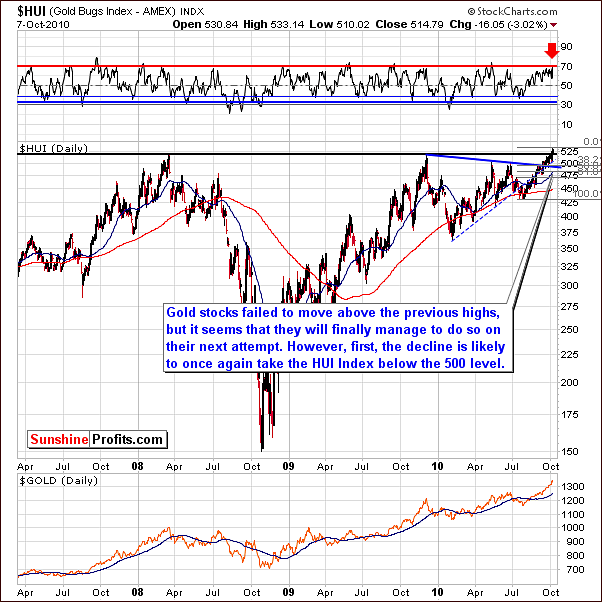
Last week we presented two possible scenarios for mining stocks. The first concerned a breakout above previous highs followed by a slight decline and consolidation. The second scenario was for a decline with a consolidation to begin before the level of previous highs was reached with subsequent new highs to follow. The latter case is what we have seen in recent days as the HUI Index did not surpass previous highs.
Although a move lower is likely and a return to levels below 500 may seem possible, the obvious expectation of a move down to 370 or so before reversing is not likely to be seen. As was the case of the general stock market recently, what seemed an obvious head-and-shoulders pattern never really played out. The "obvious" frequently does not come to pass with regards to financial markets.
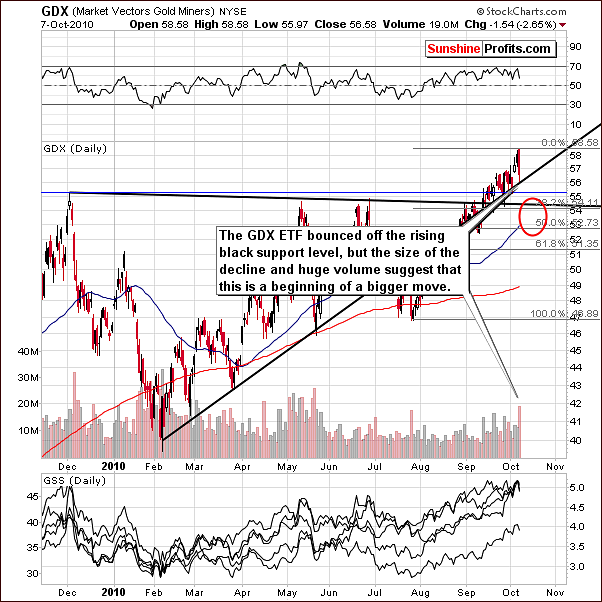
The GDX ETF, a proxy for the mining stocks, points towards a likely correction in the short-term perspective. The bad news here is that we have very few tools to apply in this least predictable - at this time - market. Consequently, target level is quite wide and Fibonacci retracement levels are our only really reliable tool on the above chart. Lower boundary is marked with 50% retracement level close to the $53 in GDX ETF and upper one marked with 38.2% retracement level, which is slightly below $54 coinciding with medium-term declining support level. Once again, other markets such as gold and silver need to be monitored to further determine if mining stocks will bottom at the expected target levels. Consolidation is likely, of course, even though we have not yet seen a fall below rising support levels.
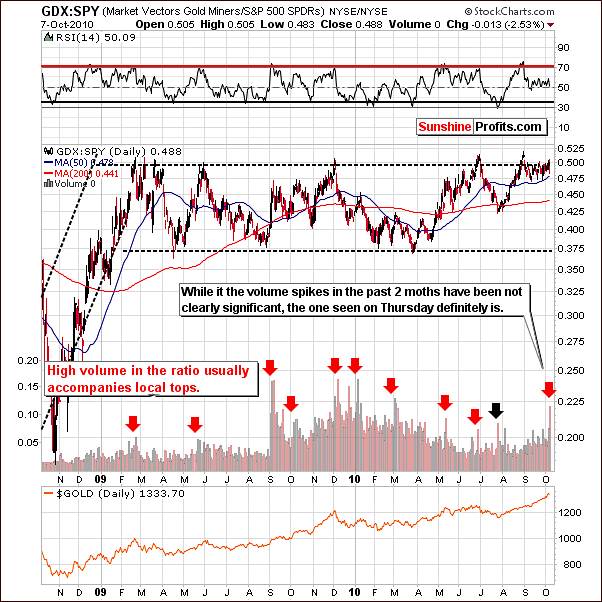
The GDX:SPY ratio chart shows exceptionally high volume and this factor has consistently accompanied local tops in the past. Having rallied for the past several weeks, it is likely that mining stocks have formed a local top.
Volume levels in the above chart are obtained by dividing daily GDX volume by that of SPY ETF. In this case the GDX daily volume was relatively high comparing to the SPY ETF volume, which has been low on a relative basis. This scenario very often accompanies local tops.
Summing up, all signs point to a consolidation period in the near-term for mining stocks. This is consistent with expectations in the gold and silver markets themselves but as is the case there, the consolidation period is expected to be minimal before we are likely to again see an upswing and additional rally in the precious metals sector.
Other information
Before summarizing, we would like to reply to the question that we've received this week. Let start with the answer for the question on how we can manage the risk in the long run and still be able to increase our portfolio? While we have emphasized many times in the past, it seems that it really cannot be over-emphasized, because of the importance of this area. It can be done by limiting the size of your speculative positions, using most of one's capital for long-term gold and silver investments, and keeping one's bullion holdings at all times. This way, if all hell breaks loose - your bullion will protect you. If the rally will be steady and without any corrections - your long-term holdings will make you rich, and if the bull market will continue to take two steps forward and one step back as it is mostly the case - you will be able to gain on most of your speculative trades and increase the value of your portfolio in this way. In this way, even if some trades don't play out as expected, it will not destroy your capital but only decrease its speculative part on a temporary basis.
One of our Subscribers asked us what is the best currency to buy gold and silver with and what can we say about the gold and silver ETF in Switzerland (SGOL) - owned by the Zurich Kantonal Bank. Actually there is a little difference in which currency you will buy your gold or silver. The important question is for which currency you will sell for and where you will live at that time (in what currency you will pay your bills).
Ultimately you are buying the same yellow or white metal for your fiat money - worthless taking the intrinsic value into account - and you buy something that's tangible. When you buy your metals, it is the same stuff, no matter if you will buy it with dollar, renminbi, rupee or any other currency.
The difference is where you will live and in what currency you will need to pay for your daily expenses when you sell that gold/silver. Right now it seems that every currency will decline versus precious metals especially when we are definitively ahead of the third stage of bull market.
Besides, the currency that gold will go up by the most - percentagewise - will most likely be the currency, whose holders will suffer from the biggest inflation, and with prices rising much faster than in other countries, will it really matter if your nominal gain on your gold investments is bigger? We don't think so.
Regarding ETFs in Zurich - we suggest geographical diversification of one's holdings, meaning that if you don't own gold nor silver that is stored in Switzerland then this might also be the way to go. By the way GoldMoney also provides you with a similar opportunity.
We have also received a question about the favorable entry point for long-term investments. The answer is "now", as we do not suggest timing this correction with one's long-term capital. If one prefers to take the risk anyway and wait with the purchase for lower prices, we would still suggest purchasing metals with about 2/3 of one's long-term capital and waiting with entering the market only with the remaining 1/3.
We would like also to comment on question about DOW, which is going up even though its foundations are eroding faster than the US dollar is being devalued. The world knows that the US is collapsing due to money mismanagement, however, this is not the only country with economic problems - European Union has its own problems - and the other parts of the world might suffer as well if these two powerful economies fall. The fact is that the US is in a very bad situation, but another fact is that most people would prefer to remain optimistic and if stocks are rising for whatever reason, they will eagerly join the party with their own capital. As long as sentiment remains positive and people prefer not to think about the economic problems, stocks may rise.
The point is that fundamentals are a long-term factor and may take years for the market to take them into account. If fundamentals are negative and the emotions of market participants are positive, it simply means that people don't want to believe in bad news.
Moreover, since people get a lot of money from the government to buy something (for instance in the form of low interest rates that allow them to purchase on credit) - they will do so, including stocks as well. There is little to choose from when taking into account bonds that don't yield much revenue, a housing market being far from attractive, and of course precious metals, however, the latter is not very popular yet. Everyone that heard about stocks knows how to buy them and the money you can earn out there, so they don't believe in the bad news.
The final note is that if one compares DOWs performance vs. that of gold, one will see that the stocks have not been rising at all in real terms - taking the price of gold as a way to measure inflation.
Summary
The Euro Index and the general stock market have likely reached their local tops and the USD Index - a local bottom. Even if it is not the case at this time, we are very close to turning points. This has wide implications for stocks and precious metals, driven by recent rally to extremely overbought areas in the short-term.
Along with return of strong correlations between precious metals and abovementioned markets it is highly likely that yesterday's action was the beginning of awaited consolidation, with possible targets of $127, $124 and $121 for the GLD ETF (respectively $1,300, $1265 and $1235 for spot gold) and around $20 for SLV ETF (around $20.5 for spot silver). After this consolidation will complete, it seems that the next rally is going to be really significant for gold, silver and mining stocks with targets $1500 for gold and perhaps $30 for silver.
Still, before that could happen we see precious metals consolidating along with the general stock market and rising USD Index. It is not clear at this point when the stocks will bottom but it will be important to monitor the precious metals along with the USD Index. If the latter will show signs of topping out, possibly at the 80-level and precious metals with mining stocks will get close to the important support level at that time, it will be probably the level which will be able to hold this coming decline in check providing us with an favorable buying opportunity.
Based on the information that we have right now it seems that betting on lower prices of metals in the short term could be profitable, however, we believe that using put options (November ones appear suitable) with limited part of one's speculative capital is the only way to go. Using other speculative vehicles doesn't seem appropriate from our point of view and - if you do not plan to use options - we don't suggest opening any speculative position here.
The magnitude of recent upswings and downswings has been rather amazing when reviewed over a two to six month period. For example, the Euro Index rose over 6% since August 1st while the USD Index declined more than 5% during the same period. Gold rose nearly 14%, silver 20% and stocks less than 0.5% during the same time period. Slow and steady seemed to be an obsolete term from the past when looking at recent market moves.
The multiple turning points which are at hand or imminent in many world markets are further evidence of the dependencies and interrelationships, which have formed in what at first may seem unrelated areas. It is quite true that when the Bank of Spain has a liquidity problem, the price of silver could very well be impacted immediately. Such is the case when the all global economies are so interconnected. We saw such an example, albeit temporary this week when Japan devalued the yen on Tuesday. World markets immediately reacted.
This further contributes to the increased risk of speculative capital being invested for the short-term.
It almost has to be expected that something, which has never happened before will soon make front page news world-wide. Such is the world we live in.
This completes this week's Premium Update.
Thank you for using the Premium Service. Have a great weekend and profitable week!
Sincerely,
Przemyslaw Radomski


