
This week it's all about China with a bit of Seoul searching at the upcoming G20 meeting in South Korea where the issue of currencies is likely to loom large.
Tuesday China surprised many investors by raising interest rates sparking a world-wide sell-off in stocks, precious metals and emerging-markets currencies. Gold prices declined sharply on Tuesday, losing more than 2% in the international markets but recovered some of the losses on Wednesday. Thursday gold prices closed with a loss of 1.41% and at the same time silver went down by more than 3%. Investors lowered their expectations for Chinese growth, seen as a key driver of the global economy.
Many observers say China's move to raise key rates is a classic Economics 101 textbook response to the country's dangerous property bubble, strong growth and rising inflation. More increases are possible as China will continue to try to slow the frenzied borrowing that eased the pain during the recent recession.
Allowing the yuan to rise could slow the economy's heated growth just as effectively as raising interest rates, but China doesn't seem interested in a quick yuan appreciation. This is true despite loud complaints from the U.S. and Europe and just about everyone else that its currency is too cheap - at least 40 per cent too cheap - giving it an unfair trade advantage.
The rate move comes just days before finance ministers and central bankers from the Group of 20 industrial and developing nations are to meet in Seoul where currency issues are sure to be the top agenda.
In most economies, higher interest rates attract foreign investors looking for better returns and the money flooding into the economy usually boosts the local currency. But China's economy is mostly closed, limiting the impact of higher rates on the yuan.
As we have written before, the currency war is a sticky issue that just won't let go. Tensions have been building as a result of the money flooding into emerging markets, driving up the currencies of countries such as Brazil and South Korea against the dollar. Because China pegs the yuan to the dollar, exporters in those countries have been losing their competitive edge against China, their chief rival in the global markets. In response, many governments are taking measures to lower the value of their currencies.
This week Brazil raised the tax on foreign investment in Brazilian bonds and South Korean's government is considering reinstating a withholding tax on foreign investors' holdings in some Korean securities. In Japan, where the yen has risen sharply against the dollar in recent months, the country's finance minister expressed on Tuesday his renewed concerns over its strength, declaring the government's readiness to intervene in the currency market. Also Tuesday, Canada's central bank halted a string of interest-rate hikes it started in June, warning that international currency tensions could hamper global recovery. Thailand announced a new 15% withholding tax for foreign investors in its bonds.
Is China Hoarding Silver?
China is the world's largest producer of gold, but it has plenty of other precious metals and rare minerals as well. Some in the world are already worried about so much power concentrated in one place.
A Bloomberg Report this week stated that silver exports from China, one of the world's largest, may drop about 40 percent this year as domestic demand from industry and investors climbs. China is the third-largest producer after Peru and Mexico. It is expected that reduced exports will boost prices. Industrial applications for silver, including electrical conductors and batteries, represent about half global demand. Silver has rallied 44 percent this year, outperforming gold and copper.
How About Rare Earth Minerals?
In addition, China, which has been blocking shipments of crucial minerals to Japan for the last month, has also halted some shipments to the United States and Europe. These rare earth minerals are crucial to manufacturing many advanced products such as radar, cell phones, high-powered magnets and mini-hard drives in laptop computers. China's control of them and its willingness to flex its economic muscles seem certain to further intensify trade and currency tensions. The bad news is China mines 95 percent of the world's rare earth elements. If restriction on exports of these minerals continues, it could force multinational companies to produce more of their high-technology goods in China.
The U.S. Congress is considering legislation to provide loan guarantees for the re-establishment of rare earth mining and manufacturing in the United States. Still, it will take three to five years until these new mines reach full production.
China reduced in July its export quota for rare earths for the second half of the year by 72 percent. Exporters had only six weeks' of quotas left when China imposed its unannounced embargo on shipments to Japan.
The Big Mac Proof That Yuan is Undervalued
If we needed any proof that the Chinese yuan is 40 per cent undervalued, we finally got it from the Economist. The magazine's famous Big Mac Index compares the prices of a Big Mac in various countries making exchange rate theory more easily digestible.
The Economist reported that in China a McDonald's Big Mac costs just 14.5 yuan on average in Beijing and Shenzhen, the equivalent of $2.18 at market exchange rates. In America the same burger averages $3.71. The average wage is higher in the US, so theoretically Big Macs can be more expensive, but still, the discrepancy is clearly visible.
That makes China's yuan one of the most undervalued currencies in our Big Mac index, which is based on the idea of purchasing-power parity. This says that a currency's price should reflect the amount of goods and services it can buy. Since 14.5 yuan can buy as much burger as $3.71, a yuan should be worth $0.26 on the foreign-exchange market. At just $0.15, it is undervalued by about 40%.
Next thing they'll be calling it the McCurrency Wars.
To see how precious metals are behaving with all the hoopla going on with currencies, let's begin this week's technical part with the analysis of the USD Index. We will start with the long-term chart (charts courtesy by http://stockcharts.com.)
USD Index - Euro Index
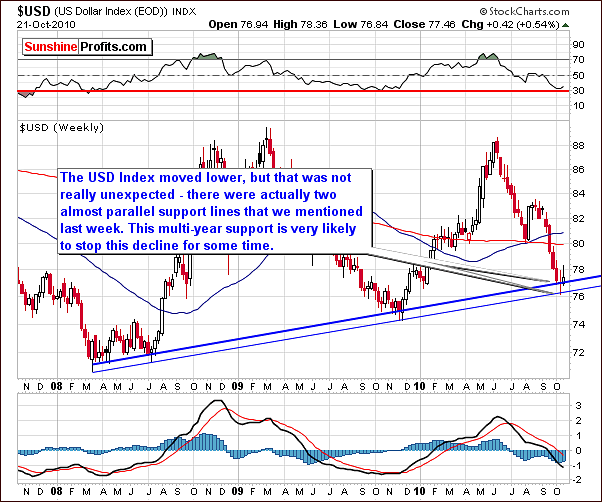
Once again, we begin this week's Premium Update with the USD Index chart. We will have one supplementary Euro Index chart at the end of our currency section. The USD Index did move lower this week as expected and it seems that the bottom was formed at the rising support level as discussed in our previous update. Further confirmation comes from the RSI, which is close to the 30-level at this time, thus indicating are relatively oversold condition.
Taking daily prices into account (see the chart below) the RSI level is worth watching over the next few weeks as it will likely move above 50 before the next local top is seen.
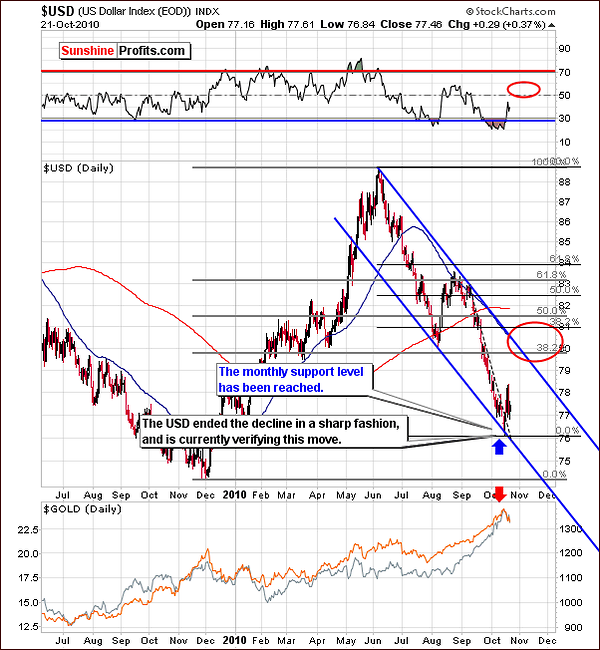
USD Index levels will likely rise to around 79.5 - 81 or possibly a bit higher. These levels are calculated based on Fibonacci retracement levels from the December-June rally and the June-October decline.
So which target is the most accurate one? This is a tough call at this point in time. It is a reasonable assumption to expect 80 as a likely top with 81.5 very unlikely to be surpassed. It is important to note here that since the USD Index is likely still far from its top, metals are probably far from their bottoms as well.
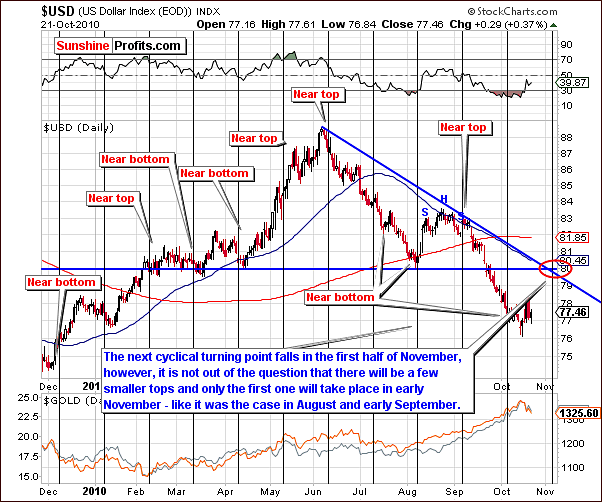
The week's short-term USD Index chart allows us to estimate the timing of the next local top. Although it may be seen in early November, this may be but the first of several local tops to be seen over several weeks or more. Please note the patterns of this type recently seen in August and September.
The most important point here is that further USD Index strength is expected in the coming days and weeks. This will have far-reaching effects on other currencies and world markets as well as upon gold, silver, and mining stocks. These implications are the basic theme throughout this week's Premium Update.
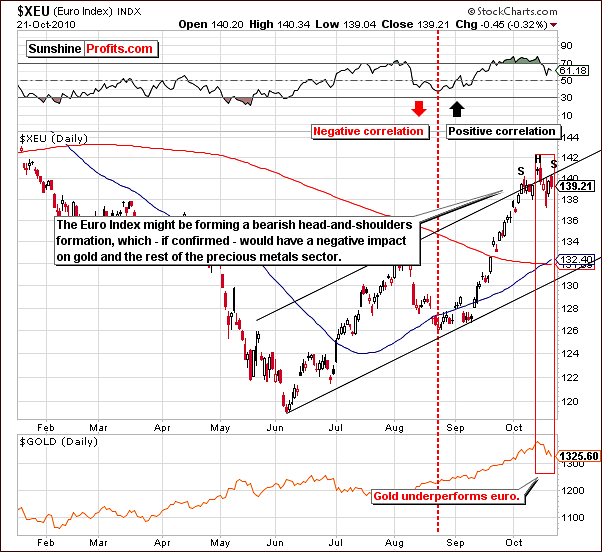
The short-term Euro Index chart further confirms USD Index strength. The bearish head-and-shoulders pattern with the letters S-H-S illustrating key parts thereof shows that a decline to the 134 - 136 area is likely. This is bearish news for gold, which has moved in tune with the Euro Index recently.
Gold is now underperforming the Euro Index. Evidence supporting this can be seen with very recent increases in the Euro Index level not being accompanied by movements in gold prices. Although gold moved up slightly, it then declined.
Summing up, USD Index levels are likely to rise in the short-term while Euro Index levels will decline. This is bearish news for gold, silver and mining stocks and the general stock market as well in all likelihood.
General Stock Market
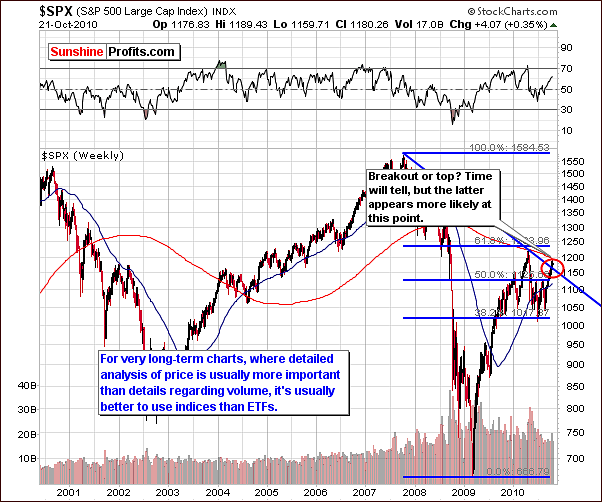
The week's very long-term general stock market chart shows a possible breakout above the declining resistance line. However, this could also be a local top should the breakout not occur and the rally end here. The 200-week moving average is a factor as well and for several reasons, our feeling is that the true breakout will likely not be seen. It appears at this time that the local top is close if not already at hand.
The long-term general stock market chart this week clearly shows a bearish volume-price relationship. That is to say, declining volume accompanies rising prices and strong volume is seen when prices decline.
High volume levels with rising prices would need to be seen in order to change the currently prevailing bearish sentiment. Note that this was the case as recently as early October but is not seen today.
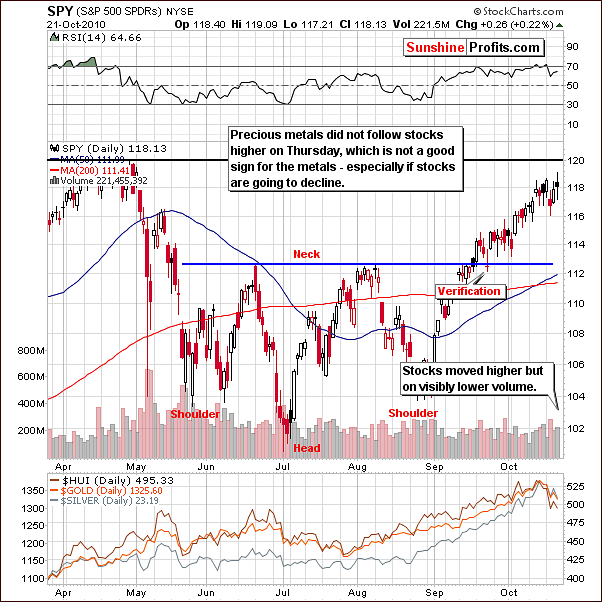
In the previous weeks, we stated that the SPY ETF could move to the 120-level. Given the fact that precious metals declined on Thursday while stocks rallied, such a move will likely have limited impact on precious metals and may therefore no longer be an important factor.
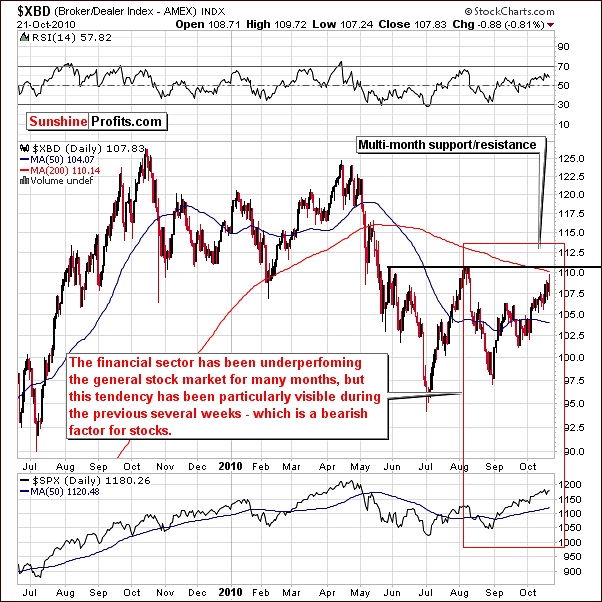
This week's Broker Dealer Index chart confirms the upside limitations for gold, silver and mining stocks. As a proxy for the financial sector, it is clear that the August to October rally for stocks has not carried over to the financial sector. This situation has been seen for several months and especially in the past few weeks.
Non-confirmation of a bullish sentiment for stocks remains and although prices may move higher temporarily a downturn is likely. The 113-level as an initial downside target for the SPY ETF is not out of the question. Where does it go from there? The Hindenburg Omen (long-term sell signal) suggests lower prices in the following months. We will know more after we examine the way stocks decline - of course we have to see them decline first. The implication for gold, silver and mining stocks are neutral for the next few days but bearish for the next several weeks.
Summing up, the general stock market is likely to end its recent rally and go through a period of consolidation and a price correction. Although the timing of this correction may be delayed somewhat, it is likely to be seen in the next several days. This will have bearish implications for gold, silver, and mining stocks.
Correlation Matrix
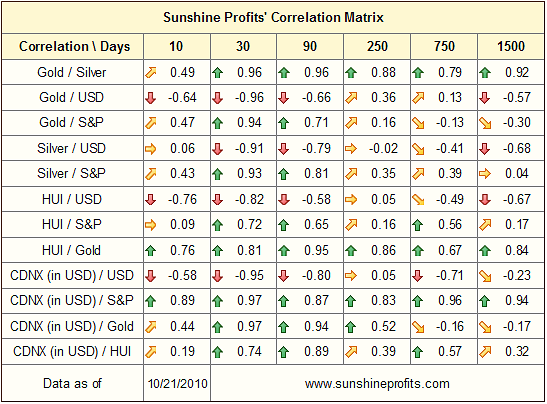
The Correlation Matrix this week shows strong short-term correlations in the 30-day column. This basically shows how the markets interrelate and is slightly different than the 10-day column, which is more relevant for USD driven markets. The exception is the silver market, which is still more correlated with the general stock market than with the USD Index, but this correlation has been declining significantly as silver moved lower despite stocks' small gains.
This week's coefficients confirm points made earlier with respect to the general stock market and USD Index. This is of upmost importance to Precious Metals Investors and Traders.
Gold

In the very long-term chart for gold this week, we see declines have moved lower after having touched the long-term resistance level, the upper border of the very long-term trading channel, marked with thick blue line. This is not surprising as a breakout above resistance of this strength is not expected on a first attempt. After that, we look forward to see this trading channel to accelerate.
It now appears that the rally has been held and although a correction is surely underway, it is barely visible in this chart. The decline is simply not severe enough to be clearly seen from a very long-term perspective. This could be also an additional indication that the price did not fall enough.
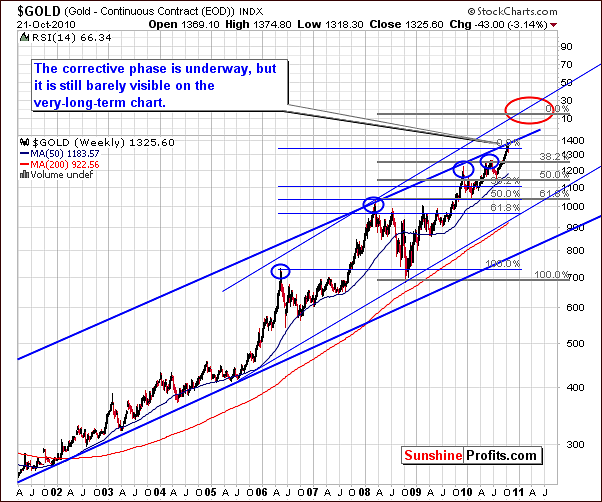
The long-term chart for gold allows us to illustrate likely target levels for the near-term. We have not changed our sentiment or the target levels themselves, as further declines appear likely. Fibonacci retracement level analysis points to two important downside target levels. These are seen in our chart marked with red ellipse.
The first long-term support line may appear to have stopped the recent decline. This is however unlikely as it is but a minor support line and quite weak. We can see that it has been broken through on several occasions in the past. This was seen in August and September and for this reason, it is unlikely to have anything more than a slight, temporary effect upon the declining trend.
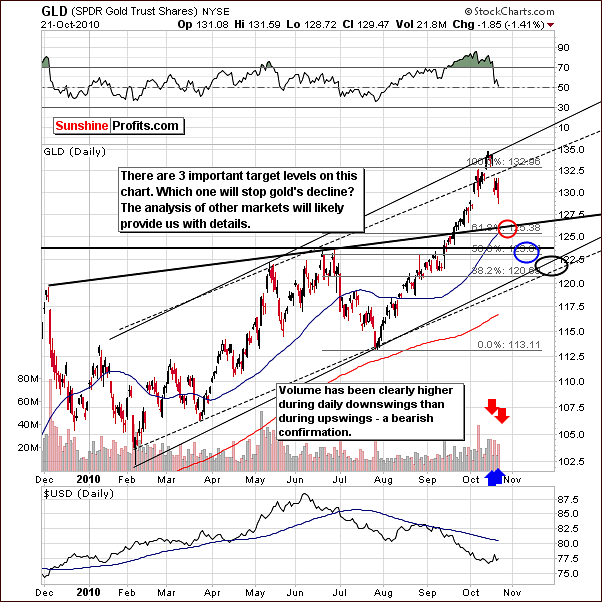
This week's short-term chart illustrates three target levels, which have not changed from last week. They are still in range from approximately $121 to $125.5 in GLD ETF, which are corresponding respectively to around $1240 and $1285 in spot gold. As we have discussed previously, the general stock market and USD Index will most likely ultimately influence gold's price movement to align with one of these target areas. We cannot rule out the possibility that all three levels could be reached at some point.
The short-term decline could be quite sharp and possibly move back up after reaching the first target level. A rally to new highs is possible. More likely, however, is a period of price correction and consolidation as gold gathers strength to again move higher. It is important to note here that this could take a while. Note that although we originally anticipated this decline to be very short-lived, this may not be the case, as the precious metals market moved much higher and just a few days of lower prices does not appear to be enough to cool down market's emotionality.
Recent volume levels, which have been lower when prices rise and higher on price declining days are further confirmation of the bearish move, which appears to be in place. Speculative investors may wish to add to short positions especially in gold when seeing another daily upswing on very low volume, even lower then that seen on recent up-days - we'll let you know if we believe that is a good idea.
Recent price gap in GLD ETF (noticeable around the price level we are right now) is support level by itself. But even if price will move back up it will most likely only create a short-term bearish head and shoulders formation, starting in the beginning of October and ending right now. Providing that the upward move is minimal (not higher than intra-day highs) and accompanied with low volume, the head and shoulders pattern would likely bring prices to the red target level in our chart. This would also be a signal to add to short positions if so inclined.
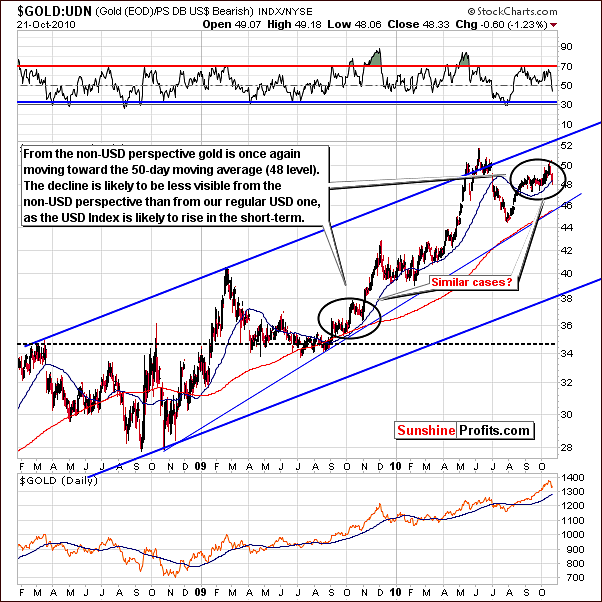
The non-USD chart for gold shows that recent trends are quite similar to what was seen towards the end of 2009. Price levels have been also moving toward the 50-day moving average, which is close to 48 at this time. The fairly common pattern of rally correction and then a major move upwards could very well be seen again.
The decline of gold's price from a non-USD perspective will likely not be as sharp as its decline in dollars. With the USD Index likely to rally soon, gold's decline in USD will appear smaller since the dollar's value will be greater.
The non-USD ratio has traded in a narrow range for some time and the lowest likely target level appears to be close to 46. Investors may wish to speculate on short-term declines but these do not seem to be large enough for exiting long-term investment positions at this time.
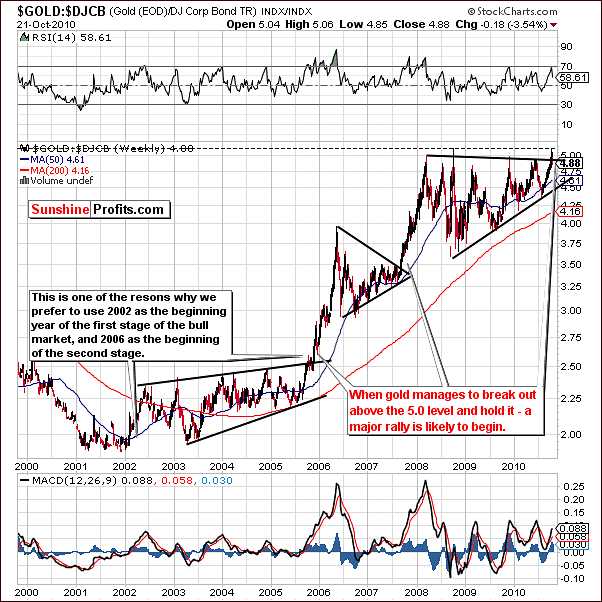
Our fifth and final gold chart this week is the result of our Subscriber's inquiry. The ratio takes gold's price and divides it by the Dow Jones Corporate Bond Index. Since gold has outperformed this index for the past several weeks, the ratio has been attempting to reach new highs but has thus far failed. No severe declines have been seen either.
The chart we have created covers the whole bull market period for precious metals. This allows us to see how the Gold-DJCB ratio has performed in the past. Note that breakouts have been seen followed by sharply higher values from one consolidation period to another. The next big rally may indeed be upon us - if the ratio manages to decisively break above the 5.0 level. Please note the pattern of this ratio during 2006 and 2008 rallies.
After a consolidation period, a ratio greater than 5 could indicate a major rally if such a level is held for several days. No breakout has been seen yet and the rally has therefore not been confirmed. Conclusive calls can only be made after this is seen. In the past the sharp move upward in gold, silver and mining stocks coincided with the breakout in the ratio.
This chart also precisely explains why we often refer to the 2002 as the beginning year of the bull market, not the 2000. It is also clearly visible why we see the 2006 as the beginning of the second stage of this bull market. This is when the major breakout materialized (it was also the time when gold's rally became visible from the non-USD perspective).
Summing up, gold prices are likely to rise in the medium-term (months are concerned here). It is likely however that in the short-term (next couple of weeks) we will see a period of consolidation and possible further price declines.
Silver
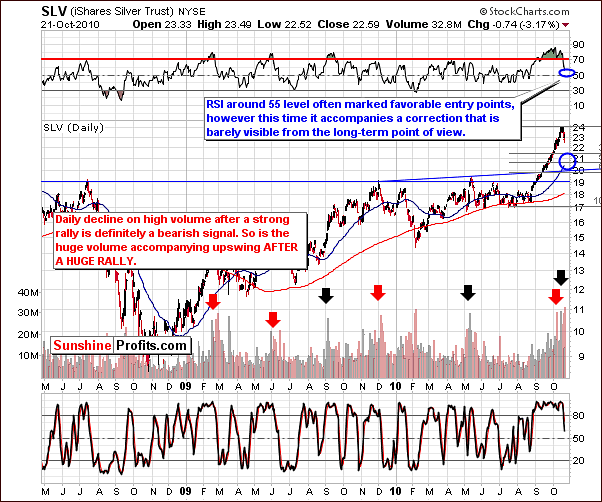
In this week's long-term chart for silver we see that the recent rally appears to have been stopped at the $24-level. Based on past patterns a target level around $20.50 (around $21 for spot silver) is likely for the current price correction and consolidation period.
Huge volume levels on upswings after a huge rally is a bearish signal. This was seen in recent days prior to the local top. We also wish to note here that the bearish points made in earlier updates in place also for silver.
Last week, we stated that an RSI level of 55 would indicate a favorable buying opportunity. However, with the bearish sentiment currently in place for the general stock market and gold, the RSI alone is not sufficient to warrant such action. As stated many times in the past, silver's trend frequently follows stocks due to its industrial uses and it follows gold due to its precious side. The trend of the general stock market must also be considered regardless of the indication gleaned from the RSI.
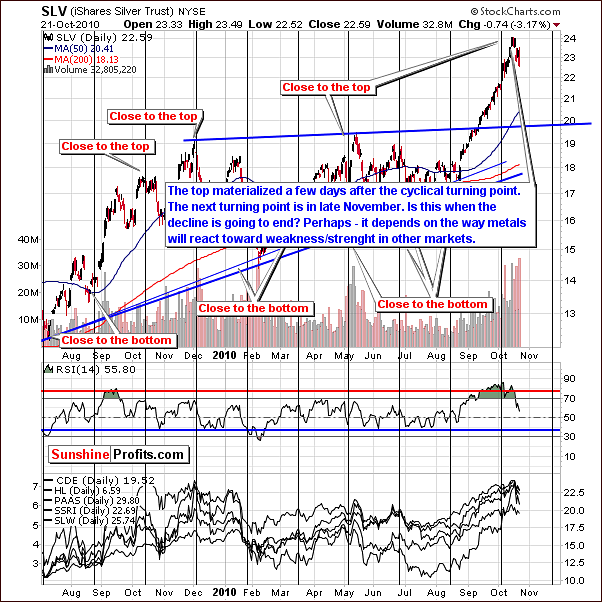
The week's short-term chart shows that, as expected, silver reached a local top a short time after the turning point illustrated by the black vertical line in this week's chart. The next turning point, a local bottom, seems to be about a month away. We expect this will be seen most likely in late November.
Silver's decline could actually be greater than currently projected due to the fact that its recent rally exceeded expectation as well. Its reaction to other markets will likely determine the ultimate bottom for the current downswing. The general stock market trend in the coming weeks will have a significant impact upon how low silver's price declines.
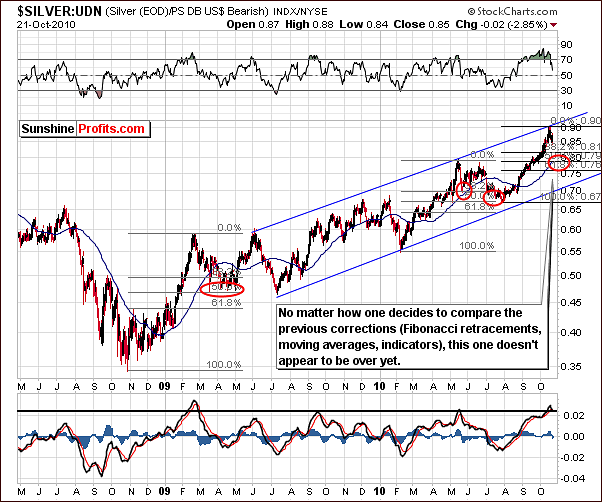
This week we have included a chart for silver from a non-USD perspective. It is important to note that all target levels in this chart are based upon combined analysis tools such as a 50-week moving average, past trends, MACD and Fibonacci retracement levels. We have comparison between this rally and the previous ones. Silver used to correct from Fibonacci retracement levels of 38.2% and 50% of the previous upswing. We are not even close to these levels. We have seen silver approaching 50-week moving average, which is clearly not the case right now. Finally we have seen the MACD to be much below the horizontal black line in the past.
Since silver is not close to any of these at this time, it is likely that the bottom has not been reached.
Summing up, silver's price is likely to move higher eventually but numerous indications point towards price declines before we see any rallies in the future.
Mining Stocks
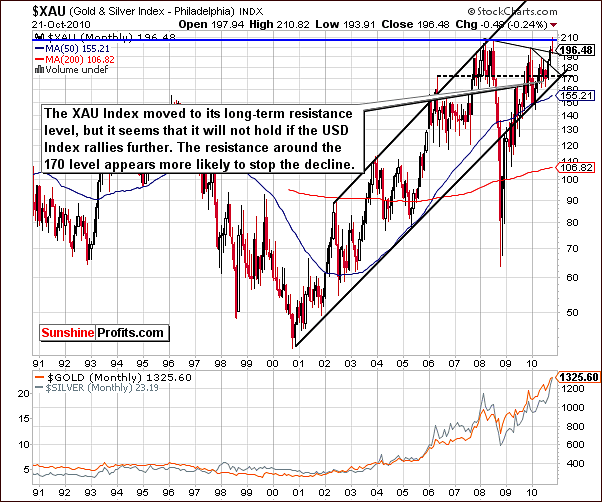
The XAU (gold and silver stocks index) Index failed to break into new highs - as visible on the very-long-term chart above. Although we see it presently at a declining support level, we don't expect this level to hold given declining gold, silver and stock prices.
Support levels such as the lower border of the trading channel, previous local tops, and multi-year support levels are also in play. The declining, short-term trend line has been broken recently most likely due to the USD Index rally. The area around the 170 level appears to be the probable bottom for the current decline.
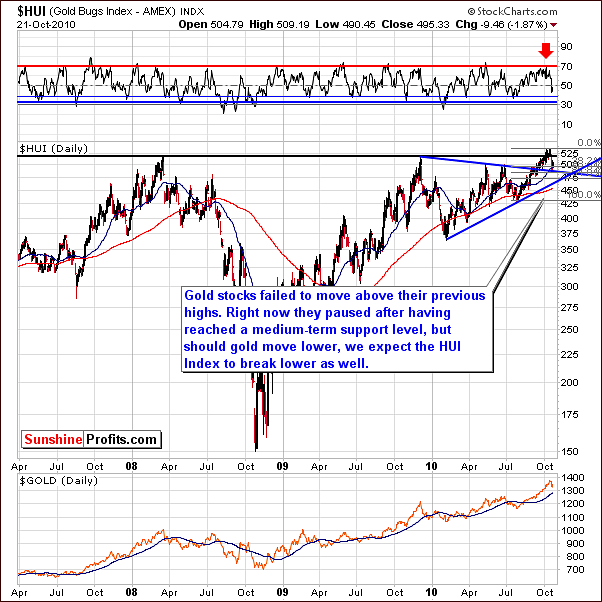
In this week's HUI (gold mining stocks index) Index chart, support levels have been reached. The 38.2% Fibonacci retracement level and the 50-week moving average are in play. The decline has paused at medium-term support levels and is currently close to a declining support line. If gold's price declines further and additionally stocks move lower, mining stock index levels will likely fall as well. At this point we cannot rule out reaching the 450 - 470 area for the HUI Index.
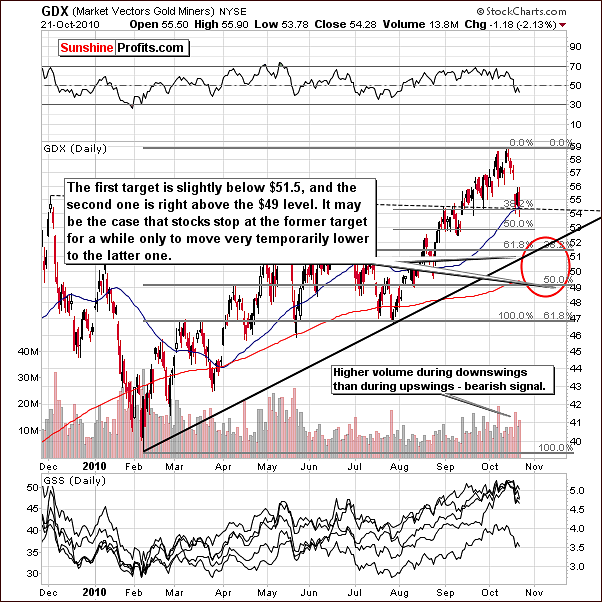
The GDX ETF (another proxy for the precious metals mining stocks) chart this week has new target area identified due to the huge decline seen recently. Consequently, if the gold is going to decline as much as it did, than the GDX ETF is most likely going to also move lower as much as it did. Especially if the stocks are going to decline as well.
In this week's Market Alert, we discussed betting on lower prices for traders using options. Lower prices in mining stocks may be the way to go due to their lower volatility. Their close trading range has caused a decline in option premiums.
In the research section of Sunshine Profits website, Predicting and Taking Advantage of Corrections in Gold is an essay, which is perfect for our current situation. Options traders should be sure not to miss this instructive piece.
Volume levels have confirmed that price declines are likely. Targets are based upon Fibonacci retracement levels created from February to October rally and July to October rally, as well as the rising support line based on the February and July bottoms. The first target level is slightly above $51 and the second at approximately at $49.5. As was the case with gold, the first target level is much more likely to be seen with the second, a calculated possibility.
Summing up, it is likely that mining stocks will eventually rally but a corrective period will probably be seen first. Lower prices are likely to be seen in the short-run with a rally to follow perhaps before the end of the year.
SP Indicators
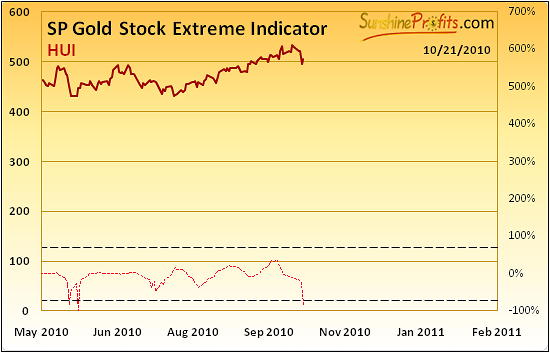
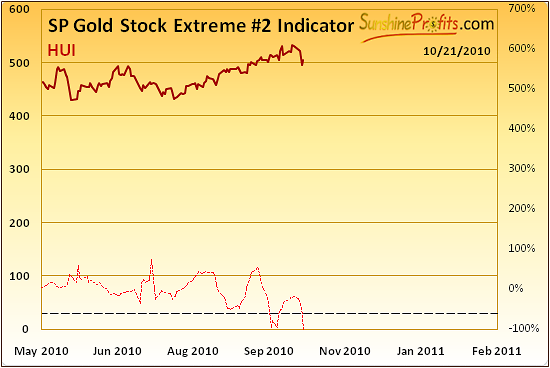
This week we have decided to include 4 of the Sunshine Profits Indicators. The first two charts above send three signals and give us one important development. There is, however, no clear indication at this time. Much depends upon whether this top was indeed a major one (we believe it is likely). If that was the case we might see this signal flashed as a confirmation for the top. However, we might see this also as an indication of a very-short-term bottom, which would mean that the metals and mining stocks could move higher in a day or two (thus creating a bearish head-and-shoulders formation in gold).
If very weak volume is seen during an upswing, the opportunity to add to short positions will be present. Furthermore, if volume is low, it should not be of concern even if higher prices are seen for a few days.
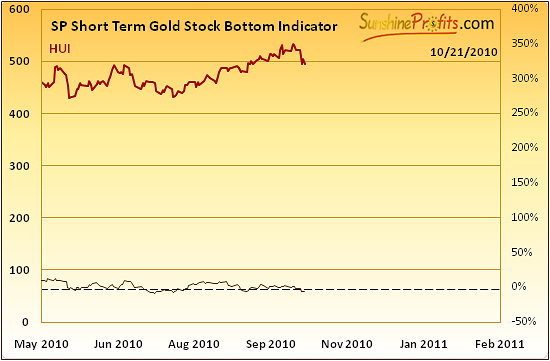
The Short Term Gold Stock Bottom Indicator gives a buy signal at this time. This confirms points made about the general stock market earlier. If stock prices rise, metals consolidate. If mining stocks move higher in a few days on low volume, it will most likely be an opportunity to add to one's short positions. We will let you know if we believe that is the case.
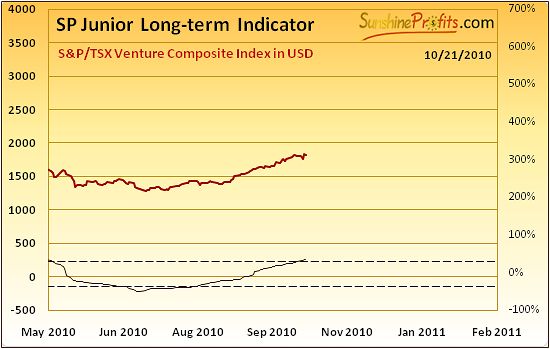
The SP Junior long-term indicator did not flash a sell signal (meaning switching from junior mining stocks to big senior gold and silver producers) yet, but since the indicator is presently above the horizontal dotted line, it is worth a closer look. As soon as a move lower in the general stock market (and juniors) will be seen and this indicator starts to decline, it will be a sell signal for juniors. We generally suggest using it to switch from juniors to seniors, but of course you are free to utilize this bearish junior signal in any way you see fit.
Letters from Subscribers
This week we would like to begin with our comment to an audio file we received from one of our Subscribers. Our take is that there are many different scenarios in which this economic turmoil can play out. The scenario mentioned in the audio file in which the Fed wants the gold price to rise is a bit surprising but we cannot rule it out. If this is the case, it is very bullish for gold because if the Fed is a hidden gold bull, it is yet another good reason why we should bet on long term rising gold prices.
The next question is could the falling PM prices be a replay of this year's January action and wouldn't it be a great shorting opportunity? Yes, it could be more or less a replay of declines we saw in the beginning of this year. Naturally, we are monitoring the situation and trying to provide you with as much information as possible.
Finally we would like to comment on theory that "perhaps this correction" is little more than a momentary pause appearing as brief range-bound sideways activity. Articles like Peter Schiff's article make the point that we may have entered a new phase in this bull that defies the patterns established in the past during more stable times. Our take is that we prefer to wait for a confirmation that the old patterns won't work instead of simply believing "that this time it's different." More on that in the following part of this section.
The last issue that we are going to comment on this week is going to be a bit less market-related than what you used to read in this section. Our Subscriber writes that our weekly updates comment on the consistency of human nature as the foundation for our analysis. Yet, human nature is precisely the engine that is now pushing gold to behave in a manner quite outside the patterns that defined previous years. Isn't it logical to assume that the patterns of old will yield to human nature's reaction to a new world financial context? A context founded in fear, uncertainty and doubt? Perhaps expecting corrections to behave as they always have in the past no longer makes sense as human nature reacts to a financial world gone mad?
This is a very interesting question, but please note that peoples' behavior (their actions) and the way they behave under various circumstances (their nature) are different things. Compare that to the difference between driving a car (action) and being a good driver (nature) or - in quantitative terms - to the difference between the x variable and the whole function translating x's into y's. While certain factors: massive quantitative easings, rise of Asian Economies, etc. - will influence peoples' actions in this way or another, they will not change the very basic, fundamental concepts of fear and greed (you may prefer to interpret the latter as "need of financial safety"), which are the ultimate forces driving markets in the short run.
At this point this commentary might start to sound more philosophical than market-related, but nonetheless, we would like to follow with this thought.
It was Heraclitus who said that "there is nothing permanent except change". I must admit I really like this quote, because it appears pure nonsense at first only to become obvious after a few moments. Everything in life changes - day turns into night, rain turns into sunshine, market rallies turn into declines and so on.
However, if one takes one step back and takes a look at virtually everything from a broader perspective, one sees that eventually everything starts over again (not always in precisely the same way) - night turns into day, sunshine turns into rain, and market declines turn into rallies. Given a consistency with the change one might indeed see it as constant - while day nor night are not constant, the fact that we have day after night and night after day - is.
Markets change in more complex ways than is the case with day and night, but that does not make the above useless - we just need to take a few steps back to see the whole picture. With enough "steps back" we can see decades of market data. Within that long period we see several new ideas about the economy, currency devaluation, high interest rates, low interest rates, inflation, deflation, disinflation, wars - in sum many factors causing excessive greed or excessive fear. Has the financial world now gone mad? If so, this isn't the first time that it has happened and it most probably won't be the last. We still see bull markets that consist of three stages that are divided into smaller up- and downswings. We still have declines and upswings taking place with regard to the 1.618 Phi number and so on.
In this way things change (various stages of a bull market, up- or downswings of different size) but stay the same (after the bull market comes the bear market just like a day after the night) at the same time.
The point is that if gold moves above its previous trends it will not be something "new" and thus rendering previous observations useless. If gold establishes a new trend and verifies it, we will be able to apply other techniques, moving averages, ratios etc. - but until that happens we need to stay with the proven methodology. We believe that most people would not want to switch from a reliable, comfortable and economic car to a new prototype until the latter passes appropriate tests - and we have an analogous situation with the way we approach the market.
Summary
Strong correlation values suggest analysis of the USD Index and the general stock market is of utmost importance. This is a most important influence and factor for precious metals investors to monitor regularly.
The USD Index will likely rally in the short-term and stocks may decline in the next few days. This has bearish implications for mining stocks and precious metals.
Gold, silver and mining stocks may move higher for a few days and a head and shoulders pattern may be developing in the yellow metal. If low volume levels accompany this small upswing, we may have another good opportunity to add to our short positions. Subscribers will be informed as this situation develops.
We continue to feel that the time has not arrived for selling long-term holdings - it is only during particularly favorable occasions when this part of one's capital should be touched, and we are not yet there. Again, this may change if we get higher on tiny volume, but we have yet to see this type of development. As always, we will continue to comment on this topic and all pertinent issues in order to maximize opportunities for both Traders and long-term Investors.
This completes this week's Premium Update.
Thank you for using the Premium Service. Have a great weekend and profitable week!
Sincerely,
Przemyslaw Radomski

