
We have been away for a week, but with long-term positions in precious metals we have gladly grabbed on to the golden bull in its run up past the psychologically significant $1,300 mark in a surge that has confounded skeptics and turned some bears into bulls.
The recent run up has caused analysts to make various pronouncements in the press about where the price of gold is going. Calyon Credit Agricole last week raised its three-month outlook to $1,350, from $1,260. Deutsche Bank on Tuesday said $1,600 an ounce isn't out of the question for 2012 and added gold wouldn't be in a bubble unless it hits $2,000. Barrick Gold, the largest gold miner, said prices could "easily" top $1,500 next year.
One gold bear, Julian Jessop, chief international economist of London research firm Capital Economics, who had expected gold to fall back to $1,000 by year end finally changed his mind last week. Mr. Jessop now says he expects gold prices to "stay high for several more years," amid heightened "fears of runaway inflation or a dollar collapse."
Gold and Inflation
If inflation was measured using the same method that was used in the past, it would be much higher than reported today. Using the gold price of 1980 and the inflation measures used at that time, the gold price should be over $6,000. With that perspective, the $1,300 level gives us much more room to grow.
Speaking of inflation, Bloomberg news reported last week that "Bill Gross's PIMCO made an $8.1 billion wager" against deflation. Gross is willing to risk billions on the idea that inflation will return to the U.S. in the next 10 years. Since Bill Gross is known as the Bond King and manages the PIMCO Total Return Fund - the world's biggest bond fund, with a quarter-trillion dollars in assets, it makes good sense to pay attention. If the Fed will crank up the printing press, the best investment is to hold on to our gold positions. The Fed can print dollars. It can't print gold.
The Gold Story is Everywhere
We are continuously asking our friends to send links to stories on gold that they encounter in their daily excursions on the Internet. These are people who do not follow the financial markets. We wanted to get an indication of how many gold stories ordinary folks are encountering. Upon returning we had almost 200 e-mails in the inbox among them several links to gold stories sent by our diligent friends. Even before zealously tackling the charts and tools, this made us think that the recent run up is not the start of a big runaway rally that would take us to $1,500 - a correction is needed first. If friends are seeing so many gold stories, so is everyone else. It is the golden bull's primary and somewhat malicious objective to shake off as many investors as possible trampling them in the process. (This is why we usually urge our Subscribers to hold on to long-term positions and enjoy the ride - only a powerful combination of multiple strong bearish signals would make us consider selling our long-term positions.)
There are stories in the press like the one about the US Mint's recent announcement that it has run out of one ounce Gold Buffalo coins. Even the fact that the US Buffalo is priced about 20% over spot, and was last sold for $1,560, has not stopped the flood of retail buying. Gold wholesalers are raising premiums on gold coins and some are out of stock.
Gold is particularly attractive since the Fed has cut interest rates essentially to zero. Gold is more attractive than money in the bank since you earn zero percent on your cash in the bank, and earn zero percent on your gold. By holding gold today you don't give up any interest on your cash and you don't give up any "missed opportunity cost."
But it seems that gold will need to consolidate before going higher. Once the correction is done, it's not out of question that the price of gold will reach $1,500. I seriously doubt that the recent run up is the final stage of the bull market. In fact, it seems that there are several more good years. We're looking forward to it, especially in silver.
The Looming Currency Wars
Gold's latest leg up was sparked last week when the Federal Reserve said it would consider buying more Treasury bonds to crank up the economy. Gold is glittering amid uncertainty over central banks' ability to revive their economies-including whether their efforts to do so will tend to undermine their currencies. Weakening currencies add to the attractiveness of gold as an alternative store of value. The war of words between China and the United States, and Japan's present requirement to sell its own currency to push down the yen's value, are also indicators of a broadening monetary crisis. Two weeks ago, Japan devalued the yen, its first intervention in currency markets since 2004. The finance minister of Brazil, whose currency has soared in value, warned Tuesday that an "international currency war" was under way.
The U.S. Congress sent a sharp warning to China this week, overwhelmingly passing a bill that could lead to punitive tariffs on a broad range of Chinese imports. The lopsided 348-79 vote marks Congress' most assertive move yet to hold China accountable for manipulating its currency to gain a trade advantage. With most GOP members joining the majority of Democrats, the vote demonstrated that punitive action against China is likely to remain popular no matter which party controls the House next year. A weaker renminbi - estimated to be undervalued by as much as 40 percent - makes Chinese exports cheaper and foreign imports more expensive.
In the past, Beijing has responded to such tactics by allowing its currency to rise gradually in relation to the dollar. Lately, though, efforts at prodding the Chinese to revalue their currency have met with little, if any, response. China has become a self-confident actor on the world stage.
In Go(l)d We Trust
In the U.S., the concern is that if the Federal Reserve pumps more money into the system, its efforts might hurt the value of the dollar and possibly stoke inflation, two events that would drive demand for gold. Yet some investors are buying gold on concern that stimulus measures might fail, leading to even deeper problems for the global economy.
For many people buying gold is based on the lack of faith in conventional currencies. If the U.S. currency has the phrase "In God We Trust" printed on every dollar, some would like to see an additional statement similar to the original one - with the letter "l" added to the word "God."
From such lofty matters we begin this week's technical part with the analysis of the Euro Index. We will start with the long-term chart (charts courtesy by http://stockcharts.com.)
Euro and USD Indices
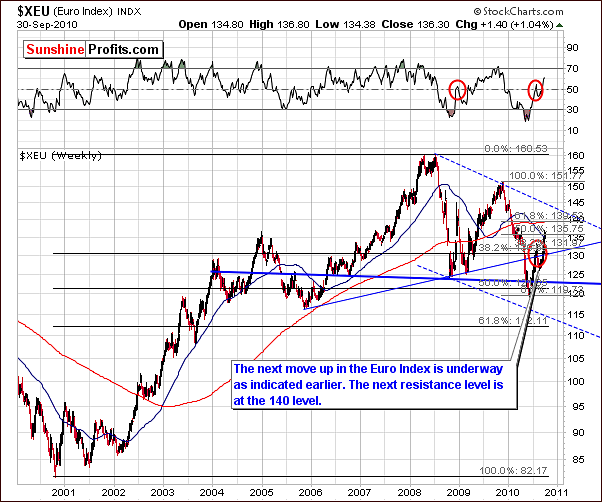
Since our update two weeks ago, the Euro Index has continued to rally as expected. The consolidation period, which ended several weeks ago, has been followed by a consistent upswing. The expected target for this rally is around the 140-level, which is also close to the 200-day moving average. Obviously the rally is expected to continue since this target is above today's closing level. This also means further short-run declines for the USD Index as will most likely be seen on our next chart.
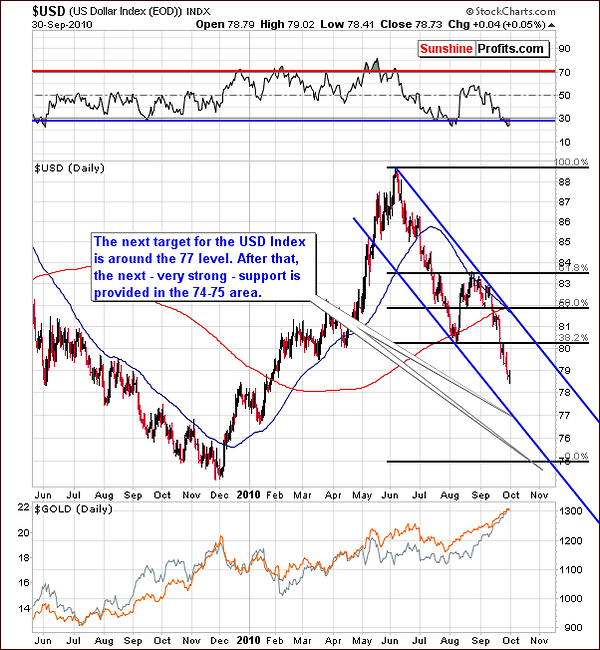
In the long-term USD Index chart, the recent downtrend is clearly seen and is bordered in the chart by the blue declining trading channel lines. We see a move below the August local bottom and also below the 80-level, which normally provides support. The target level for the current decline is close to 77 and a pullback/consolidation is probable once this level has been reached. This may be followed by further declines approaching the 2009 low, although perhaps ending slightly sooner - at the 75 level - when taking into account level pointed by Phi number applied to recent turning points.
The question remains - when? The short-term chart provides us with more details.
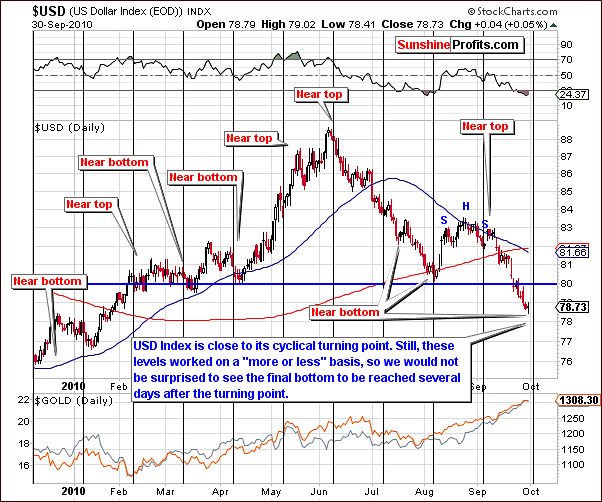
The short-term chart shows us more details and is useful for further identifying targets and discussing likely possibilities. The cyclical turning point is likely to be reached very soon although it may actually lag the vertical black line on our chart by several days. Such discrepancy is quite common and was most recently seen with the local top early last month.
The implications here for precious metals are generally bullish for the short-term. Once the USD reaches a bottom and reverses however, bearish sentiment could become temporary reality for gold, silver, and mining stocks. There is a possibility that the dollar may reverse soon; its turning point could be seen in the next week or two. Once this occurs, a big rally back to the 80-level is likely. Further discussion of precious metals implications will continue in our Correlation Matrix section later in this update.
Summing up, the USD Index continues to decline after completion of the recent bearish head and shoulders pattern. The Euro Index conversely has continued to rally. Although the exact timing for the reversal of these trends is not easily identified, it could possibly be soon. Expected target levels for the dollar and the euro are 77 and 140 respectively. There is a good chance these will be reached in the next week or two and the trends thus will reverse temporarily.
General Stock Market
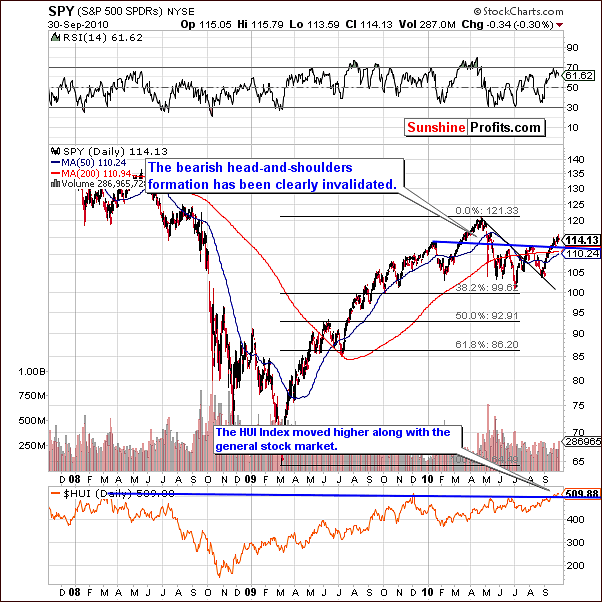
The long-term general stock market chart this week clearly shows that the bearish head and shoulder's pattern has been invalidated. Stock prices have moved to levels above both shoulders in the pattern and have stayed there for several trading days.
Although the rally at first glance may seem that it has quite likely reached its top, perhaps more analysis needs to be done. Recent daily declines have not been significant and the current level seems to be not enough backed-up to hold this rally in check. Further rise to the 120-level for the SPY SPDR is likely before reaching any major top. The RSI levels are still below 70, which is supplementary indication that this rally has not yet concluded.
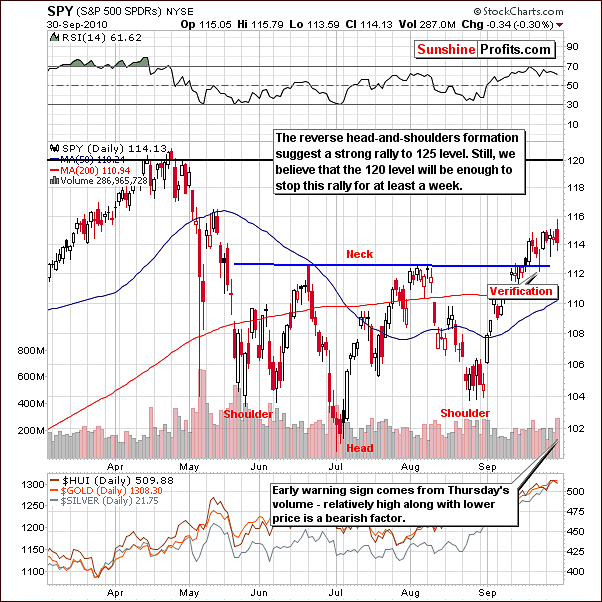
In this week's short-term chart, we see a reverse head and shoulders formation, which is a bullish indicator. The target level here has been calculated to be 125 and is obtained by calculating the span between head and neck in the pattern and adding it to the neck level. The 120-level however, also appears strong and may actually hold this rally in check.
One short observation needs to be made concerning Thursday's intra-day activity. Prices declined on higher volume, which is normally a bearish sign. At this point however, we simply take this to mean that something may be in the works and needs to be monitored, for example reaching 120-level with following huge decline, which would confirm what the "Hindenburg Omen" suggested couple of weeks ago . A single such occurrence should be noted but not yet deemed significant.
Summing up, most indicators support bullish sentiment for the weeks ahead and although a slight negative signal was seen on Thursday this week, it is likely that the general stock market rally will continue for the short-term.
Correlation Matrix
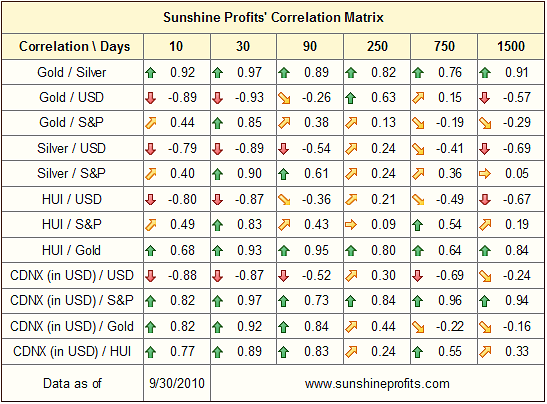
In the Correlation Matrix this week, we see that precious metals have once again moved to their traditional interrelationships. Gold, silver and mining stocks have been driven by the weakness of the dollar and show negative correlation with the USD Index. Furthermore, they are once again showing positive correlation with the general stock market. Silver is particularly correlated with the main stock indices, which is visible in the 90-day column and may explain last weeks' strong rally. The white metal seems to have benefited from being precious metal driven by gold and at the same time being industrial metal with its rally fueled by general stock market.
The USD Index decline is likely to reach a local bottom soon. The general stock market is expected to reach a local top soon as well. These turning points will likely result in local tops for mining stocks and precious metals and could trigger a consolidation soon thereafter. Silver would likely see a sharp correction, mining stocks a relatively soft one, and gold falling somewhere in between.
Summing up, with return to normal correlations between markets and sectors, it is possible that local tops likely to be seen in the Euro Index and the general stock market and also having in mind the USD Index is expected to end its recent decline and once again rally, will coincide with a local top for precious metals.
Gold
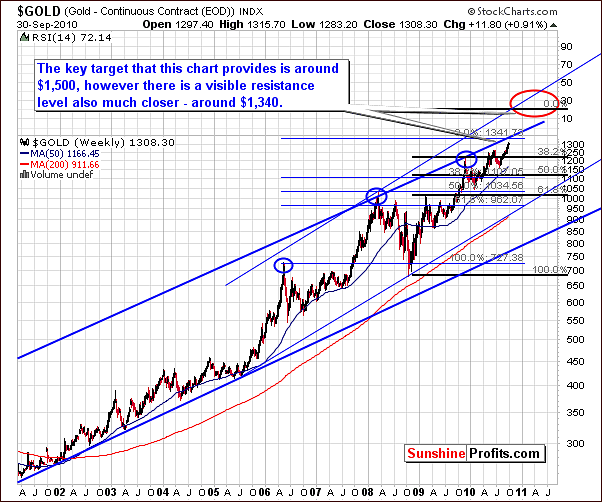
The very long-term chart for gold this week clearly shows how the early September rally has continued for yet another two weeks. It is important to note, however, that recent movement has been somewhat less than huge, that is, compared to previous mega-rallies. This is a positive sign that perhaps such an upswing can be sustained after a correction and it may be likely that much more of the rally is yet to come.
The new target level for gold has been set around $1,500. This is obtained by applying the 1.618 Phi number to previous local tops, specifically those seen in June of 2008 and June of 2010. This also coincides with the upper/steeper blue line in the above chart. Since it appears that we are indeed in the second stage of the bull market for gold, which began in 2008, the steeper rising trend channel seems the better choice for the long-term analysis at this time.
Before the lower, less steep line is surpassed, it is likely that gold will first reach a local top and then go through a quick consolidation. This will most likely result in a greater strength and increase the odds of a further rally being sustained. At this time, the local top seems to be most probable around the 1340 level. This is based upon the extrapolation of the span between the highs seen in 2006 and 2008. That is to say, if the percentage increase of 2008 over 2006 is repeated in 2010 as compared in 2008, $1,340 is the expected local top.
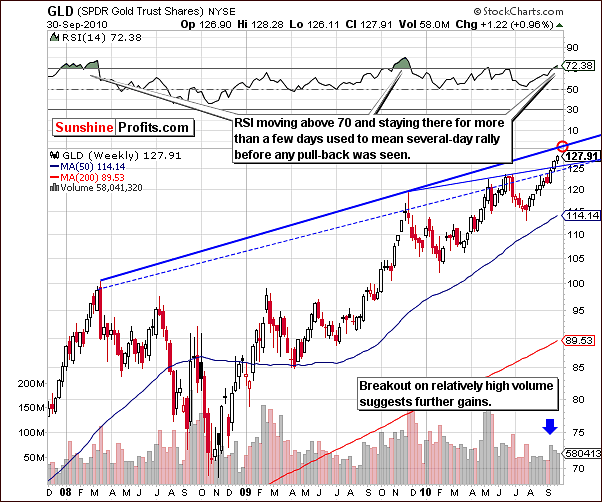
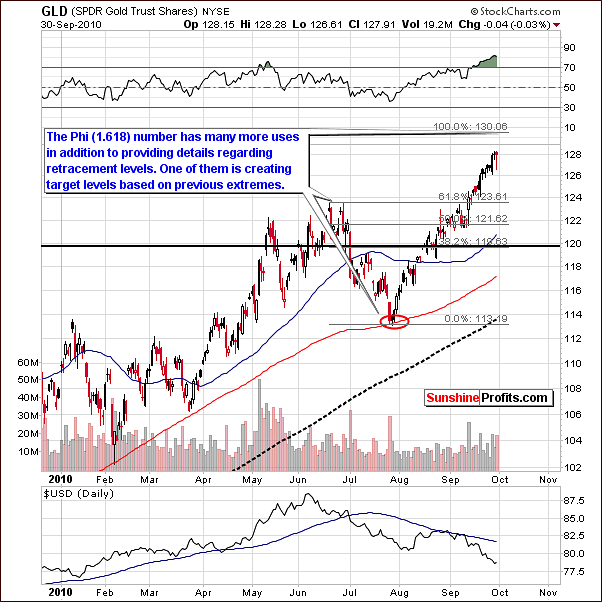
Another long-term chart this week is the GLD ETF and is shown for an almost-3-year period. Note that a resistance level is within range today. Short-term traders may want to take advantage of this move, however, we personally prefer not to chase the market but rather to remain patient and allow things to settle down, especially when the projected target is at hand.
It seems preferable to wait for the consolidation and add to one's position after it materializes, which is likely to happen soon. It is in our opinion the way to maximize the odds of long-term gain.
The RSI is currently shown to be at 72.38 in the above chart, which is based on weekly closing prices. Twice previously when the 70-level was surpassed and price levels held, this was a sign of strength and confirmation of further rally in the short-run. Indications are that a local top will be seen soon but has not yet been reached.

Now we move on to the short-term chart for GLD ETF to see if we will be able to spot any invalidation or confirmation to previously advanced thesis. Based on June top and July bottom 1.618 retracement level provides us with confirmation of $130 to be the next local top. Notice that exact values might slightly differ for GLD and spot gold, however, this is still consistent with our previously discussed $1,340 level for spot gold.
Our readers might easily notice that we are often using Phi number in order to analyze tops and bottoms. This is certainly not a coincidentally chosen number. Phi number also known as golden number, divine proportion, Latin sectio aurea and so on (you can read more about Phi here). This particular number is known for its wide use in art, mathematics, observation of nature and - of course - in analyzing markets. Vladimir Lefebvre once demonstrated that humans exhibit positive and negative evaluations of the opinions they hold in a ratio that approaches Phi, with 61.8% positive and 38.2% negative. Assuming that changes in markets are reflecting human opinions we can use Phi number in our analysis. Naturally, this goes much deeper than we just pointed, but now you should be able to see the big picture.
Here's the shortest possible reasoning that we could come up with - the Phi number is very common in nature. Humans are part of nature. Humans create markets, so the Phi number could also be visible in this part of nature. Still the most important reason for applying the Phi number into the analysis is simply because it often works.
This week the non-USD chart shows a self-similar pattern as we are in a trend very similar to the one we've seen last year. In 2009 we saw a consolidation above the 50-day moving average and the RSI moved back to 50 after rallying to 70. This is almost exactly what we are seeing now and gold appears to be gathering strength for a continuation of its rally. This further confirms points made earlier in this update.
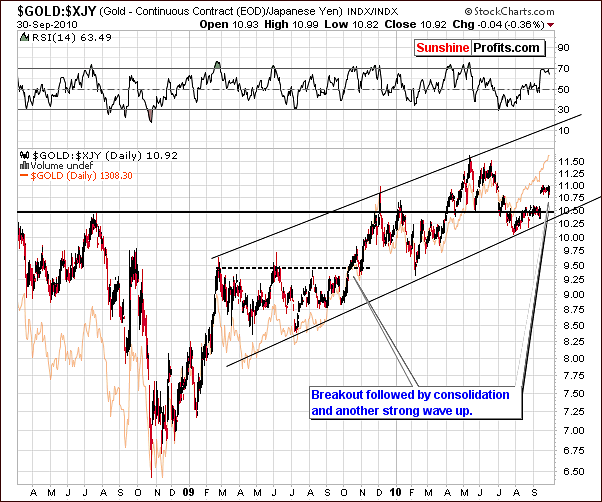
Although the Japanese yen is indeed part of the non-USD group, it is worth further study as it is quite different from other world currencies. Whereas the euro/USD exchange rate is somewhat similar to the British pound and the Canadian dollar USD pairs, the yen is quite different. For this reason, it is a good tool for validation of previous observations.
In this chart, we see that gold has once again broken out above previous highs and resistance levels - again in a similar fashion to what we've seen last year. Some consolidation is likely as the RSI is now moving sideways close to the 70-level. Expectations are that a quick decline will be followed by a big rally. This is similar to what we have observed and commented upon from a USD perspective. It is further validation from yet another, independent (if anything can be referred to as being independent in today's globalized economy) source.
Summing up, gold is likely to reach a local top very soon (possibly around $1,340 for spot gold / $130 in GLD ETF) and then consolidate somewhat. It is likely that it will then rally further, perhaps to 1500. Several retracement level factors yield the same conclusions when applied to previous highs and lows seen during the past four years. Further validation is seen when studying gold from the perspective of other world currencies including the Japanese yen.
Silver
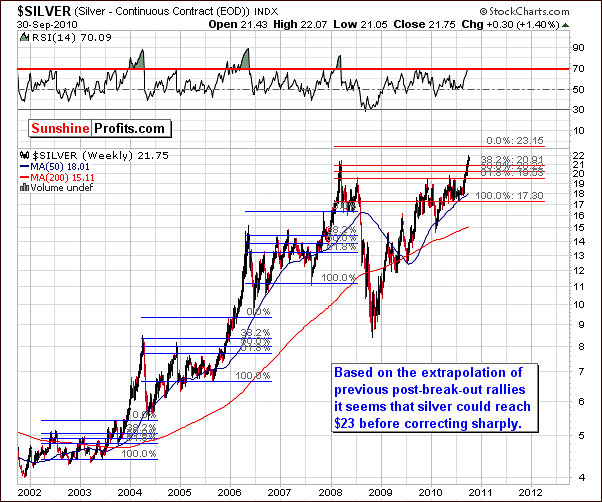
The very long-term chart for silver is used to compare previous breakouts in order to measure and estimate probable target levels for the near-term. It allows us to answer the question "How high will the rally go before consolidating?"
Bull markets often can be compared with self-similar pattern ideology. That is, what we've seen previously on a smaller scale applies to the present on a larger scale. This is also why we are using logarithmic scale to present prices, since a previous $2 rally which in the past was a 50% move (when silver was at $4) may now just be 10% (with silver above $20). Retracement tools also allow for percentage moves to be estimated.
Three points need to be considered here. First is the starting point of the rally that took silver to the new highs. Next is the initial top after a subsequent rally and finally comes the comparison of this rally with previous tops relative to the size. The 38.2% retracement level counting from the top is more or less accurate as a predictor - with the previous tops being slightly above it.
An important note here, which has been seen repeatedly, is that local tops have been followed by sharp declines and then huge rallies. Short-term traders may wish to take advantage of these trends. If moves are to be made in these volatile times, trailing stops are highly recommended here. We will not time this move with our own capital, as we are not very-short-term oriented.
Quoting from the message that we've sent to your 2 days ago:
The white metal breached to new nominal highs, so we've examined how silver performed during the previous times that it broke into new highs.
September 2003 - sharp correction (bottom visibly lower than the previous high) followed by a very strong multi-dollar rally
December 2005 - correction (bottom slightly lower than the previous high) followed by a very strong multi-dollar rally
November 2007 - correction (bottom visibly lower than the previous high) followed by a very strong multi-dollar rally
September/October 2010 - "correction (bottom visibly lower than the previous high) followed by a very strong multi-dollar rally" seems probable.
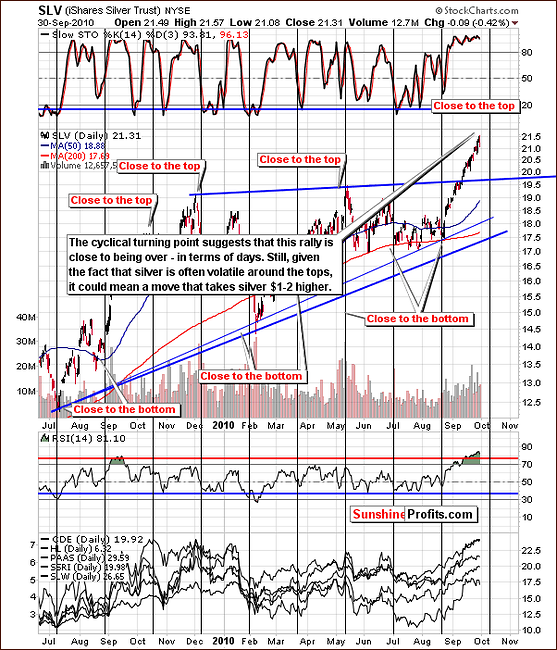
The short-term chart shows the details for the white metal's recent rally. It began slightly above $17 level and the previous top was just above $21. The current rally has a target around $23 using previous tops as a guide. Although this is very approximant and admittedly quite rough, it is better than nothing. Remember that we are clearly on uncharted waters.
If silver rallies as rapidly as in the past, and there is actually a chance that it may be more rapid, cyclical turning points are of great use here. This suggestion is that a local top will be seen in the first two weeks October and it's likely that this will coincide with local tops for gold and mining stocks as well.
Summing up, what was stated in our recent message is worth repeating. "Silver is about a week away from its next cyclical turning point, so the corrective pullback below the previous high appears close. In other words, it is likely that one will be able to get into the precious metals market soon at similar or lower price levels than we have today with the risk being much lower - after the corrective pullback markets will be ready to move much higher again." In the very short term, silver may be just the way to go.
Precious Metals Stocks
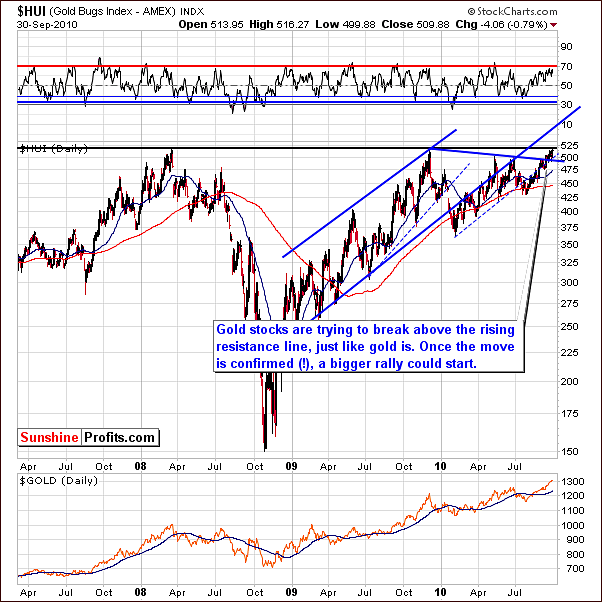
This week's HUI gold stocks index does not reveal a great deal of new information. Gold stocks are above the declining resistance level but have not surpassed the highs seen in 2008. Whether this will happen before or after gold's correction is unclear at this point.
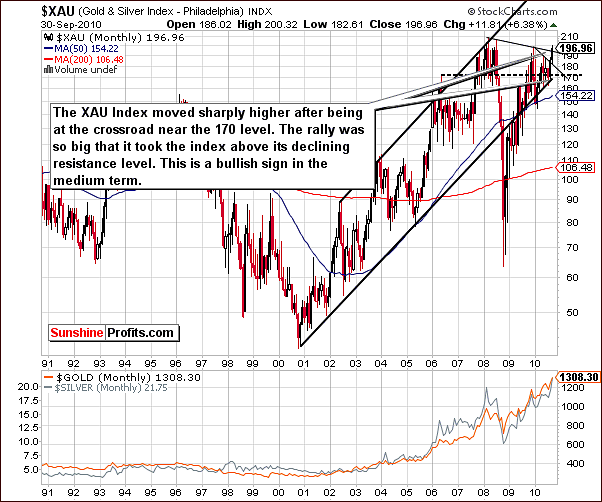
In this week's XAU Index chart, the breakout above the declining resistance level can be seen. This is bullish for the medium-term. Still - as mentioned in the previous paragraph - a consolidation could be seen before the mining stocks breakout.
Precious metals could move above their previous highs (along with rallying metals) and then consolidate or mining stocks could underperform metals until the latter correct. Once the correction is completed, precious metals stocks would strongly break above their previous highs. As you may see, in either case a second consolidation is likely to be seen for the mining stocks as well as the precious metals.
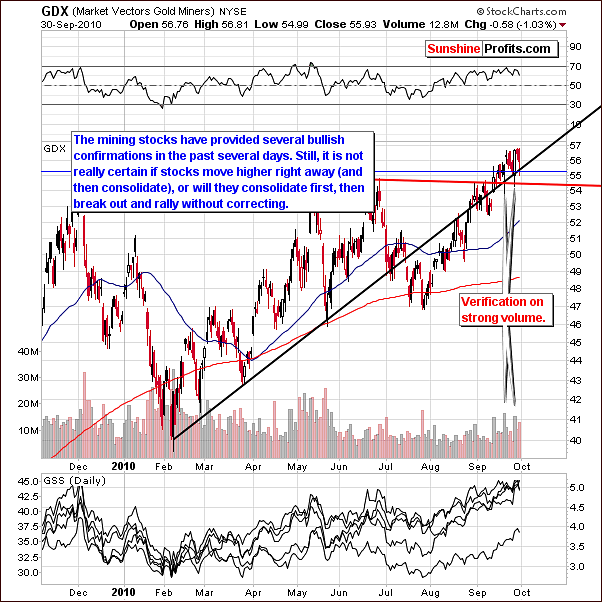
The GDX ETF, which is a proxy for the mining stocks, provides us with details and positive confirmation of what we have discussed previously. The resistance and support levels are clearly visible and we note that recent moves have taken place on strong volume. The extremes of the trading channel have been touched on an intra-day basis, which is a positive sign for the weeks ahead.
Summing up, for investors who wish to trade on a short-term basis, silver appears to be the way to go as opposed to mining stocks. It is likely that mining stocks, which are not as volatile (and do not tend to be very volatile during the final part of an upleg), could underperform precious metals before consolidating. After consolidation however, it is likely that nearly all mining stocks will provide good buying opportunities.
Sunshine Profits Indicators
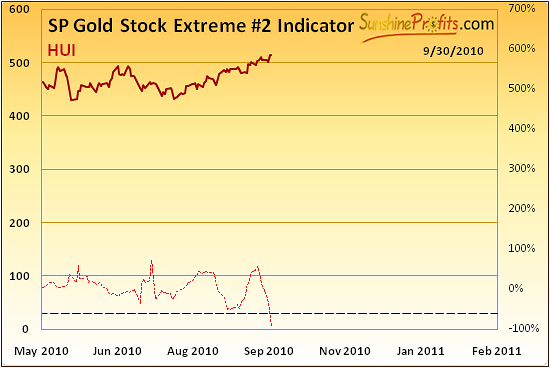
This week Sunshine Profit's Gold Stock Extreme #2 Indicator flashed an extreme signal. This applies to HUI Index gold stocks. What does this mean? It signals an extreme but is not obvious exactly what the signal is - buy or sell. In most cases there is a clear situation as to what one is to expect next - top or bottom, but with a sizable rally behind us and possibility of additional small gains, it is not certain what is being signaled right now.
That is to say; not much information is provided right now, except that we are likely to be close to some extreme. Both scenarios mentioned in this update are possible which means that an extreme (a local bottom) and move higher from here would most likely result in a consolidation above previous highs, just like extreme meaning local top in the HUI Index would mean a consolidation before breakout and move higher after that. Unfortunately there is some inconclusiveness at this point and time. Nevertheless, the probability is quite high for further rally after a consolidation period.
Juniors
As stated in the Key Principles section, the list of top juniors will be updated approximately every 4 weeks, so this is the Update that should contain the revised version of the list. However, before providing you with details, we would like to comment on this sector's performance in general.
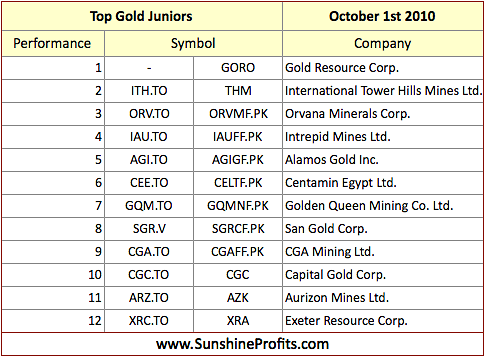
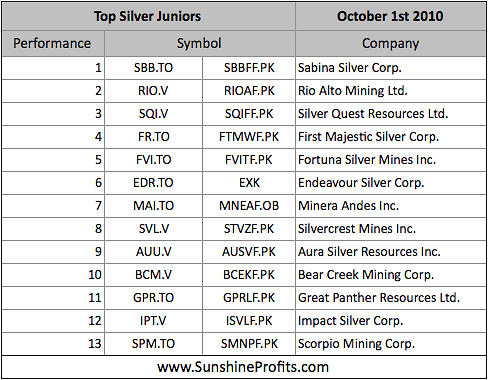
This month we can see only cosmetic changes on Gold and Silver Juniors list. Gold Resource Corp. mentioned previously is on the top of the list for gold this time and it is no wonder when taking into account its latest performance (during September it moved from around $14 to $18+, which is a gain of more than 25% - it was ranked 2nd last month, so we believe your portfolio benefited i.a. from this upswing). As you might have noticed this month list for Silver Juniors consists of 13 instead of 12 entries. All because of MAI.TO (Minera Andes Inc.) with its percentage-wise-impressive rally. Therefore, if you've been taking our rankings into account when selecting junior stocks to your portfolio, it seems that you will not need to make significant adjustments this month. The fundamentals didn't change in a way that would make significant adjustments necessary.
Our SP Junior Long-Term Indicator has been consistently suggesting holding juniors since June. In Premium Update from August 6th 2010 we were seeing this particular indicator below dashed line and starting to rise.
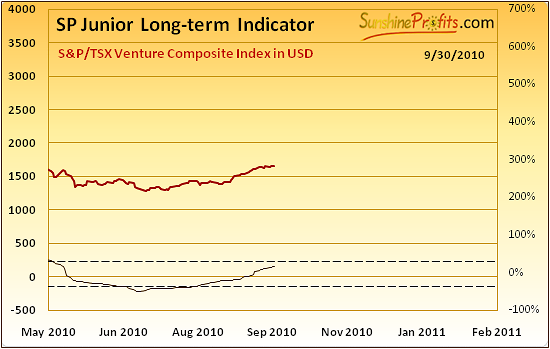
As a quick reminder - the buy signal (for juniors; switch from senior stocks) is given, when indicator is below lower dashed line and starts to rise (the indicator has been falling for 3 consecutive days and rises on the following day). The sell signal (for juniors; switch to senior stocks) is given, when indicator is above higher dashed line and starts to fall (the indicator has been rising for 3 consecutive days and falls on the following day).
Summary
USD Index is declining and many factors indicate that it will maintain this direction at least temporarily before reversing, exactly opposite to general stock market, which seems to have some more steam to move higher before consolidation.
This would support gold, silver and mining stocks in continuing their recent rally, consolidating and then moving higher - most likely much higher.
We see this very short-term move up as an opportunity only for cautious and experienced traders, who are very short-term-oriented and personally we will not take advantage of it. Instead we will wait for better risk/reward ratio, which should materialize right after expected consolidation. If you wish to bet on the abovementioned quick upswing, you might want to use silver.
We do not recommend trading this short-term move as it is the final part of current rally, so chasing it could prove to be very tricky, however, if one will insist on doing so, it seems that silver should be preferred due to its behavior around local tops and the fact that the general stock market is also likely to move temporarily higher. It is important, however, to utilize protective trailing stops and stop loss orders to minimize one's risk. We believe that the more profitable route is to wait for the next rally, which we expect to materialize very soon.
A short, closing comment:
Sunshine Profits continues to provide services based on technical analysis tools. Recent market activity has frequently been surprising and is simply due to the changing world we live in. As we have expounded upon in the past, we are in new times with new currencies and new markets, especially in third-world countries and to expect market interaction to exactly mimic the past is somewhat credulous. In short, a changing world is bound to create changing markets, which at times are simply impossible to predict. Consequently, please keep in mind that the technical analysis can only work about 70-80% of the time, and every analyst has to be wrong from time to time - as much as we would like to, we're not immune to this characteristic. As always, we continue to refine our existing tools and develop new techniques to allow our accuracy to improve each week.
By the way, our very detailed research on options/futures/stock options expiration dates and their influence on gold, silver, and mining stocks is close to being over. We're running final tests, but the numbers already appear to confirm what many claimed to be true - expiration dates of derivatives influence silver to the greatest extent. Much more details will be revealed this month or in November.
This completes this week's Premium Update.
Thank you for using the Premium Service. Have a great weekend and profitable week!
Sincerely,
Przemyslaw Radomski

