
Gold rallied this week to a record of $1,274.95 as investors keep seeking protection against turmoil in the global economy and financial markets. Fear made a return appearance in key financial markets pummeling the dollar, triggering another wave of buying in the Treasury bond market and driving gold to a new high.
But fear of what, exactly?
There is plenty to be afraid of. There is worry about sovereign debt in Europe. The subject is not making headlines anymore but it's still there lurking in the background. Is the euro that much safer than it was half a year ago? It isn't just the euro that is heating up gold. It is the general fear of the debasement of all currencies. The dollar has been on the slide recently. The Bank of Japan has now started intervening to get the yen down too, in their first intervention since 2004. Some investors don't want low-yielding Treasuries as a haven against economic uncertainty and are opting for gold. Gold seems to be the only thing left to believe in.
However, as we wrote in the Market Alert we sent out on Tuesday, despite the euphoria, one must consider some bearish factors. The juniors' performance still suggests excessive optimism, and the GDX:SPY ratio rose Tuesday on very big volume. As you may recall, this is something that very often accompanies local tops. We still expect a correction, but given the market's recent strength, it will most probably not be as deep as we originally expected. Although the correction in gold prices did not occur as yet, the long-term precious metals holdings in our portfolio have done very well in this rally, so we really can't complain. Premium Service Subscribers who have been urged to open long term positions in precious metals 2 years ago and to hold them tightly are profiting handsomely from the rally (gold rallied over 50% since that time, silver is up about 90%, and the HUI Index (proxy for gold stocks) - 80% (with the best stocks having moved even higher). It seems like gold and precious metals are the only secular bull market left. Smart money is buying.
Although it is tempting for Speculators to short the PMs when a correction appears imminent, the last few weeks are a good illustration of why it's usually not safe to stand on the tracks when the secular bull train is coming by ignoring the long-term part of one's portfolio. As we know, in bull markets most of surprises come on the upside. That is why we have encouraged Premium Service Subscribers to take long-term positions as well as speculative trades from time to time.
Gold prices are rising from the long-term perspective and it's no wonder. Central banks that had one time liked nothing better than to get rid of their gold, are amassing major gold positions. The International Monetary Fund said last week that it sold 10 metric tons of gold to the central bank of Bangladesh raising $403 million. This is part of 403.3 tons approved for sale by its executive board last year to increase low-cost lending to poor countries. The IMF fund has already sold 212 tons of gold to the Reserve Bank of India, the Bank of Mauritius and the central bank of Sri Lanka, all in November last year.
So far in 2010 Russia has increased its gold holdings by 2.8 million ounces, $3.6 billion at current prices giving the Russian government a total of almost $30 billion. Saudi Arabia and the Philippines have disclosed new gold buying in 2010, plus India, Sri Lanka and Mauritius bought gold in 2009. We know that the People's Bank of China is also is a major accumulator of gold, gobbling up its local mining production in hopes of having a hedge for its huge mountain of fiat currency reserves.
It seems that demand for gold is rising faster than supply. Mine production has remained flat even as investor demand more than doubled so far in 2010 compared to a year earlier.
Looking back at recent history the best year for mine production was in 1999 when 83.69 million ounces of new gold came out of the ground. Keep in mind that in that year the price of gold was under $300, hitting a low of $256. (That was the year that the luckless former British Prime Minister Gordon Brown ordered the sale of Britain's gold reserves.)
It doesn't take a degree in economics to understand that if the price of something soars by some 350% you would want to dig more of it out of the ground and sell it. But last year's mining production hit only 74.46 million ounces still not enough to surpass 1999's output. So we're not seeing dramatic increases in mine production. Central banks around the world who were permitted under an international agreement to sell a combined 200 tonnes per year, are not even selling an ounce. Just the opposite--they are net buyers rather than sellers.
Scrap gold (people's old jewelry etc.,) is another source of gold coming to the market.
Over the last few years, since the financial crises unfolded and gold prices have gone up, people have been lured by advertisements on late-night television to take out their old gold jewelry and sell it for a profit. So that in 2008, while new mine production barely inched up by 1.38%, scrap gold soared by 34%.
But is scrap gold a never ending supply? There is a limit to the number of grandma's old gold rings people can sell. World Gold Council figures for the first quarter of 2010 show that scrap sales for this period were 11.03 million ounces, a 43% fall from the first quarter of 2009. Demand is growing but supply isn't. Again, you don't need an advanced degree in economics to understand the long-term implications for the price of gold.
To look at the short term implications let's turn to the technical part of the Premium Update and begin with analysis of the Euro Index. We will start with the long-term chart (charts courtesy by http://stockcharts.com.)
Euro and USD Indices
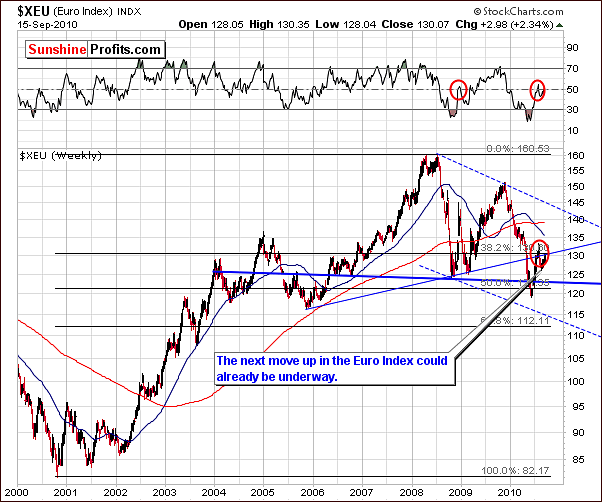
In this week's long-term Euro Index chart, this week's uptrend thus far provides additional evidence in support of a correction in progress. Since last Thursday, the Euro Index has moved higher by nearly 2.5% and is approaching the midpoint of the way back to its late 2009 high.
This is a bullish development for the near-term and a continuation of this rally seems likely. A note of caution needs to be addressed as the 38.2% Fibonacci retracement level is currently in play and this may very well cause the rally to pause temporarily near its present 130-level. A resumption of the rally may be seen next week with possible target levels close to 140. Much depends on the length of the pause and the corresponding impacts upon other markets.
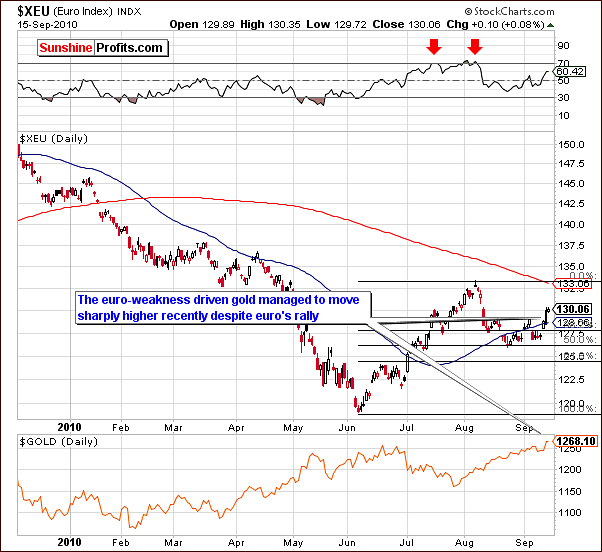
In the short-term Euro Index chart this week, gold is seen showing strength of late as its direction was up even in spite of the euro's recent uptrend. This is not normally the case as these markets generally move in opposite directions of one another. By breaking this tendency, especially in last days, gold made further gains much more likely than in previous weeks. This changes bullish implications of euro analysis on yellow metal, having in mind recent weeks, into not necessarily bearish sign. Therefore a positive reflection on gold, silver, and mining stocks is more likely. In fact it was main reason for us to send recent Market Alert.
With an expected pause in the Euro Index rally and a similar expectation for the dollar (see next section), the very near-term remains blurred for the metals market. Caution should still be exerted as the long anticipated correction will likely be seen eventually and could begin at any time in the coming weeks.
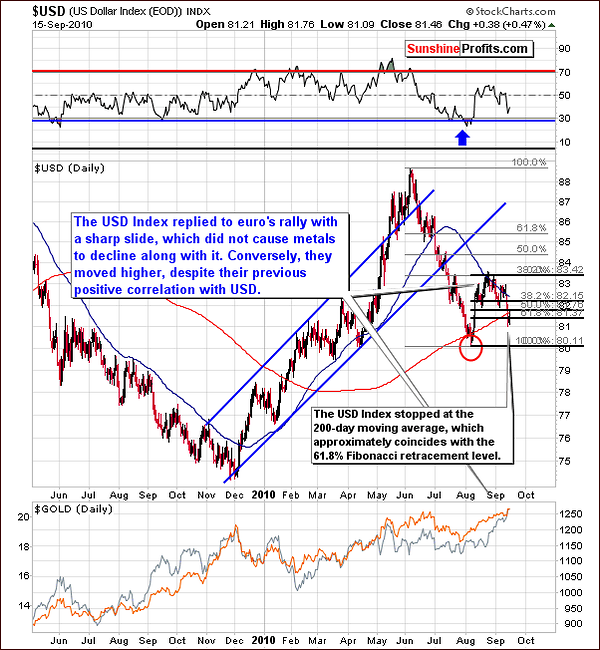
In the long-term USD Index chart, the recent slide appears to have been slowed or temporarily halted by a resistance level situated slightly above the 81-level. This corresponds to the 61.8% Fibonacci retracement level based on last month's rally. The 200-day moving average is also likely providing some support at this time (it served as support by stopping previous decline as marked with the red ellipse on the above chart).
The head-and-shoulders formation, which we have discussed in recent updates played exactly as suggested. As expected, the USD Index has failed to mount any sort of rally within the past two months or so while this pattern was developing. Early July index levels, which were close to 85, have not been seen at any time since.
One important point regarding the recent decline in the USD Index is its minimal impact on gold, silver, and mining stocks. The usual positive correlation between precious metals and the dollar has not been seen lately and the strength and resilience of the precious metals sector on the whole cannot be ignored.
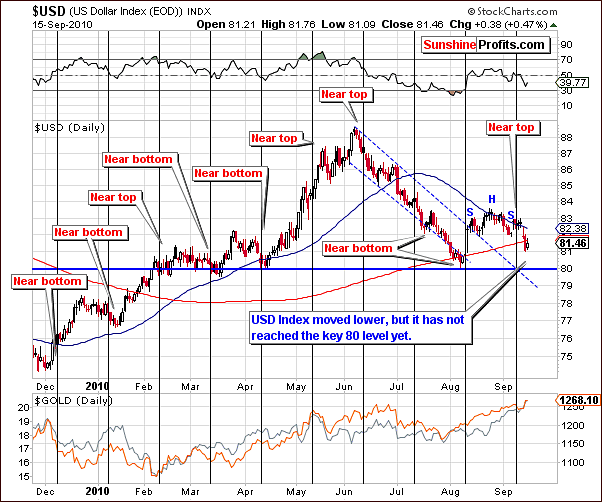
The short-term USD Index chart shows that a local top appears to have formed as expected near the vertical line on the chart close to the 83-level. The dollar has declined almost 2% since that time but will likely pause near today's closing level or slightly lower. The 80-level, which provided support early last month may be tested but more than likely the 200-day moving average resistance level will hold the dollar somewhat in check without a straight decline to the 80-level range.
The implications for gold, silver, and mining stocks are a likely continuation of present rising prices especially if the dollar moves lower. However, a reasonable correction in the metals has not been seen for some time and has been discussed at length in recent updates. It should be remembered that such corrections, which have historically been a normal part of market and currency index cycles may be seen at any time in the coming weeks.
Summing up, with pauses likely to be seen in both the Euro Index and USD Index, gold, silver and mining stocks could very well continue their recent trends. The bearish head-and-shoulders pattern, which is nearing completion in the short-term USD Index chart, could still begin to have a negative influence on the precious metal sector. For this reason, gold, silver and mining stocks must continue to be closely watched to enable immediate identification of the local tops, which could be seen at any time now. More on that later on.
General Stock Market
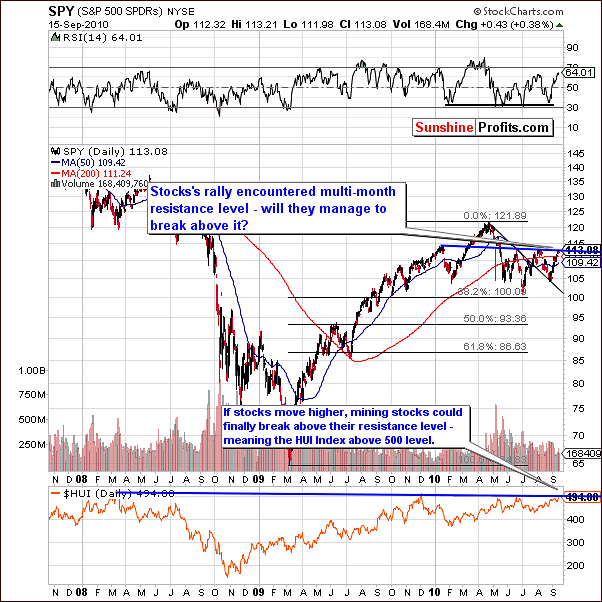
This week's general stock market trades right at the multi-month resistance level. It may or may not break above it and remains at the crossroads at this time. Until such a breakout is seen, the direction of stocks in general remains uncertain. Remember that three consecutive closes above the resistance level would constitute a breakout and a possible rally to perhaps the 121-level. This appears likely and the possibility for a pause would then be present.
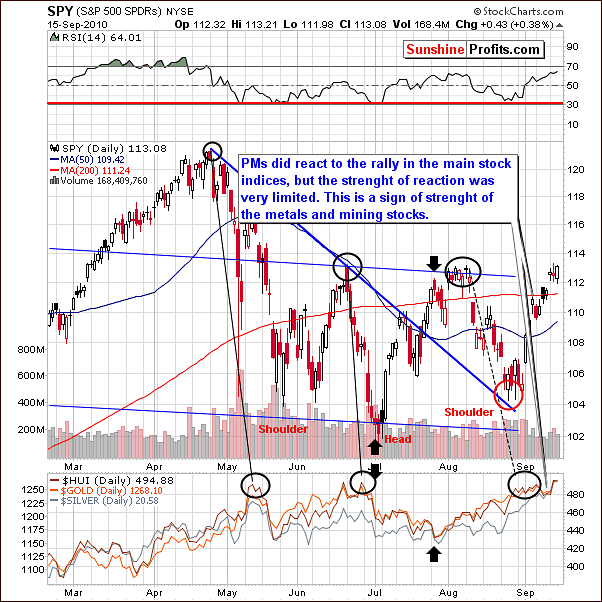
In this week's short-term chart, we see that the latest decline in precious metals was quite small - barely visible. Stocks did rally as expected, however, the minimal decline seen in gold, silver and mining stocks further points to their strength at this time.
The general stock market is having negative, yet very limited influence on precious metals. Should a sharp rally occur, gold, silver and mining stocks would likely consolidate or move slightly higher. If however, consolidation is seen in stocks, precious metals could very well move decisively higher.
Summing up, the strength seen across the precious metals sector on the whole opens the possibility for the HUI Gold Bugs Index to surpass the 500 level. This would in all likelihood result in higher prices for all precious metals regardless of general stock market trends. It is important to remember however, that this must be confirmed by three consecutive closes and short of that, a correction is still possible for gold, silver and mining stocks.
Correlation Matrix
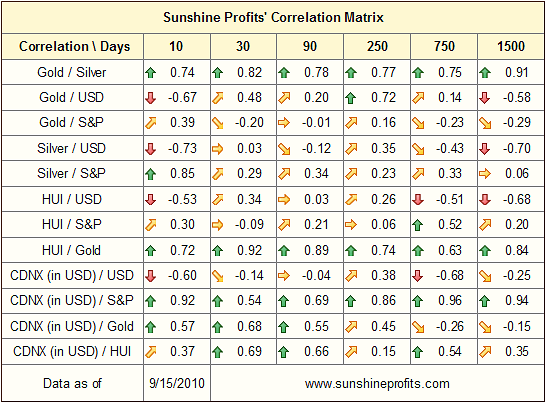
In the Correlation Matrix this week, we note a quick turnaround in dependency as gold and USD used to be positively correlated and exactly the opposite has been the case in the past few days. Mining stocks also have shown similar trends lately to a considerable degree.
With many of the weekly correlations trending the opposite of what used to take place, market developments have defied predictions. This holds true for technical analysis techniques as historical charts only give support to probability theory. Even the best tools and signals miss their targets between 20% and 30% of the time. This is important to remember whenever any type of analysis in undertaken to forecast future movement or trends - this is why limiting one's exposure is absolutely critical.
Gold
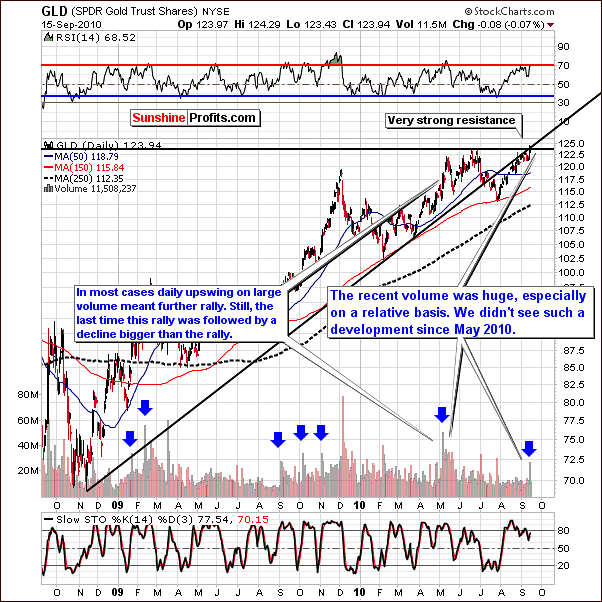
Gold has moved above its previous high and it has done so on huge volume. Focusing on volume for a moment, most spikes similar to what has been seen of late have resulted in continuation of rallies although some consolidation normally takes place prior to or right after the rally - sometimes erasing the gains resulting from the rally.
A notable point needs to be made about a similar volume spike seen this past May. The subsequent rally was followed shortly thereafter by a four-week decline to levels in late-July, which were lower than those seen prior to the rally. In other words, the volume spike was followed by a rally, which was then followed by a sharp decline with only an occasional small correction interrupting what turned out to be a steady, month-long downtrend. The possibility that this type of pattern could repeat itself must be kept in mind even if gold rallies from here.
As was published in our September 14 Market Alert, "The above doesn't change our opinion regarding one's long-term investments - we remain bullish on the metals here and we believe one should hold them regardless of the possibility of the short-term correction."
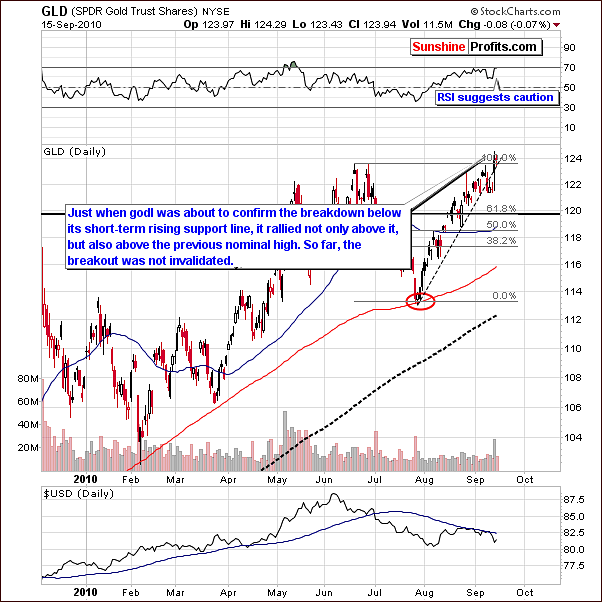
In the short-term chart this week, gold is seen trying to break above its previous June, 2010 high.
No plunge in price had been seen even though stocks had rallied and the USD Index move sharply lower, which is a sign of strength. Yet, if the breakout fails to hold, there seems to be a good possibility that GLD SPDR could decline to around 120 or 118-levels.
Another possibility is for gold's spot price itself to move up by an additional $10-$20 (which we see right now) and close above its previous high. This could be followed by a consolidation back to today's levels, which would allow for entry into the market at reduced risk levels. However, it is important to note that the RSI points to caution at this time as the 70-level is quite close today. The old adage "When in doubt, stay out" perhaps should be heeded at this time.
So, if you're considering betting on post-breakout short-term upswing we would first suggest waiting for gold to correct to the June 2010 high and enter the trade only if the corrective downswing toward this level takes place on low volume.
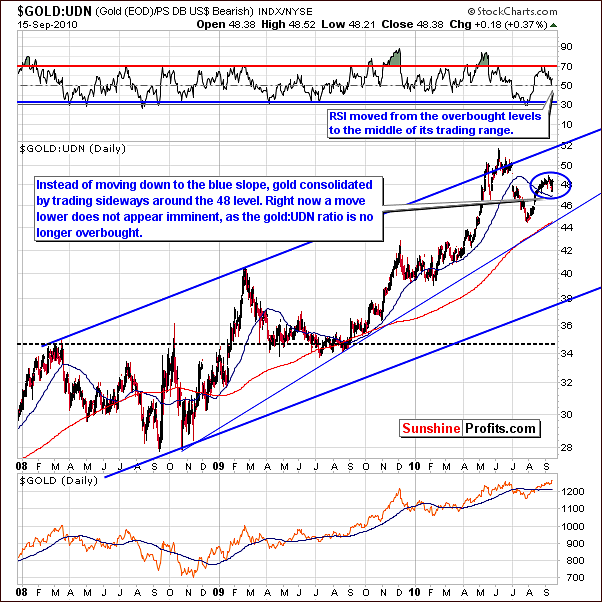
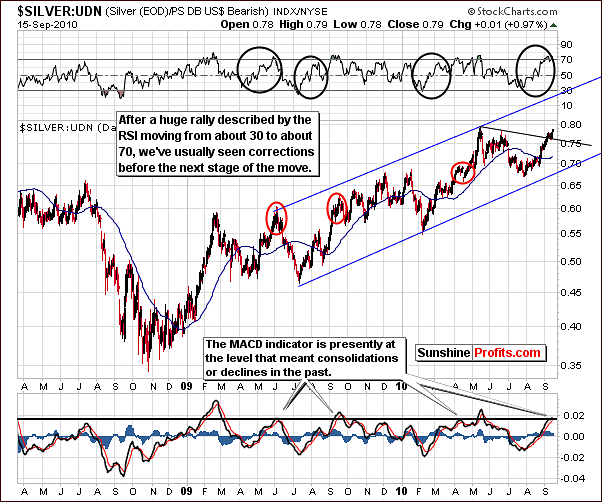
From a non-USD perspective, the GOLD UDN ratio remains in the 48 range and once again is close to the 50-day moving average. This level has provided resistance in the past and appears to be causing some consolidation and sideways movement presently. With the RSI in the middle of the trading range, gold is not overbought from a non-USD perspective. Instead of a quick decline, the consolidation took form of a monthly horizontal trend. A rally is no longer improbable.
Summing up, gold continues to attempt to break above resistance lines and huge volume levels indicate the possibility of further rallies from here, especially in the intermediate term (next few months). However, past trends indicate that such a rally could be followed by a significant correction and this must be held onto as a possibility for the medium-term. Please note that the analysis of seasonal September patterns suggests higher values of gold beginning since the second half of the month - which is where we are today.
A slight correction could very possibly present speculative investors with an opportunity to enter the market with low risk-reward ratios.
Silver
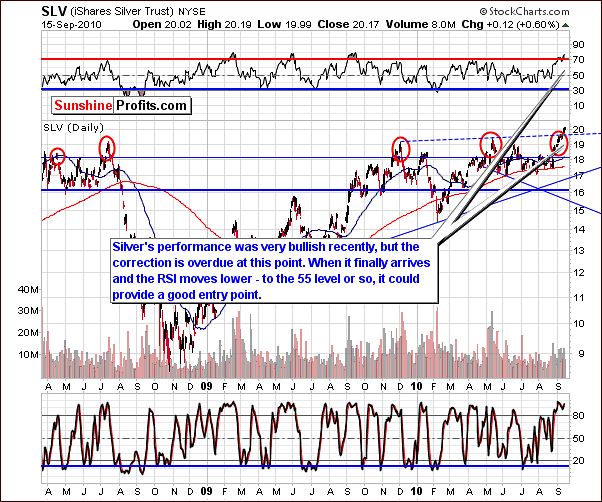
This week's long-term silver chart shows a continuation of the rally, which has brought silver above the $20 level. The RSI and MACD indicators are both quite high and near overbought status. For this reason, at least a small pause is likely for the white metal in the near-term. The rally could very well continue thereafter.
A consolidation is possible as well since silver's recent rise has been quite rapid. Once again, this could provide an opportunity for entering the market with speculative part of one's capital (we definitely don't suggest exiting the market with ones long-term holdings). A middle of the trading range RSI around in the 55 range would provide a signal that the time could be at hand for such a speculative move. This has been consistent with beneficial entry points in the past.
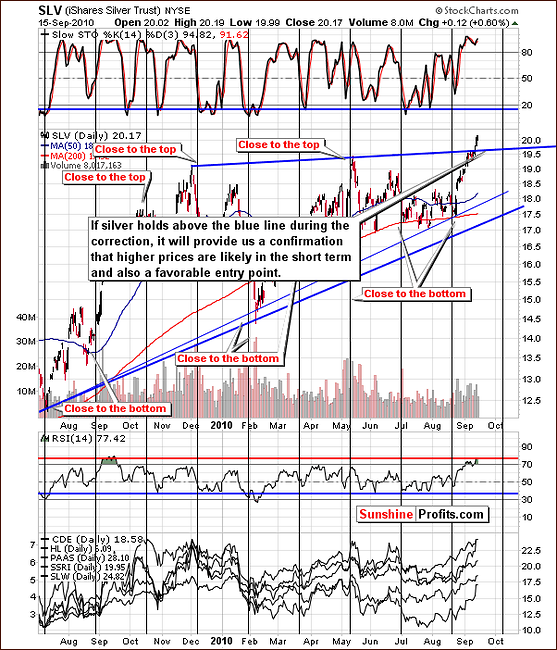
The short-term chart for silver this week shows that a move has been made above the blue resistance line created by the two highs reached in the past 12-month period. This breakout has not yet been verified but is a good sign that, at least for the short-run, gold, silver, and mining stocks are more likely to rally than decline.
Low volume levels on declining days and higher volume on uptrends appear to have been the norm recently for the white metal and this is a bullish signal. When volume begins to be low on days where the rally continues, it is likely running out of steam and nearing a point of correction. When this correction comes, silver will likely decline to perhaps the $18 or $19 range at most. If the recently broken blue resistance line provides support and gold also consolidates above the previous high, it might be a good idea to bet on higher silver prices. Once again, until such time that a correction is seen, the "when in doubt, stay out" saying appears to apply here as well (naturally, regarding the speculative part of one's capital only).
From a non-USD perspective, silver has apparently broken above its short-term, declining resistance level. Both the RSI and MACD indicators are suggesting that a consolidation is likely from here. It could be quite short and then be followed by a continuation of the recent rally similar to what was seen for several weeks in April, 2010.
Summing up, silver's outstanding performance continues but it does appear to be poised for at least a pause in the near-term. A consolidation could very well provide opportunities to speculative investors and bullish sentiment holds for the medium-term. As always, caution is strongly warranted concerning the white metal as it frequently defies logic and expectations. Gold's performance can also give additional insight into probabilities and possibilities for silver and other precious metals as well as mining stocks.
Precious Metals Stocks
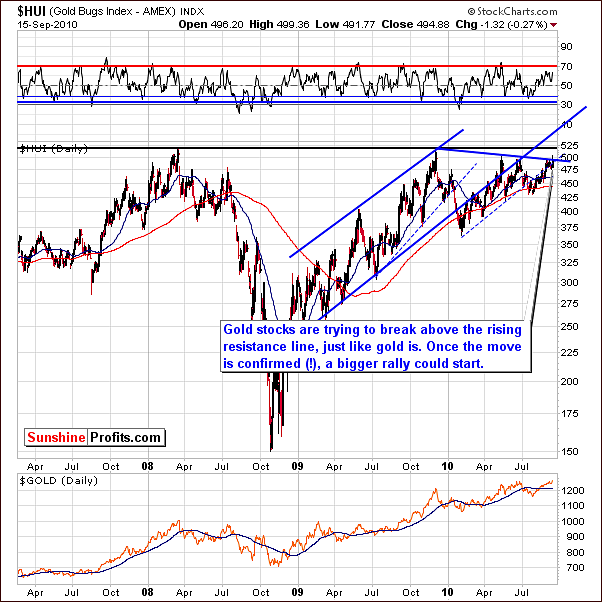
As we mentioned earlier in this update, the HUI Gold Bugs Index is once again attempting to break above the 500-level and then to move above its all time high. There appears to be a good chance that this will finally happen after numerous failed attempts, when it tried to break above it decisively, over the past three years. A big rally could very well follow once this psychological barrier is surpassed. Time will tell. For now we suggest waiting for more signals before initiating speculative position, as we could see slight move down before upleg materializes. A move lower accompanied by low volume and a similar move in gold and silver is something that you want to see before opening a long position here. Conversely, if markets plunge tomorrow on huge volume, it will be a "go short" signal.
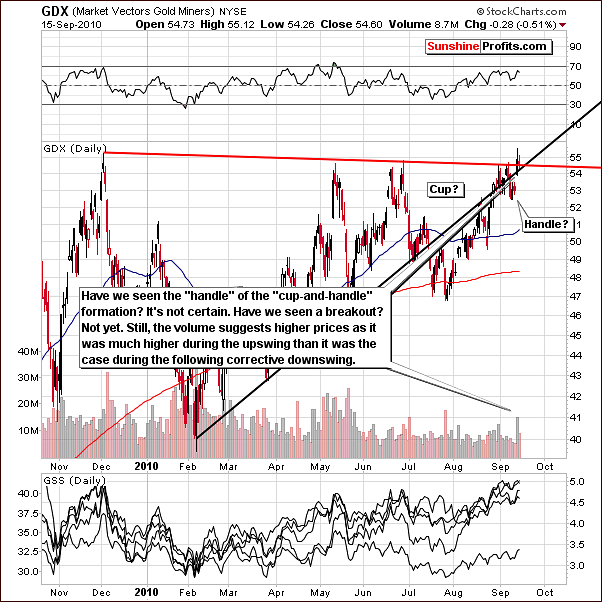
In this week's short-term GDX chart we see that two strong support/resistance levels are in play. The outlook for the near-term is dependent on what happens with these levels, that is, do we see a breakout above the resistance level or has the rally stopped and a subsequent decline seen?
If the breakout happens, a correction will likely be seen fairly soon with declines back to somewhere near today's closing levels. As mentioned above, this would provide a good entry point and an attractive risk-to-reward ratio for entry into this market.
If a decline is seen in the next few days or so, accompanied by low volume, this would be likely in the 5% or so range to around 51. This would likely be stopped and supported by the 50-day moving average. At this point, the risk-to-reward ratio could also be favorable for a point of entry.
Recent declines have been accompanied by low volume and high volume has corresponded to upswings. This is a bullish indication and suggests that the breakout discussed above might in fact be confirmed.
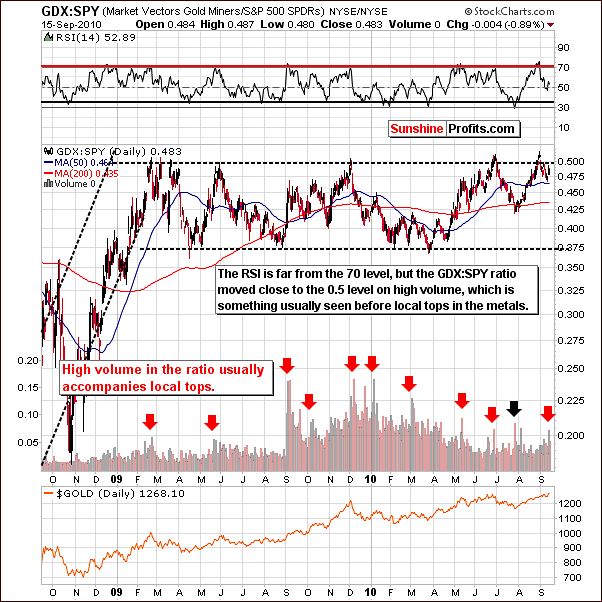
The GDX SPY ratio is close to 0.5, which has commonly been seen before local tops in the past. Spike in volume, which has been visible just two days ago, is a sign to be cautious, a bearish indicator based on past performance. These indicators have been quite reliable in the past and should not be ignored.
This is why we are emphasizing that we would be hesitating to open a speculative trade before a confirmation is seen.
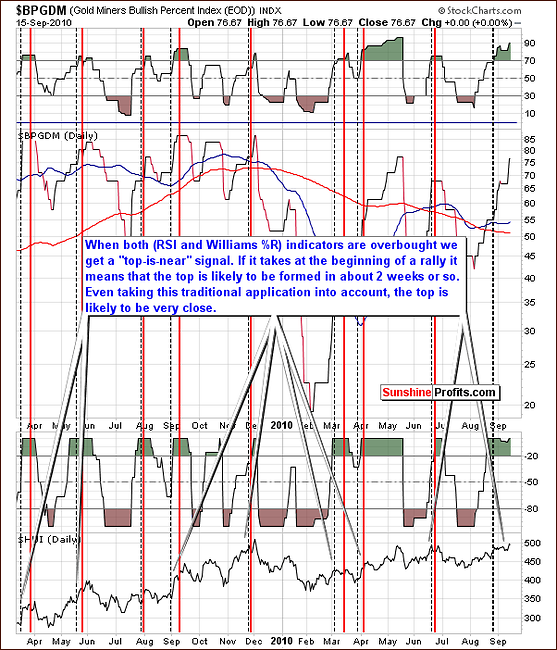
What we stated in last week's update is worth repeating this week: "The Gold Miners Bullish Percent Index continues to indicate that the top is close (...) This reliable indicator has been suggesting an imminent local top soon for some time now and other tools which are at our disposal this week tend not to refute this as a strong possibility."
Since there was no correction since that time, we are still likely to see one in the following weeks.
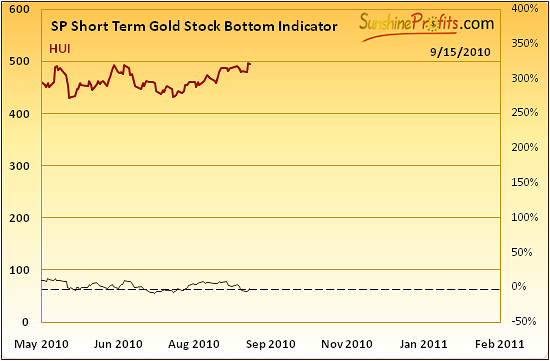
The SP Short Term Gold Stock Bottom Indicator is used to signal a favorable buy opportunities for short-term bets in gold stocks. When the indicator changes from declining to rising and is below the 0% horizontal dotted line, the signal is given. This occurred earlier this week (based on Tuesday's closing price) and seems to indicate further gains in the coming days. Consequently it favors the scenario, in which precious metals sector moves higher and then corrects to June highs, and creates another buying opportunity.
Summing up, the HUI Index appears to still have some time remaining in its current rally and the same holds true for the GDX ETF. Both appear to be capable of breaking above resistance levels and further continuing a rally for at least the near-term. The GDX SPY ratio is presently pointing to a bearish trend in the near-term, so we don't suggest opening any positions before a confirmation is seen.
Under development
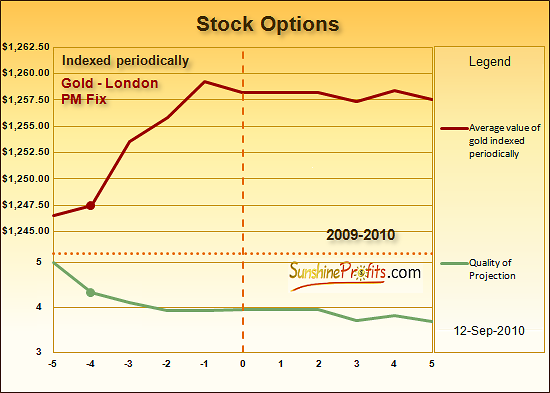
Sunshine Profits is always looking for new insights and perspectives to improve our tools and enhance our forecasting abilities. The above chart studies gold's price in advance of expiring stock option dates which occur at the end of the third week of the month.
September 17, 2010 is one such day. Over the past two years, gold has risen in value by $10 - $13 on average in the four days prior to such an expiration date (mostly from third Monday of the month to third Thursday of the month). This week's price action clearly confirms the phenomenon described by the above chart. The next time it is likely to take place is from Oct 11th to Oct 14th before Oct 15th options' expiration.
This tool should serve as addition to other factors such as higher prices on high volume and the fact that it is half of September right now. As a quick reminder - we've mentioned in earlier Premium Update in "September Rally" section, on average such a usually rally stars in the middle of September.
Further study is in progress on this tool as well as analogous indicators for silver, mining stocks indices and also individual mining stocks. Our goal is and always will be to provide our Subscribers with useful and timely tools and information to facilitate timely, educated, and informed decisions with regards to the precious metals sectors.
Other information
Among numerous questions received this week, we believe this one to be of most importance. One of our Subscribers asked us how can we claim that the total value of the portfolio is still up after taking heavy losses for almost a month. Well, please note that Subscribers, who follow directions stated in the Key Principles sections, did not miss the September rally, as they benefited from it using the best and most profitable gold and silver stocks, as suggested by our Leverage Calculators.
Moreover, this trade was designed from the very beginning to be small and executed only with speculative part of one's capital (so any losses here should not be heavy) and this is exactly what we wrote in August 18th Market Alert: "At this point we believe that these odds have further increased to about 70% or so, and we believe that betting on lower gold, silver, and/or mining stocks' prices is profitable.(...) All of the above is dedicated to short-term Traders - we still believe that gold, silver, and mining stocks will trade much higher in a few years than they are today. As always - please remember to use only a fraction of your capital for speculation. Please refer to the Key Principles section for details."
We were prepared to increase the size of the position if we had seen a confirmation that the decline is indeed underway, but such a confirmation never materialized. Of course we are not happy with this trade, it is definitely not the best trade in our history, but taking the whole 2010 performance so far (and the one in 2009) into account, we believe that we were able to generate value for you. Still, we are sorry if this trade had a big impact on your portfolio.
This brings us to the second question - what now? What if someone did exactly against suggestions from Key Principles (Portfolio structure), Research (The Universal Investor. Speculation and Investment), used everything to bet on short-term price swing and at this point is without any long-term "core" position? There's not much new to state here. Regardless of the previous actions, we believe that one should stick to the Key Principles, which means opening long-term positions with most of capital and leaving the rest of speculation at the most favorable risk/reward ratio. Please keep in mind that putting about 30% of one's capital into speculation doesn't mean that all of that should be used for a given trade.
While we don't like to hold dollars either, we definitely don't suggest trading just for the sake of "getting your money back from the market as soon as possible" - this approach forces one to initiate a trade quicker than the risk/reward ratio would suggest, which consequently leads to a bigger number of "not too good" trades. Does the risk associated with entering the trade is justified by a big profit potential? If so, enter the trade. If no - don't. It doesn't matter if you've just gained 500% on your last options trade, of if you've lost the invested capital - the above rule remains the same. So, unless we see a confirmation that a move lower is likely right now we don't believe having an open short position is a good idea. In other words, if you have an open speculative short position we would suggest to close it - you can always re-open it if the situation becomes more favorable.
Another question was about rapid intra-day V formations, when prices drops briefly and then rally to the previous levels. Such V formations are generally bullish indicators, however, if they are developing in minutes their effects are usually also limited to analogous periods. In other words - we wouldn't bet on a monthly rally because of a V formation that was $10 deep and took 40 minutes to develop.
Another quite important question was if we view this move up as being caused by institutional buying? At this point it is tough call to say who's been buying and why did it happened. Ultimately it happened because someone had pushed the "buy" button. Why did they do that is another matter... It had to happen eventually because gold, silver and precious metals stocks are in a bull market and will stay in bull market for many months and probably years to come. We don't think that this daily upswing should be viewed as money flowing to safer areas from other assets like bonds, stocks and real estate because these flows are long-term tendencies directly linked with fundamental situation. Daily upswings we've seen recently are technical factors, manifestation of short-term movement and most likely emotionality that could be as well induced by one big investment fund that bought at excessive margin, which in turn caused prices to rally. The point is that if gold manages to sustain these gains and consolidate above June highs it could turn into a sustainable rally that could take the yellow metal up to $1500 or so.
Another question was about gold and IRA. Subscriber notified us that she would like to buy gold in my self-directed IRA. I've a trust in this IRA to hold all the investments within the IRA. I tried to open an account with GoldMoney but they wouldn't do it under the trust name. I've checked out GoldMoney and really liked their concept. I was disappointed that they won't allow a trust to open an account. Do you know any other companies that I can check out?
In this case we suggest checking out the Central Fund of Canada (CFC). You can find out more about CFC and an IRA in this essay. In short, Central Fund provides the 50/50 mix of gold and silver. If you are not happy with these proportions, you can always create your own by purchasing shares of Silver Bullion Trust and Central Gold Trust. Purchase more of the former for bigger exposure to silver and more of the latter to bigger gold share.
You can always go with physical, and you will find more information here: and here. Additionally, we have more information about physical bullion in the Key Principles -> Physical Bullion section.
The final question for today was about juniors and especially one of them - Great Panther Resources - and its relatively late move up and was accompanied with really positive feedback. Thank you. GPR.TO looks good, but other stocks from our rankings look slightly better. It seems that if one decides to keep it, they will still be fine (it ALMOST qualified to our top list). Of course that's just our opinion. Generally, as far as juniors are concerned, it appears that it might be a good idea to sell some of them once the general stock market gets close to reaching a local top - we don't see many signals confirming that at this point. Keeping in mind the long-term Hindenburg Omen signal that we've seen several weeks ago, it seems that juniors will also move lower (they are positively correlated with the general stock market) if stocks plunge. Consequently, when we see a local top in stocks, it might be a good idea to sell a part of one's junior holdings. We will let you know when we believe that is the case.
Before summarizing, we would like to remind you that - as stated last week - your Editor will be away for the next week and the next Premium Update will be posted on October 1st, 2010. Thank you for understanding. Of course, Jacob will be here to answer any technical questions that you might have.
Summary
The precious metals markets have just moved strongly higher even despite negative influence coming from the USD Index and the general stock market. This, along with the price levels reached by gold, and the volume that accompanied this move, bodes very well for gold, silver, and mining stocks in the following weeks (and most likely months). There are also short-term bullish signals coming from one of our own indicators, and the average price performance of gold prior to stock options expiration.
On the other hand, we have seen a spike in the volume on the GDX:SPY ratio, the Gold Miners Bullish Percent Index still suggests caution, andseveral indicators point to a correction materializing very soon. Consequently, until the breakout to new highs is confirmed, we don't think that opening speculative positions here is a good idea.
The above - by no means - should be interpreted as a suggestion to sell one's long-term holdings in the precious metals sector.
This completes this week's Premium Update.
Thank you for using the Premium Service. Have a great weekend and profitable week!
Sincerely,
Przemyslaw Radomski

