
I wish you could have been there at the Ambrosetti conference which took place this week in Cernobbio, Italy on the shores of Lake Como. For that matter, we wish we would have been there too. It's one of the most beautiful places in Italy, which means it's one of the most beautiful places on earth. There, at the elegant Villa d‘Este, a Renaissance hotel with its own Wikipedia entry, some of the world's leading economists met to discuss the issues of the day.
One of the conference participants was New York University Professor Nouriel Roubini, famous for having predicted the US housing bust and subsequent recession more than a year before they happened.
Roubini told European economic leaders that the "US has run out of bullets." More quantitative easing (bond purchases) by the Federal Reserve is not going to make any difference. Treasury yields are already down to 2.5pc yet credit spreads are widening again. Monetary policy can boost liquidity but it can't deal with solvency problems. During the conference Roubini said the dollar, the yen, and the Swiss franc may be better investments than gold if the world economy slips back into recession.
Gold will be one of the preferred safe haven investments in the case of a double dip recession, "But in that situation, things like the dollar, the yen, the Swiss franc have more upside in a situation of rising risk aversion because they are much more liquid than the gold market", he said.
As evidence mounts that the U.S. rebound is running out of steam, we see evidence of investors rushing for bonds and other investments deemed to be secure. The price of gold has risen 14 percent this year. The Swiss franc rose to a record against the euro on Aug. 31 and the yen last month reached its strongest level against the dollar since 1995.
Roubini said:
I believe that gold is going to trade around current level. There are two extreme events that lead to a spike in gold. One is inflation, but we have no inflation in advanced economies. If anything, there is a risk of deflation. The other event in which gold prices go up is the risk of a global financial meltdown, and that tail risk has been reduced because we backstopped the financial system.
We can try to prevent double-dip recession, but the idea we are going to have rapid recovery of growth to potential in advanced economies- U.S., Europe, Japan- is mission impossible.
Without question Roubini was right about his predictions on the US housing bubble. That does not guarantee that he is right on gold. He doesn't like gold. He got into a famous media fight with Jim Rogers last year when he said Rogers' prediction that gold will reach at least $2,000 an ounce is "utter nonsense." At that time he said maybe gold will reach $1,100.
In fact, in a 2007 video interview on TheStreet.com Roubini predicted gold prices will weaken. Roubini has been proved wrong on gold over several years. Now all we have to do is wait to see if Rogers, who predicted the start of the commodity rally in 1999, is right about this $2,000 target for gold.
Another noted economist who doesn't like gold is Harvard University historian http://en.wikipedia.org/wiki/Niall_Ferguson who also spoke at the Cernobbio conference. He said the global economy remains plagued by the trade imbalances that helped trigger the financial crisis and that U.S. consumers are not going to provide the engine of growth. Nothing is going to replace the U.S. consumer in the short term, he said. He agreed with Roubini that growth in developed economies will remain lackluster, and said that "big political storm clouds" are gathering in the U.S. if the Democratic Party loses control of Congress and President Barack Obama's leadership becomes hampered.
"What we see now is a period of very depressed growth in the developed world," he said.
Back in 1999, just before gold began its bull market, Ferguson said:
The http://goldnews.bullionvault.com/gold_end_history_death_ferguson_nexus_100920072 appears to have arrived. True, total blackout is still some way off...Gold has a future, of course. But mainly as jewelry.
When interviewed in 2008 amid the subprime meltdown and global panic and some $445 higher per ounce for gold Ferguson said the following about gold: "I have been debating today whether gold bars really are the answer," Ferguson confessed to the New York Magazine . But "they probably aren't." Some $470 per ounce later Fergusson probably regrets his decision.
Now, 11 years after his first prediction and with some 356% gains in gold, he says 2010 is not the time to buy gold either.
"A lot of the upside is already there," Ferguson said live by video-link to the Wall Street Journal several months ago. "The time to buy was in 1999, not 2010..."
We give economists who are willing to go out on a limb and make long-range predictions a lot of credit. It takes courage. It's difficult enough making predictions from week to week, or even day to day.
Speaking of predictions, let's take a look at what some of the top economists are saying now. Although the traditional time to do this is at New Year's, it must be New Year's somewhere around the globe (in fact, it's Rosh Hashanah), so here goes:
Paul Krugman: Delusion #1 is that we're on the road to recovery, just more slowly than we'd like; to be fair, the White House keeps saying this.
If you ask how long it will take us to return to, say, 5 percent unemployment on the current track, the answer is forever.
Delusion #2 is the belief that the stimulus may yet do the trick, because there are still substantial funds unspent. The level of GDP depends not on total funds spent, but on the rate at which funds are being spent, which has already peaked...It's all downhill from here.
Jim Rogers: Asia Will Drive Agriculture Commodities Higher
There are 3 billion people in Asia and most of them have not had a very good standard of living in the past 200 years. That is changing and changing very rapidly. They are going to eat more; they are going to wear more clothes.
Jim Rogers: Trying To Push the Problem Out To the Future, And Printing Money Will Not Work
Trying to push the problem out to the future, and printing money, we just had another example here in the US, it didn't work and it's not going to work.
Peter Schiff: Things Could Get Very Bad In This Country
Things could get very bad in this country, and people might want to leave, and when they do, it might be illegal to leave with your gold or your money.
Short note from your editor: Remember that article about the way how "Health Care Reform Act" will influence on gold coins?
Marc Faber: Markets May Trade Down Into October - November
I think that there are people who have extreme views either extremely bullish or extremely bearish. I think we may be in a kind of a trading range whereby first we go down somewhat into October-November and then rally again towards the end of the year.
I think the difficulty is what to do with money when interest rates are essentially at zero on US dollar then obviously people look at their portfolios and they see stocks that have dividend yields. In Singapore, Thailand, Malaysia, you can have stocks yielding 5% on the dividend. So, the money flows essentially into these stocks.
We will not weigh in with long range predictions in this particular essay, but as a quick note - we don't think that gold would form the final top lower than $5000, and silver lower than $100. For projections of what will happen in the near term in the precious metals market, let's turn to the technical portion of the Premium Update and begin with analysis of the Euro and USD Indices. We will start with the long-term Euro Index chart (charts courtesy by http://stockcharts.com/.)
Euro and USD Indices
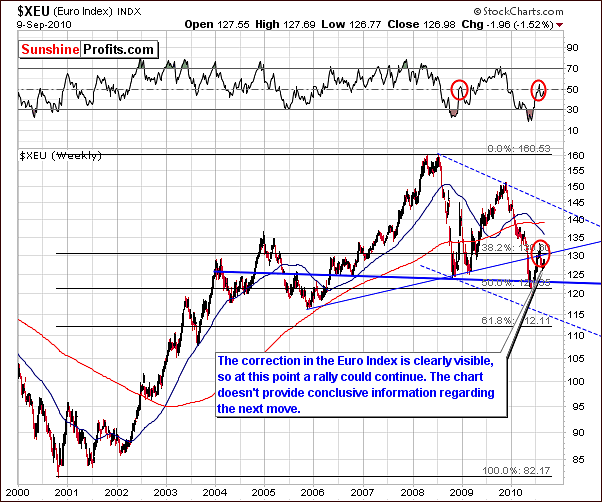
The long-term Euro Index chart didn't change much this week, and the reason that we feature it, is that it does provide us with a big-picture perspective and ensures us that the correction that we have seen in the past weeks is visible from this angle.
As you may see on the chart below gold has recently moved more or less against the Euro.
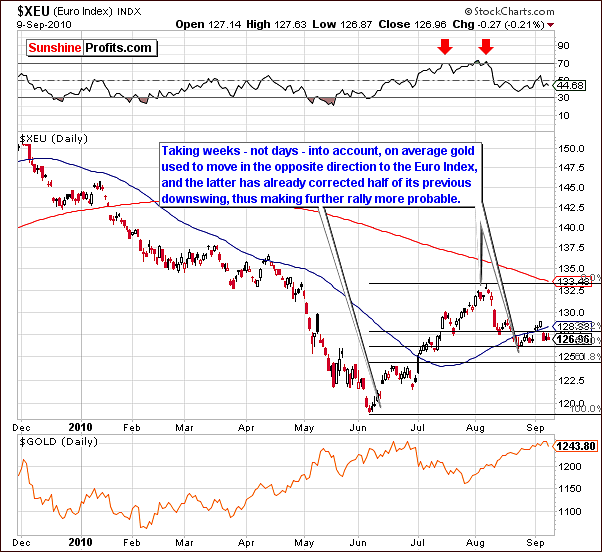
At this point the odds favor the outcome that the correction has ended and we may see the rally resume very soon, which consequently could lead to lower values of gold, silver, and mining stocks.
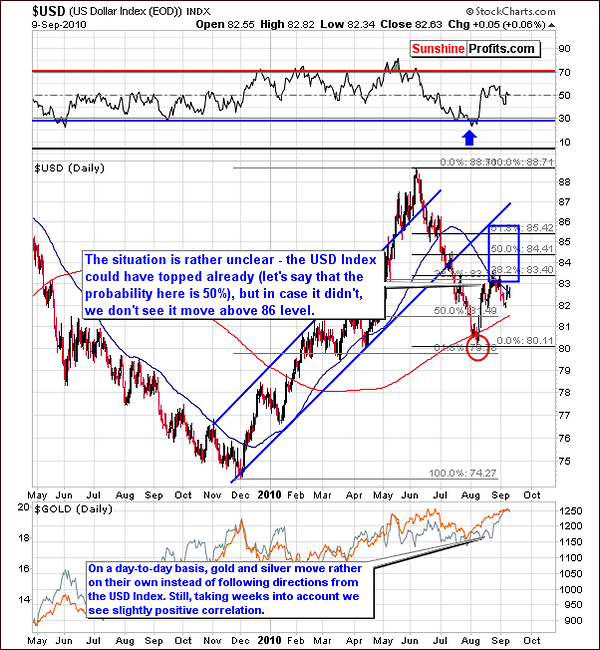
In the long-term USD Index chart, there has been little excitement, much as was the case discussed previously in the Euro Index activity. Since the euro accounts for more than 50% of the USD Index activity, it is not surprising to see lackluster performance in both markets. A strong move in either direction normally has significant impact on the other index and, likewise, lack of direction breeds the same.
There has been somewhat sideways movement for some time now and there is little evidence that any dramatic change will be seen soon. The local top may in fact be in. Should this not be the case, however, it is not likely that the index will move past the 86-level as the uncertainty across global markets appears to be contributing to minimal strength in most of the major currency markets.
The precious metals sector has been somewhat in tune with the USD Index of late, taking weeks into account. For this reason, there is a possibility that any decline in the dollar's value could negatively impact gold, silver, and mining stocks.
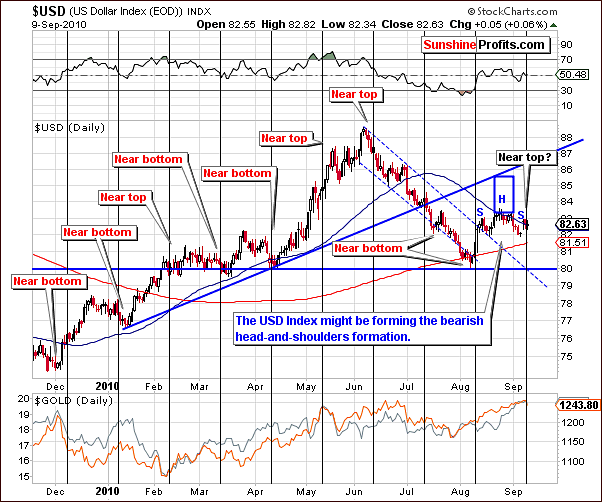
The short-term USD Index chart shows additional head-and-shoulders pattern development this week. Index levels moved slightly higher as for the fifth week in a row, the trend was the opposite of the previous week, perhaps forming second shoulder It's completion could mean that USD Index is likely to move decisively below 82-level which is now the neck level. Since the beginning of August, small declines have been seen with weekly increases sandwiched in between. In fact, Thursday's closing index level was identical to the close of both four and seven weeks ago. Additional declines at this time, especially if the index moves below the 82-level (the "neck" level of the head-and-shoulders formation) could indicate further declines as a continuation of that, which began in June.
Normally (during most years of the current bull market) declines in the USD Index are positive news for precious metals since they are priced in US dollars. This has however, not been the case in the recent months as gold, silver and mining stocks seem to have been responding to the weakness in the euro rather than to the US dollar. The fact that especially in recent weeks, but generally the whole year, the precious metals have been euro weakness driven speaks volumes about the influence of the European investors on world-wide prices of gold, silver, and other precious metals.
The level of the USD Index is currently at its 50-day moving average, which proved to be a critical resistance/support level many times in the past. In addition, a likely turning point is at hand as indicated by the vertical black lines in the short-term chart. By the way - you may recall that in the past these lines were red. We've changed their color to emphasize the fact that we have re-examined this tool and hopefully improved its forecasting accuracy.
The 50-day moving average has historically provided both support and resistance especially in recent several weeks. Given the positive relationship between the dollar and precious metals for the past month or so, there is a good possibility that a local top may soon emerge or actually be at hand in the metals markets.
Summing up, with lackluster moves in both the Euro Index and USD Index continuing for yet another week, major impacts upon gold, silver and mining stocks have simply not been evident. The bearish head-and-shoulders pattern which continues to develop in the short-term USD Index chart may possibly begin to have a negative influence on the precious metal sector. For this reason, gold, silver and mining stocks must be closely watched to enable immediate identification of imminent local tops.
General Stock Market
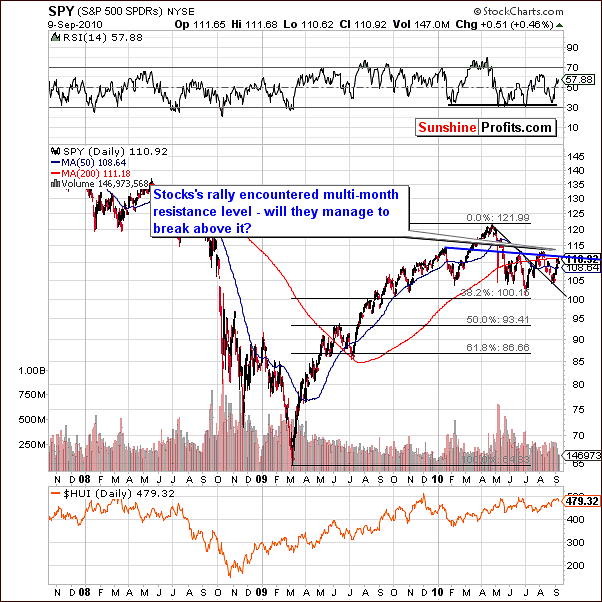
This week's long-term SPY ETF chart (a proxy for the general stock market) shows that Thursday's closing level was quite close to the multi-month resistance level for stocks. This is a true crossroads and there is some uncertainty as to which direction stocks will take. Although declines are possible, it seems more likely that stocks will rally from here, possibly approaching the high levels seen in mid-April and decline after that. Both scenarios would confirm the Hindenburg Omen described two weeks ago and because it is long-term factor it simply cannot provide us with significant short-term clues at this point. This week‘s short-term chart will provide more clarity on this issue.
On the above chart, we see a number of factors, which could possibly support a rally in the general stock market. First, volume levels have been limited during recent sideways movement. This appears to support the theory that some consolidation has been taking place. Next, the value of the SPY ETF is not yet at its resistance line, and the RSI indicator (in the upper part of the chart) is not in the overbought territory either.
Finally, we might see a reverse head-and-shoulder bullish formation based on the May, July, and August bottoms. Once the "neck" level between $112 and $113 is broken, we could expect stocks to move higher once again. For all of these reasons, stocks appear more likely to rally from here rather than decline.
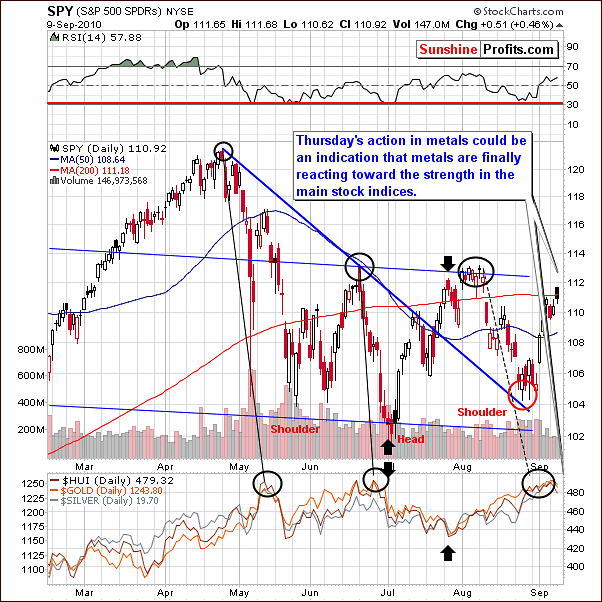
As we have stated in previous updates, gold, silver and mining stocks used to trade in the opposite way to the general stock market, at least for last two months, but that was just the general tendency, not necessarily meaning that tops and bottoms coincide in day-to-day basis. On Thursday and for the past week on the whole, several declines were seen in precious metals markets which have been on the rise for several weeks. This could signal the beginning of the long awaited declines for gold, silver and mining stocks but caution must be exercised at this time since many of these declines have been seen only on one day. Let's emphasize it's not we've said once that we expect precious metals markets to decline and now we are looking for confirmations of our theory. We are watching the market day-by-day and report to you what it tells us. Being objective requires us to stay cautious, as we've seen only little lower prices recently. Significant clues should be forthcoming soon to further clarify this issue.
Summing up, stocks appear to be at the crossroads and there is much evidence supporting a rally from here. Gold, silver and mining stocks would likely be adversely affected by such a rally and we remain bearish for precious metals from the short-term point of view at this time.
Correlation Matrix
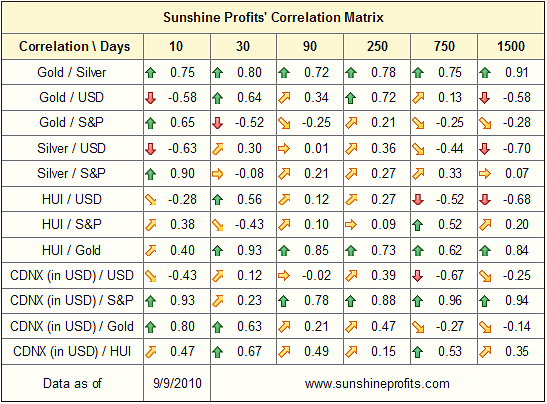
In the Correlation Matrix this week, two coefficients are of particular importance. Both are in the 30-day column and although the 10-day column appears to be contradictory, it is not very meaningful, as 10-day values tend to change rapidly. Gold is positively correlated with the USD on a 30-day basis and negatively correlated with stocks. This is an important point to take note of and is consistent with the overall view being presented in this week's Premium Update thus far.
Gold
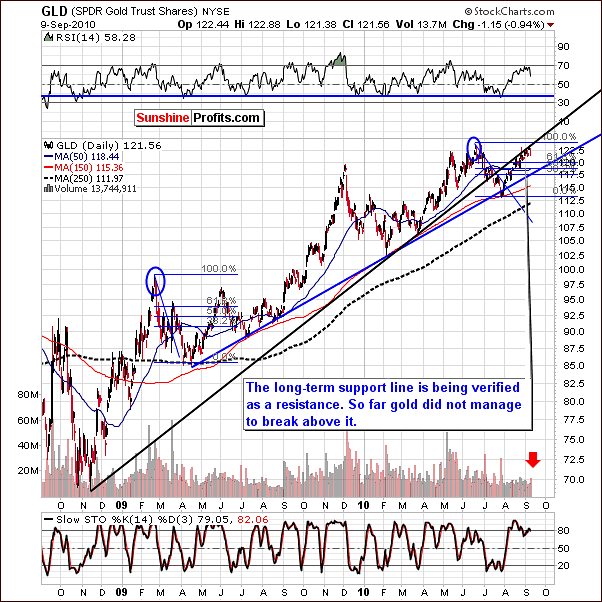
The long-term support line has continued to hold gold's rally in check as was the case last week. No breakout above this line has been seen, although several small moves above it have taken place on an intra-day basis.
Thursday's closing price for gold was down below Wednesday's record high and was accompanied by relatively high volume. Additionally, the RSI has moved slightly lower and, in the past, this in the past has indicated that a correction was underway. Although caution is still imperative, we may be seeing the beginning of a correction.
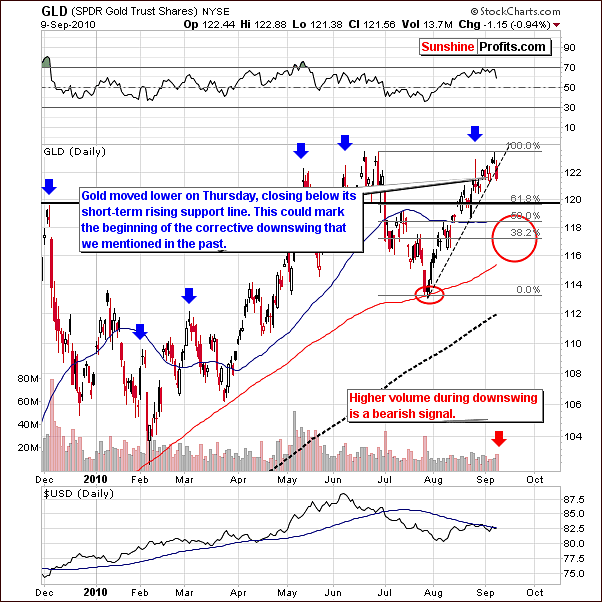
On the short-term chart this week, it is clear to see that gold's price moved below the short-term rising support line for the first time in over a month. This could very well confirm a downtrend for the next week or two and this possibility must be held in high regard especially over the next few days. The GLD SPDR Gold Trust Shares closed lower on Thursday compared to one week prior. This had not happened for the past five weeks and the same holds true for the upcoming $GOLD UDN Index. It is important to note, however, that there is still the possibility that this is but a temporary setback to the recent rally.
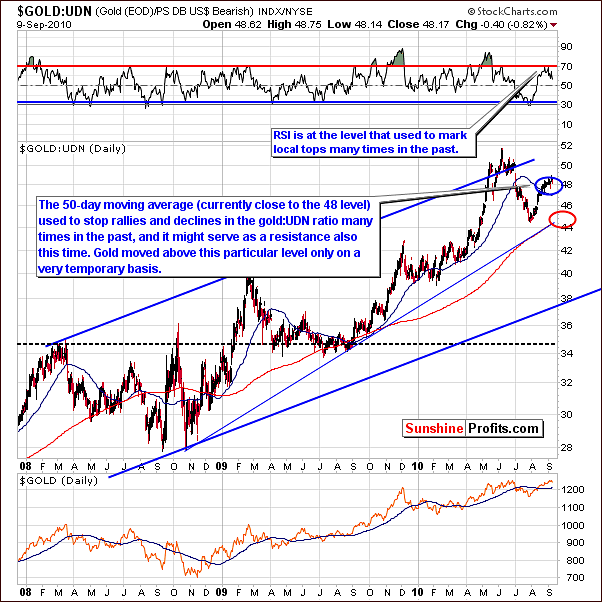
From a non-USD perspective, gold (the gold:UDN ratio) is close to 48, which is also very near the 50-day moving average. This level has provided resistance in the past and with only a few temporary moves above it recently, it still appears to be capable of stopping gold's rally here. Also, the RSI has moved slightly lower from near 70 and this could further support the possibility that the top is in.
Summing up, gold has failed to break above resistance lines and RSI levels support the possibility of a correction being underway. Support for this possibility is also seen in the non-USD chart and slight declines have been seen in several gold stocks' price levels this week which is a marked change from the trends of the past several weeks. The signal thus far is not extremely clear but cannot be ignored since it does indeed mark a notable change away from the consistent upswings seen for over a month.
Silver
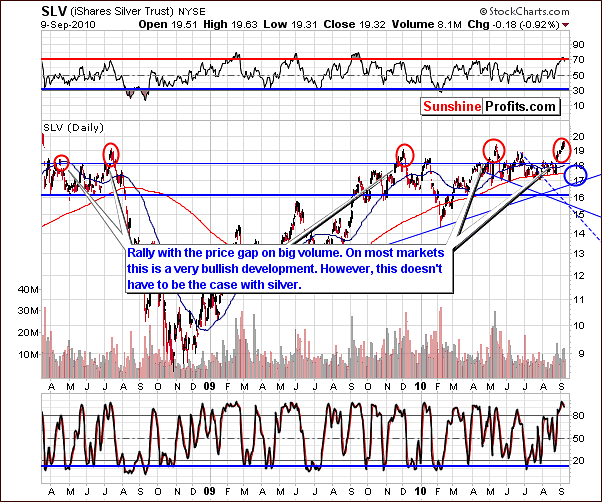
This week's long-term silver chart shows a new development in the RSI. Recall that last week, the RSI on silver's long-term chart had just touched the 70-level. This week, it moved down slightly and this type of directional change at this elevated RSI level has frequently coincided with local tops for the white metal. This happened on three occasions last year. It is clearly seen in our chart during the months of February, June, and October, 2009.
Although a rally with a price gap is clearly visible in silver's long-term chart, it must be remembered that silver is not a simple precious metal to analyze. As mentioned in last week's Premium Update, silver analysis is quite tricky and frequently, the typical market signs do not apply. General speaking, a separate interpretation is needed when concerning the white metal....Consequently, analyzing the gold market and corresponding equities should prove useful even if one is interested in silver only.
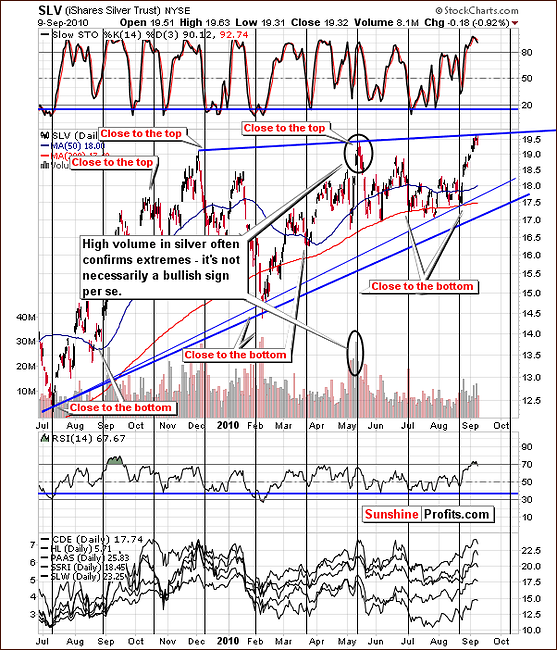
The short-term chart for silver this week shows that it's quite possible that the recent rally has been stopped by the multi-month resistance line. This would point towards a correction being likely, especially when considering the speed of the rally itself. Another point worth mentioning is that since we've revisited turning points in USD Index we figured that it might be good idea to optimize the cyclical tendencies for silver as well and see if perhaps we can find something more applicable to the white metal.
In fact, we had and the good news is that the accuracy did increase, however, from the other hand there is little additional information of significance today other than perhaps the implication that an early October local extreme seems to be implied by the patterns in general. Please note that the only thing that it suggests is that this is the time when we are likely to see some kind of local extreme. It does not explicitly say that there will not be any additional extremes before this date.
Summing up, silver's outstanding performance of late may be coming to a close. Several factors support the possibility of a downturn for the white metal and such a reversal would also be consistent with most of the major likelihoods, which have been presented thus far in this week's Premium Update.
Precious Metals Stocks
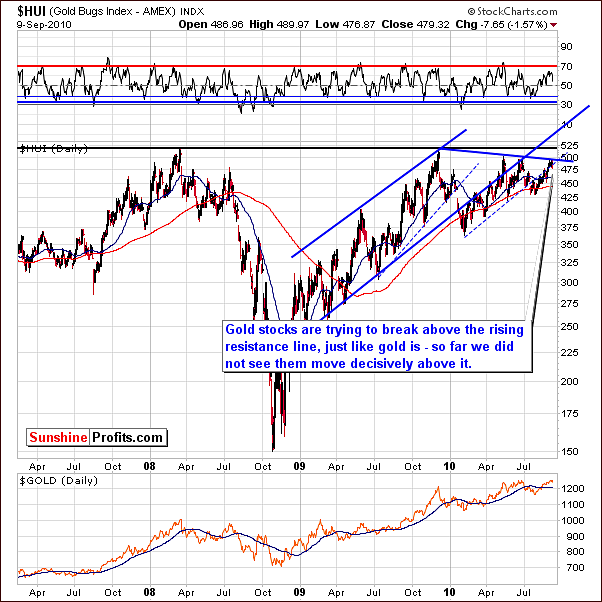
Once again this week, the resistance line created by recent local tops has stopped the gold stocks' rally. It appears that there is simply not enough strength at this time in the gold stocks themselves to surpass this level, which makes the possibility of a correction here more plausible.
The HUI Gold Bugs Index itself closed down for the most recent Thursday to Thursday week for the first time since late July. Over that time, the index gained nearly 12% when comparing last Thursday's close with that of July 29.
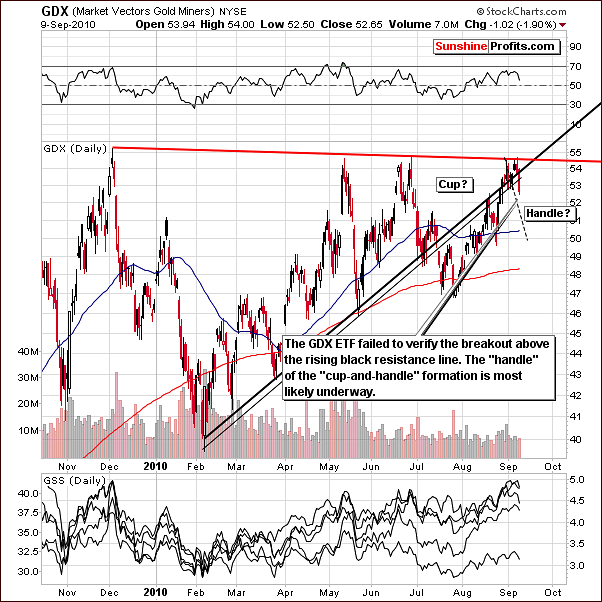
In this week's short-term GDX chart we see that once again, the rising resistance line was not broken. This further supports the likelihood that lower prices are likely before any additional rally can materialize. And as mentioned in last week's update, lower volume levels may be an indication that buying power is drying up which would further support a likely decline in prices.
Updating the cup-and-handle pattern which was also discussed last week, the cup portion of this pattern still appears to have formed and the handle may actually be forming right now. The likely bottom could still follow in mid-to-late September with a possible rally in the weeks to follow.
And an important paragraph regarding speculation bears repeating this week: Although this is quite speculative as of now, we are looking at all possibilities and feel that this is worth mentioning due to the positive risk-reward ratio which it would present. Short positions could be closed and long position opened with great profit potential for those who are prepared if such an opportunity materializes as previously described.
Additional confirmations come from two charts that we've also featured in the previous weeks. The first one comes from the Gold Miners Bullish Percent Index (a market breadth/momentum indicator that is calculated by dividing two numbers: the amount of gold stocks on the buy signal (according to the point and figure chart) and the amount of all the gold stocks in the sector).
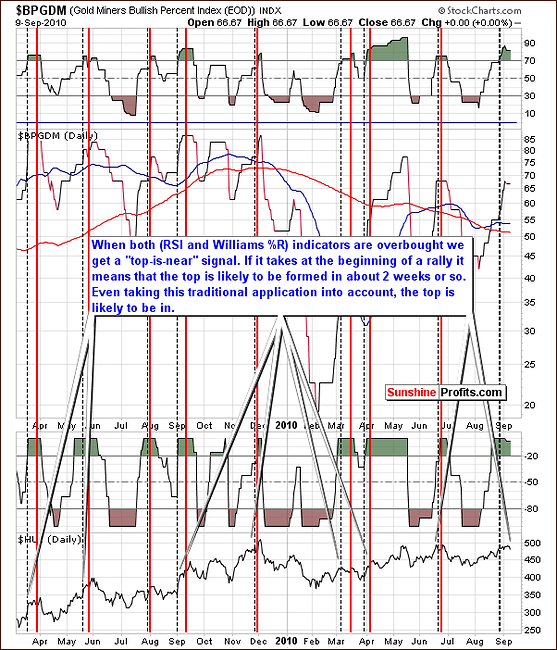
The Gold Miners Bullish Percent Index continues to indicate that the top is close or already at hand. - as explained on the chart itself This reliable indicator has been suggesting an imminent local top for some time now and other tools which are at our disposal this week tend not to refute this as a strong possibility.
Last, but definitely not the least, chart this week is the GDXJ:GDX ratio measuring the way that juniors outperform big senior mining companies. Two weeks ago we've featured this chart for the first time. At that time we wrote the following:
The GDXJ:GDX ratio involves both juniors and seniors and gauges the emotions relative to the general stock market only. In other words, while the GDXJ:SPY ratio is designed to isolate the influence of the emotions related to gold, the GDXJ:GDX ratio aims to isolate the influence of the general stock market on juniors. In the past we have emphasized many times that the junior sector is influenced by moves on the general stock market, and if that is the case, we should see that in the ratio - and we certainly do.
Please note how perfectly the candlestick and line patterns align - juniors' performance relative to seniors is clearly driven by developments on the general stock market (while the chart doesn't say that, it's obvious that the relationship is not the other way around - it's hard to imaging Google, McDonald's, Walmart, and thousands of other stocks being driven by the small juniors mining companies). Remember the 2008 carnage on the general stock market that caused a deep decline in the values of many junior stock companies? Many analysts (who lost their money as they didn't diversify between many parts of the precious metals sector, not to mention diversification between strategies) were screaming about manipulation that had supposedly taken juniors down. It would most likely not be the case had they known about the abovementioned relationship.
Anyway, the important thing on the chart above is that since early August we see a very strong divergence between the GDXJ:GDX ratio and the SPY ETF (proxy for the S&P 500 Index). Since the second week of August, this ratio has rallied while stocks have declined.
Our interpretation of this fact is that something else is driving juniors and that it has to be related to emotions concerning gold and silver. Right now, optimism is excessive enough for the ratio to move higher even despite stocks' decline. One of Warren Buffet's quotes - "be fearful when others are greedy and greedy when others are fearful" is profoundly applicable to today's trends, as the above chart should make one concerned about the healthiness of the current rally.
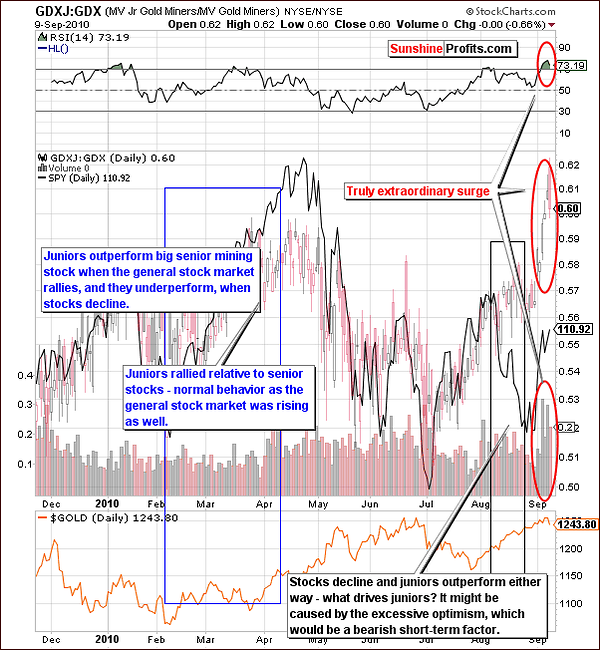
The new development on the chart above has been marked with red ellipses. The GDXJ:GDX is clearly showing that investors appear to have extraordinary optimism and with high volume levels, a huge rally behind us, and Thursday's closing ratio at 60, all signs seem to be indicating that the decline is very close or has begun. Once again, consistency appears to be the norm throughout our update this week.
Summing up, the list of supporting indicators suggesting that a correction is very possible and may be seen very soon continues to grow. This week, most of the tools and indicators we use regularly are consistent with this possibility. Once again, we remind our Subscribers that this may provide excellent opportunities to enter the market with favorable risk-reward ratios and tremendous profit potential. We will continue to watch for these developments daily and inform our Subscribers accordingly when the situation warrants.
Just one additional tongue-in-cheek comment we simply cannot resist. For much of our history at Sunshine Profits, many investors (also our Subscribers) have been eager to send us feedback, comments, and recommendations (thank you). One Reader (in case you were curious - he is not and never was our Subscriber) in particular has been quite vocal and we have mentioned his comments several times in the past - for instance right before the Dec 2009 top (in the Dec 4th, 2009 Premium Update), when this Reader expressed his dissatisfaction with our essays, which at that time suggested caution when buying gold. This Reader sends us e-mails every few months, and the only common characteristic of them is that somehow he manages to be exactly on the wrong side of the market when sending us these messages. Well, this week this particular Reader has strongly communicated to us the fact that he is very bullish on gold at this time. In fact that could serve as additional confirmation of possible downswing we've been lacking recently.
Other information
Moving on to the correspondence from our Subscribers, we will start with question about silver and if it usually starts to drop first when a correction begins.
In general silver does often top in double-top pattern and the first top takes place earlier than the final top in gold, however, it is not always the case. This means that when we see this formation in silver it provides us with additional signal that the top is likely in. However, if we do not see such a signal, it does not provide us with negative confirmation. It is not symmetrical situation, so we cannot rule out that the top in gold is in just because of missing double-top formation in silver.
Our second question for today is if it is better to avoid short cycle trading and predicting downturns especially in mania phase. Well, yes, it is generally true that bull markets end in the form of a speculative mania phase when it is advisable to just sit tight and hold on to your position that is going to appreciate very fast. However, this will be the case in the third stage of this bull market - when public catches the gold fever - and we don't think that we are there yet. The public following Precious Metals market is not excessively huge as it should be if it was the third stage of the bull market. Before entering this third stage of the bull market we still need to take corrections into account and treat them as something inevitable. Once again, we would like to emphasize that speculation should be executed with only part of one's capital, because this way in case you are wrong and don't participate in rally you don't do that with only part of your capital.
The third important question that we would like to comment on was about timing of the inevitable correction in Precious Metals and how one should deal with it. While it might to appear as similar at the first sight, the above question is also a question about the portfolio structure and how it could influence ones gains or losses over time. Not every trade can be won, which means that one needs to deal with that, and the key question is how.
Choosing appropriate horizon and position size should be very first step of your strategy. We realize that this could be easier said than done, as there are many websites where you can read "only investing long term can make you rich" and on others they state that "in the long run we're all dead - investing short term is what you should do". Which of these assumptions are correct? Which are false? Neither? Both? As the answer is pretty complex we would like to encourage you to read "The Universal Investor. Speculation and Investment" in the Research section. Many of you already know this essay, however, it is essential to understand its message and even if you don't apply this solution to your own investment strategy, it should still make you aware of the risks associated with using too much of your capital to a single trade.
Additionally, this essay is answering the question, why it is better for vast majority of investors to mix these two approaches and how can they be complementary with each other.
A note about next week and the following 10 days:
Since creating Sunshine Profits over two years ago, we have worked diligently on a daily basis in order to provide every Subscriber with a complete arsenal of tools, upon which to based investment and speculative decisions in the precious metals sector. My family now insists that I take just a bit of time to rejuvenate and recharge and I believe I will be the better for it and so the quality of my analysis.
Therefore, next week's Premium Update will be published a day early on Thursday, September 16. In that update, we will let you know what to expect, and how to react to various developments on the market that we might see in the following days. I will be away from my office for ten days and there will be no Market Alert capabilities for Sunshine Profits between September 17 and September 27. Also, the Premium Update will not be published on September 24. The next issue of the Premium Update following next Thursday's will then be published on October 1, but I believe that I will provide you with a quick update also as soon as possible when I get back.
Again, in next week's update, attention will be given to the possibilities most likely to be seen during this period so that barring any catastrophic event, Investors and Speculators will be aware ahead of time as to the best courses of action. Your understanding is appreciated and I truly believe that our journey together will be stronger once I am fully recharged and eager to once again take the reins of this weekly publication.
Naturally, Jacob as always will be monitoring our mailbox, so all technical issues will be addressed on regular basis.
Summary
Continued uncertainty in the Euro and USD Indices has been largely ignored as precious metals sector has finally appeared to have reversed course. Although it is too early to say that tops have been reached, numerous factors analyzed this week point to this as a strong possibility.
As we monitor gold, silver, and mining stocks continuously in the coming days, Sunshine Profits will continue to be prepared with our Market Alert capabilities should important developments occur before next week's update which require quick action on the part of investors to maximize profit opportunities.
This completes this week's Premium Update.
Thank you for using the Premium Service. Have a great weekend and profitable week!
Sincerely,
Przemyslaw Radomski

