
When gold declined last Friday we were not caught by surprise and neither were our Subscribers. Based on our technical analysis, we gave you a heads up two weeks ago when we said that gold was ready for a decline before resuming its upward climb. But sometimes news can rattle the market, which is what happened Friday when gold hit an air pocket and dove $25 in a few minutes to move very close (or slightly below) the levels mentioned in our Friday update.
While it is always the sell order (or rather a large amount of them) that causes a dramatic move, and one should not automatically assume that one single event is responsible for it (without giving it a second thought), in this case it seems that the immediate cause for the decline was news of the Securities and Exchange Commission's (S.E.C.) civil fraud charges against Goldman Sachs.
You might be scratching your head wondering why such an event would affect the price of gold? Intuitively, one would reason that since gold is a hedge against financial-sector risk, gold would shoot up in reaction to such news instead of diving down. In times of uncertainty, investors turn to gold as a hedge against inflation and unforeseen crisis, gold being one of the very few asset classes that is not someone else's liability. But Friday, investors lost their risk appetite and dumped all commodities in favor of the U.S. dollar.
The full story of what happened with Goldman Sachs is complex and the media hasn't done a great job explaining it.In a nutshell, the S.E.C. is charging that Goldman created and marketed securities based on a group of subprime mortgages that were deliberately designed to fail.
Why would they want to do something like that?
Obviously somebody was going to make a lot of money from it. That someone - as it is expected - was the super-savvy hedge fund firm of Paulson & Co, the world's third largest hedge fund. According to the S.E.C., Goldman failed to disclose to investors the role played by Paulson & Co in the construction and design of that particular security. Paulson & Co helped choose securities for this investment and then wagered (successfully) that it would fail. In other words, Paulson & Co, worked with Goldman to pick the assets that went into the security, allegedly choosing the riskiest. Then, Goldman sold these securities to its clients, who readily bought because of their triple-A rating. (Someone should look into how they got this triple-A rating.) Mr. Paulson then placed bets that the security would lose value.
That's like selling someone a house in a flood zone when you have a good hunch a killer hurricane is heading in their direction and taking out large insurance on their house with you as the beneficiary. Or, as someone put it, Goldman played the role of a host in a poker game where Paulson was the card shark and the investors were the gullible, novice minnows. Of course, the house always wins. Paulson & Co paid Goldman $15 million for the service. Paulson & Co allegedly made $1 billion from this particular deal and $15 billion in total betting on the decline in the subprime mortgages in 2007. The firm's Advantage Plus fund, its largest, increased in value 160 percent that year on the back of the subprime wager. Its Credit Opportunities funds, which held the biggest chunk of the firm's bet, were up 600 percent.
We took a look at the Goldman Sachs website, specifically at a section called their "business principles." There were 14 listed. Let's look at the first and the last. The first says: "Our clients' interests always come first." (I guess they meant the BIG client, like Paulson& Co) The last principle says: "Integrity and honesty are at the heart of our business." (No need to comment on that one.)
Paulson & Co said its role in helping to design a mortgage-linked deal sold by Goldman Sachs Group Inc. was "appropriate and conducted in good faith," according to a letter sent to investors.
If you're still wondering what all this has to do with the price of gold, we're now getting to that part. Obviously anyone sharp enough to see the coming of the subprime fiasco and intelligent enough to make billions of dollars from it is one savvy investor. Further proof for us at Sunshine Profits that John Paulson is one smart dude is the fact that Paulson's firm is one of the world's largest investors in gold. His holdings of the SPDR Gold Trust (GLD), valued at $3.6 billion, make his firm the largest holder of that ETF -- representing 15% of his portfolio. Among his other top ten disclosed positions is the AngloGold Ashanti LTD (NYSE:AU) gold mining stock. His ownership of that stock totals $1.7 billion and represents around 7% of his holdings.
Even though Paulson & Co. was not charged by the S.E.C., the sheer mention of the firm in connection with the suit against Goldman was taken to be negative news for gold.
The thinking might have been that investors in Paulson's hedge fund may rush to redeem their shares in the fund, thereby forcing it to sell some of its gold holdings. That argument does not make sense. First of all, most hedge funds require at least a 30-day notice to cash out. Even if the deal Paulson made wasn't exactly ethical, it still made his investors a spectacular bundle of money and the S.E.C. did not press any charges against him. So where is the risk for his investors?
Even if, for the sake of argument, many investors would rush to the exit doors to redeem their shares in Paulson's hedge fund, and as a result the fund would have to sell some of its gold holdings, how would that affect the precious metals market?
Writing this week for Marketwatch, Mark Hulbert crunched some figures.
"For argument's sake, let's assume that Paulson's gold holdings, both physical gold as well as shares of gold mining companies, represent a total of about 30% of his overall investments and are worth around $10 billion. Let's further assume that 10% of the investors in Paulson's fund suddenly get cold feet and ask for their money back.
Given my assumptions, that would lead to the sale of $1 billion of gold and gold shares -- or 0.37% of the total worldwide market cap of gold mining companies and gold owned by ETFs. Not exactly good news, but not particularly momentous, either -- especially since hedge fund investors typically can't get their money back immediately but have to wait a while after indicating their intent to redeem."
Even though it seems that the Goldman-linked SEC case caused the price of gold to dive last Friday, we believe it was only a catalyst to the technical correction that we predicted was coming in any case. We wrote in the last two Premium Updates that gold, which rallied to a four-month high of $1,170.70 on April 12, was poised for a technical correction. So, it seems to us that the Goldman news most likely just triggered an exit opportunity for short-term traders to lock in profits. If we look at the large picture, a blip like the Goldman Sachs story won't make a difference in the long-term inevitability of the gold bull market.
We found it interesting that upon hearing the news about Goldman Sachs, nervous investors would dump gold for dollars. We have written in previous Premium Updates about the mountain of debt accrued by the U.S. government and what it will mean for the long-term value of the U.S. dollar.
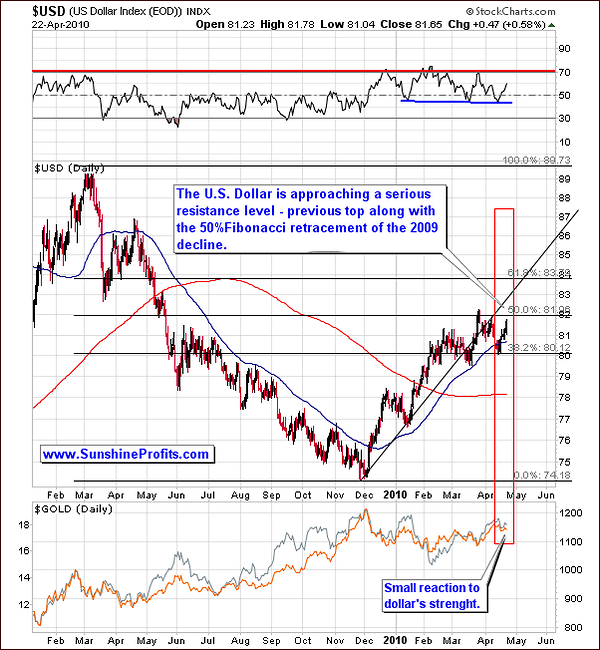
Speaking of the U.S. dollar, let's begin this week's technical part with the analysis of the U.S. Dollar. Let's start with the long-term USD Index chart (charts courtesy by http://stockcharts.com.)
USD Index
In our previous report we wrote the following:
There has been only a very small reaction to the USD weakness. Gold has recently been consolidating and this means that these may move a bit lower before the bottom is in. This holds true for silver and other equities as well.
We felt that the USD would move slightly higher but that its weakness would cause relatively little downward pressure on the precious metals sector. This is exactly what happened over the past seven days as the USD approached its March highs but gold did not respond by moving close to its recent lows. The same held true for silver. So, although the recent decline might have appeared huge on a day-to-day basis, taking a broader perspective reveals that on a relative basis very little downward movement occurred in the PM markets.
This is a very positive sign for PM's as the USD is one of the key drivers for PM prices and the dollar rally seen this week had little negative effect on PM's. We are bullish at present although we do not expect immediate upward movement in gold, silver and mining stocks.
The USD is approaching a resistance level at the 50% Fibonacci retracement of the 2009 decline as well as a previous stop. This may hold this rally in check. However, the PM markets remain strong. Even if we do see another increase (which we don't expect at this point), say to the 83 level, though unlikely, we do not expect a severe decline in PM prices. The USD will eventually, in our view, move lower. This will in turn cause the PM prices to rise strongly as there will be no downward pressure from the USD when its decline begins. Whether this happens in one week or two is unclear at this time but we believe that the decline in the USD is in the cards sooner or later.
We have discussed the correlation between US Dollar Index and the price of gold in one of our previous essays (actually, the mechanism used in this analysis is very close to what the Kitco Gold Index is about - please note the date when the essay was posted on our website, and when the Kitco Gold Index emerged - yes, we wrote about it in 2008). Since understanding it is crucial to grasp the following analysis, here's a quick reminder:
Let's say (theoretically - just for the sake of this essay, as the fundamental situation is way more complicated) that the main factor that decides where the price of gold will go is the value of the US Dollar Index. The undeniable reason is that gold is priced in the USD and, therefore, virtually has to respond to its up- or downswings, by moving in the opposite direction. If the value of gold was perceived as constant by the investors from all over the world and the value of the currency in which it is priced, falls, then in order for the price of gold in their respective national currencies to be stable, it has to rise in terms of US Dollars. If the price of gold did not rise as the US Dollar falls, then foreign investors would see price of gold fall in their national currencies.
Unless foreign investors changed their mind about the value of gold, they would start buying gold, as it now is cheaper for them than it was when they thought the price reflected gold's value. As they would purchase, the price of gold in all currencies would go up (including USD). For people who make transaction in the US Dollar it would seem as if the price of gold has just went up out of the blue, when in fact it would be their Dollars that lost value, while gold's 'real' price was not affected. Like stated earlier, there's more to this correlation between USD and price of precious metals than just what we mentioned above, but it's enough to make a few key points in this essay.
Since USD Index is generally considered the key driver for the gold price, the fact that gold is not fully reacting to the less favorable situation in the dollar market is positive for the whole precious metals sector. That is the case, since it means that the market doesn't really believe that the bounce in the USD Index is anything more than just a temporary phenomenon. People are not willing to sell gold, if they think that USD is up just for a moment. Since the attitude towards gold is positive at the moment, it is likely that it will be this way also if USD moves lower. This would result in gold moving higher by a much greater amount percentage-wise, than the drop in the dollar.
On the other hand, this also implies that it would take a really sizable rally in the USD Index, in order to make gold decline.
Therefore, based on the analysis of the U.S. Dollar Index, we remain bullish on gold, silver, and mining stocks.
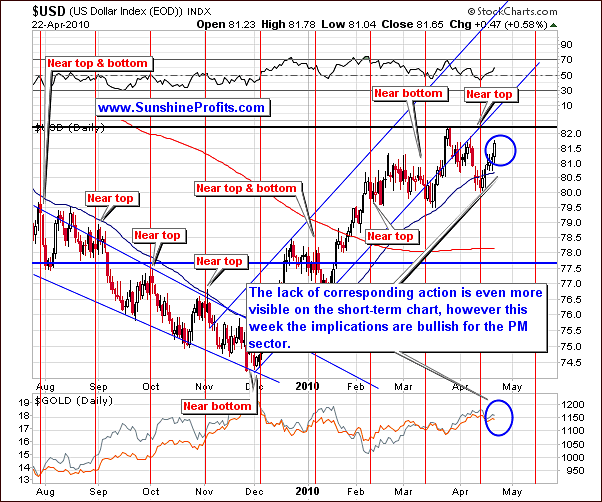
Last week's short-term chart confirmed our long-term observations quite clearly and this week we have a similar situation. Clearly visible is the USD upswing of nearly 2% and a glance at the gold price chart reveals little downward movement during the same period. The USD increase is a bearish sign for gold prices, yet we saw that its effect was barely visible. This has bullish implications for gold, silver, and mining stocks.
Additional signals come from the analysis of the UUP ETF fund, which allows us to analyze volume.
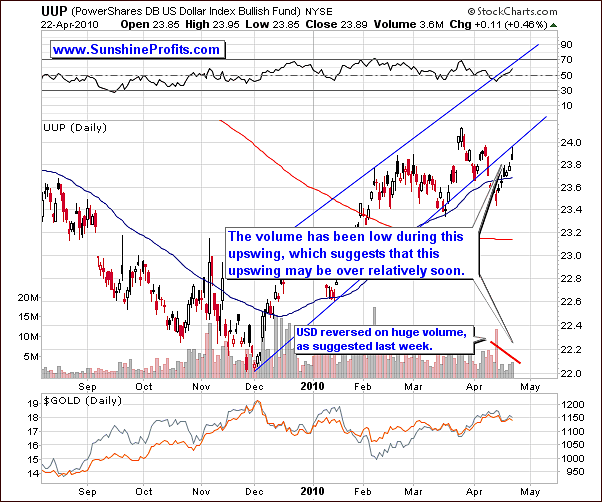
Last week, we stated that the short-term signal in the UUP/ETF chart was bullish, as we had seen strong volume during the reversal pattern. This indicated heavy selling followed by an increase in price on the same day.
It turned out that we were correct on predicting this short-term reversal in the USD Index. Although the USD did move higher as expected, the volume was quite low, suggesting that this rally may not have far to go. The RSI indicator is well below 70, which marked a local top in the past. Although we may see it approach 70 in the coming week, this is likely to be followed by a decline in the USD index, an end to the rally, and higher PM prices.
Summing up, the USD rally is likely to slow and soon come to an end. Gold, silver, and mining stocks, having shown strength during the recent USD rise, are poised to surge upward once the current USD rally ends. Should the USD rally continue in the coming week, expect continued minimal declines in the PM sector as its strength continues to hold prices in patterns similar to recent weeks.
General Stock Market
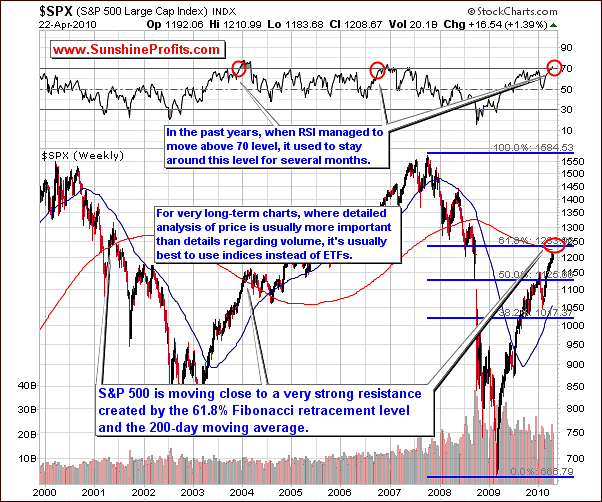
The general stock market appears to still be heading for a correction; however it may take some time before the top if reached. The very-long-term S & P Large Cap index chart is nearly identical to last week, as the prices were trading sideways during the last several days. Please note that the S&P 500 Large Cap Index chart gives a better analysis than the ETF when price alone is concerned. ETF can, at times distort price and reduce the reliability of our technical tools from the very long perspective.
In past years, when RSI was in the 70 range, it used to remain there for months before moving below 70 once again. This means that the general stock market did not plunge - it kept rising or declined steadily.
Normally, RSI at 70 suggests that the market is likely to top very soon. However, once RSI goes above that level, it indicates that the momentum is so strong that it may take additional time before the buying power dries up and the top is reached.
At Sunshine Profits, we strive to use every tool and take all signs into perspective in order to lead our subscribers to maximum profits, and this time it seems that the regular use of the RSI indicator (taking the weekly closing prices into account - as visible on the chart above) might be misleading. Our analysis indicates that the general stock market will move sideways or continue its upward trend for the near future. With regards to the PM market, we have no technical evidence that a plunge of any kind is imminent. Even though there has been a strong recent rally in the general stock market, we remain bullish on gold, silver and mining stocks. A PM rally is actually a possibility in the following weeks.
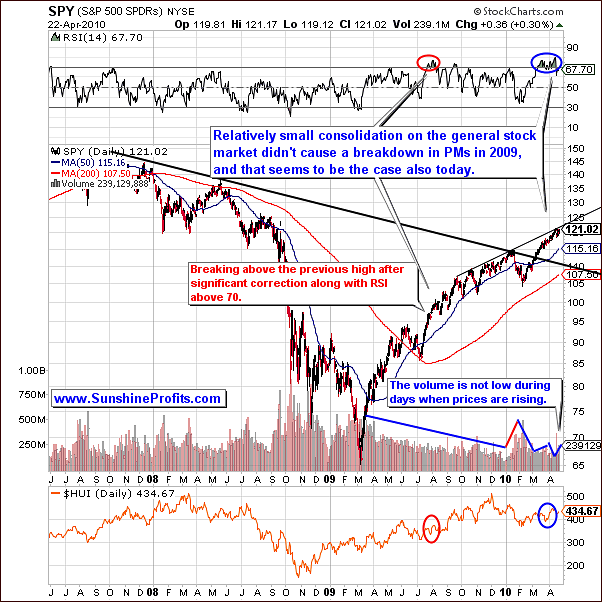
For the long-term, we see that the RSI is below 70 (taking daily closing prices into account). We are not in a clearly overbought situation. Therefore, we feel the situation is less bearish than last week.
Interesting piece of news this week is that we have seen the return of higher volume especially in recent days. Perhaps, this indicates that the small consolidation is complete. Also, the RSI confirms this. Therefore, if PMs are to trade in tune with the general stock market (which is the case - we will comment on that further in the Correlations section), both markets may very well go higher in the coming weeks. The general stock market's upward trend for the past few months is not a threat in our view. Again, we remain bullish on PM's in medium-term.
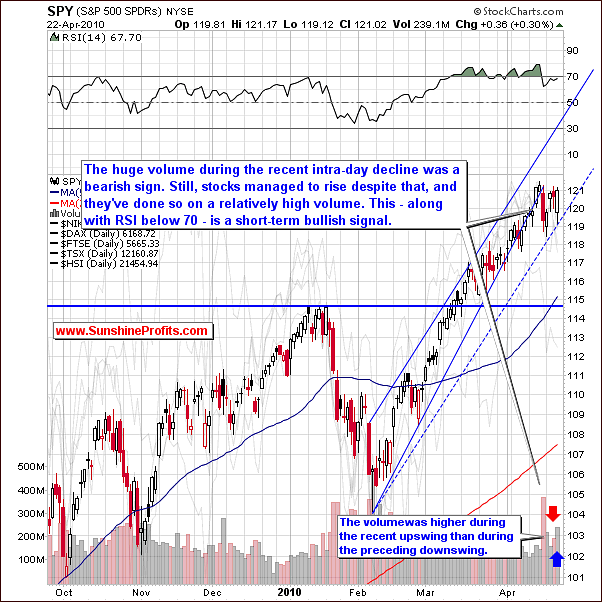
Moving to the short-term chart, this week we've seen a breakdown below the initial rising support line. It was stopped by the lower border of the trading channel, which is a normal occurrence. We have seen the market trading sideways of late and the RSI below the overbought level although quite close to it. Given the strength of the momentum shown by this market, continued upward movement is a strong possibility.
Following a slight breakdown at the beginning of the week, recent volume levels have been higher on upswings as compared to downswings, confirming the strength of this rally. Multiple signs and indicators cause us to be bullish on stocks and expect the general stock market to move higher from here in the short-term. Keep in mind that although a short period of sideways movement may be seen, we expect the upward trend to continue. Eventually this overbought market will see a correction. We do not feel this is imminent at this point; the way we read the charts does not suggest that the top has yet been reached.
Another confirmation of higher prices to come in the general stock market is the relative performance of the strongest stocks themselves. An example is Apple, Inc. (AAPL), which we view as a company with very good fundamentals. Recently this stock has seen strong upward movement on strong volume. Please note that it is far more common for strong stocks to lag behind a surging market when prices are close to the top. We are not seeing this today.
Summing up, as we stated last week, a correction is inevitable for the general stock market, but its exact timing is unknown at present. We still believe that the overbought status of today's market indicates that the longer this correction is delayed, the sharper the decline will be. Today's signals still do not indicate that this downturn is close, so with that we see late-April and early-May as a continuation of weeks past with some slowing to the uptrend and occasional sideways periods probable.
Correlations
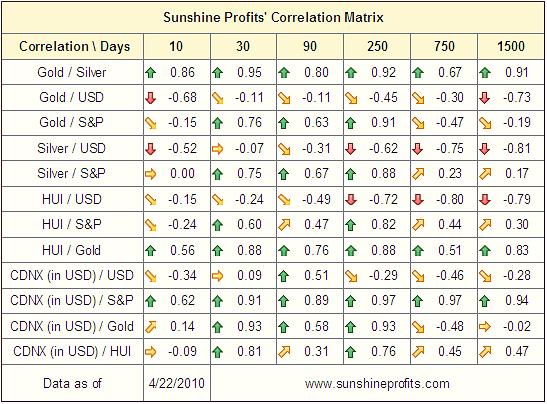
This week we have some significant changes in the correlation matrix, which means that the strength of influence on the precious metals market from USD / general stock market has changed.
As you may recall, last week we had very few correlation values of significance. The USD and general stock market were not correlated with gold and gold stocks. This week however, in the short-term 30-day column, note the high values between gold, silver and precious metals in relation to the general stock market on one hand, and low values of analogous coefficients between PMs and the USD Index.
In other words - PMs are to a considerable extent moving on their own right now (as mentioned last week), but if we were to pinpoint the market, which they are moving in tune with at the moment, it would be the general stock market, not the USD Index.
This suggests that if USD rallies sizably (which we don't expect at this point) it doesn't seem that PMs would be affected to a very big extent. We've already emphasized this in the USD section of this update, so readings from the correlation matrix provide us with a "statistical confirmation."
This is a part of the reply to the interesting question that we've received this week about gold, U.S. Dollar and Euro. The question was:
Since Greece looks likely to default ... Are we now looking at a major drop in the value of the Euro resulting in a major rise in the value of the dollar ... resulting in a collapse of gold prices?
In addition to the points made above, we would like to provide you with additional thoughts regarding that matter, as there is another reason as to why the Euro down -> Dollar up -> Gold down is not that simple.
The market mechanisms would work in the above-described way if we assumed that the value of gold in Euro couldn't change. In this case if value of Dollar increased against the Euro it would have to mean that its value against gold would also increase. In other words, value of gold in USD terms would indeed decrease.
However, not only can the value of gold in Euro change, but it (as you will see on the gold:UDN ratio chart, which trades very closely do the gold in Euro) has very strong technical reasons to rally.
Now, if we assumed that the value of gold in Euro moves much higher ceteris paribus (all other things unchanged), then the above implication (Euro down -> Dollar up -> Gold down) loses its reliability.
Let's take a look at a simple simulation:
- gold in Euro moves up by 100% from 1,000 to 2,000
- Dollar goes up against Euro from 0.7 to 0.9 (meaning that 1 dollar used to buy 0.7 Euro and now it buys 0.9 Euro)
What impact does it have on gold in the U.S. Dollar?
At the beginning gold traded at $1,429 (1000 / 0.7) and now it trades at $2,222 (2000 / 0.9), which means that it increased by about 56%.
So - we have an increase in the value of gold in both: USD and EUR, which means that gold increased its value against the U.S. Dollar while the Euro decreased its value against the U.S. Dollar.
Of course, the numbers above are just hypothetical, and everything depends on the sizes of the respective rallies/declines, but the above example clearly shows that a decrease in the value of Euro (against the Dollar) does not need to translate into lower price of gold.
At this moment, it's not hard to imagine European investors to purchase gold in response to the Greece-related turmoil. Yes, there will be investors willing to purchase dollars as a safe-haven (which we find rather ironic at this moment), but some may be willing to purchase PMs. As in many other cases - charts provide timing details, and right now, the situation appears bullish - also from the non-USD perspective - we will get back to this issue in the following part of the update.
Summing up, values from the correlation matrix strongly indicate that PM's may move higher along with the general stock market, which serves as a confirmation of points made earlier. We expect a period of consolidation followed by rising prices in the PM sector. Charts in the following sections will further confirm this.
Gold
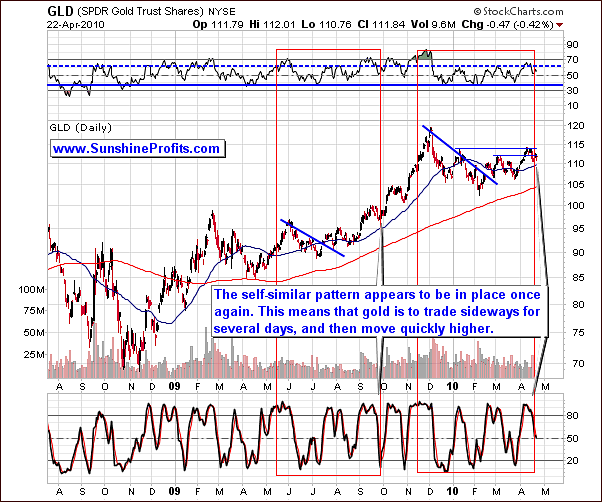
The big news is that we have seen the return of a self-similar pattern meaning that past performance would likely be replicated to a considerable extent. This week, we saw a continuation of this trend. In the latest Market Alert, we suggested buying gold, silver and mining stocks even though a period of sideways movement may be imminent. We did have some sideways movement this week, as indicated at that time and with the RSI moving down from around 70 to 50 it seems that gold is becoming ready to rally soon.
The 50-day moving average also comes into play here. Please note that at the end of September 2009 gold bottomed after declining about half of the distance between previous high and the 50-day moving average. This is also where we are today, which suggests that gold is not likely to move below the very recent low - or even if it does - that it would move much lower.
The Stochastic Indicator suggests that it should be below the 20 level before the true bottom is reached. Presently it is around 50. This indicates that we may need to see further consolidation with gold trading sideways in a tight trading range. However, at this time, we feel there is too much risk in waiting for even lower prices. Therefore, we continue to believe that being in the market right now is a good idea - it minimizes the chance of missing the move, just in case PM sector moves higher very soon.
History tends to rhyme more often than repeat and therefore we do not advise waiting for the Stochastic Indicator to drop to 20. It may, for instance, only go down to 30 or even 40 before the consolidation completes and the rapid rise begins.
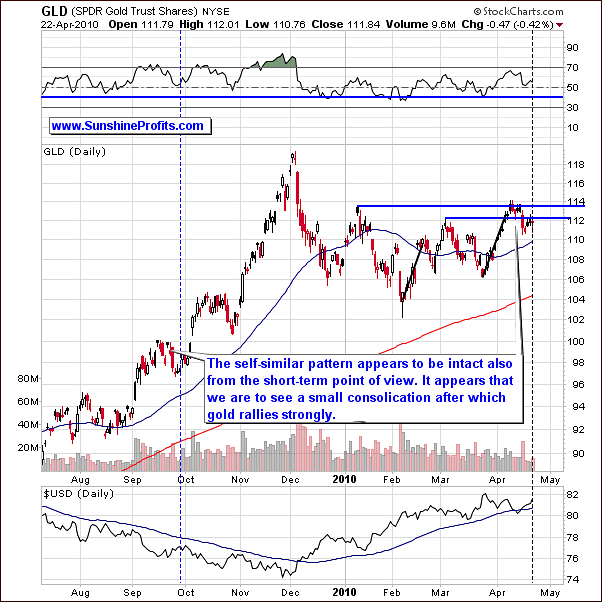
Moving to the short-term chart, we have not seen high volumes recently. However, this was also the case in late September 2009 during the early part of the consolidation. The RSI indicator may be interpreted to point towards a double bottom pattern as we saw last fall. Again, there is a chance that we may see a slight downturn before the move upward with vengeance, but we don't believe betting on this slight move lower is a good way to go.
The analysis of gold from the non-USD perspective confirms points made above.
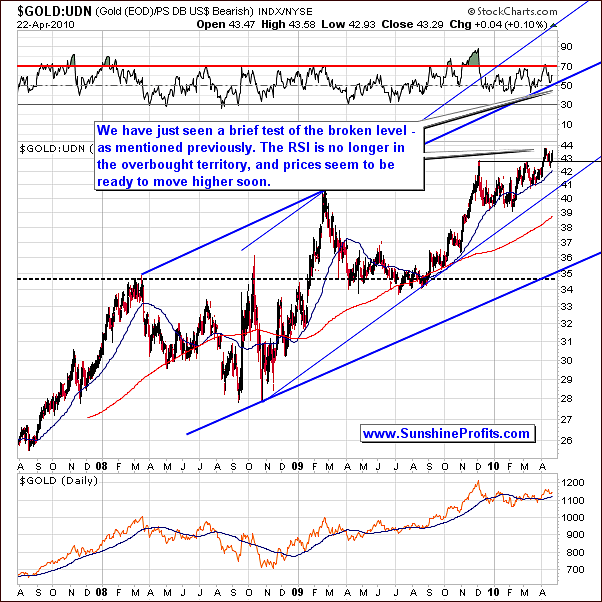
From the non-USD perspective, let's revisit the April 9th, 2010 Premium Update explaining exactly what the above chart indicates:
UDN is the symbol for PowerShares DB US Dollar Index Bearish Fund, which moves in the exact opposite direction to the USD Index. Since the USD Index is a weighted average of dollar's currency exchange rates with world's most important currencies, the gold: UDN ratio means the value of gold priced in "other currencies".
On April 9th, 2010 we wrote that we can expect a brief test of this breakout.
This is precisely what we've seen - the ratio declined to the 42-43 area and moved back up, thus confirming the breakout. While it is not certain that this ratio will move higher immediately, this chart clearly indicates bullish trends for the medium and long term. In the short term some consolidation is not out of the question, but we don't think that a plunge below the 42 level is likely.
Summing up, last week we stated that we expected gold to move sideways or decline slightly in the near-term, but we were bullish medium-term, consistent with the prior week and these comments are up-to-date also this week.
At this point in time, we still recognize the possibility that gold will move sideways or decline slightly in the near-term. However, since we are rather convinced that a rapid rise is just around the corner, we believe that speculative capital should be placed back into the market now as the downside risk is minimal compared to projected upside gains.
Silver
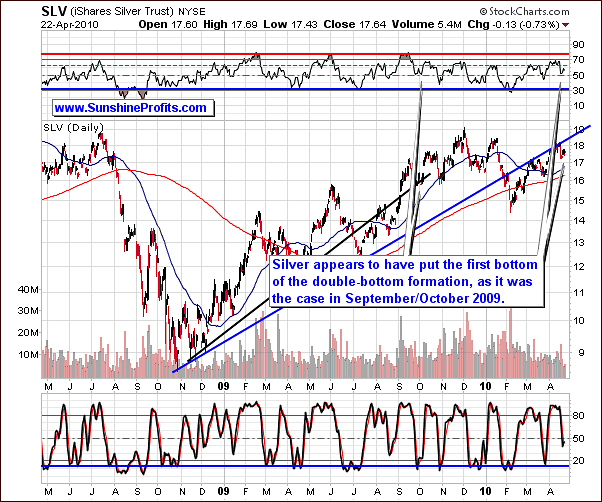
Silver's long-term chart this week shows a decline followed by a slight pullback. In a recent late Market Alert, we stated that PM's were likely to move higher after several days of moving sideways. In the last few days, we see silver moving slightly higher with low volume. This is slightly bearish. Last September, we had a double-bottom pattern and expect to see this once again. Silver had moved about 50% from its previous high towards the 50-day moving average when the bottom formed at that time and we have seen silver reaching analogous levels once again. Therefore, if we are to see a double-bottom in silver, the second bottom is not likely to be formed much below the first one. Additionally, the RSI indicator has also reached one bottom near the 50 level, and in the past we've seen a double-bottom around this level, so perhaps we are to see one more small move lower followed by a rally in silver.
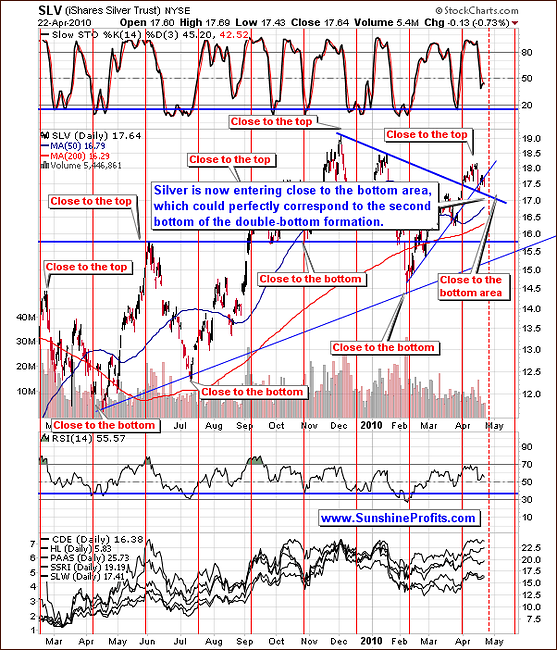
Moving to the short-term chart, we see that silver is entering the "close to a bottom" area. This suggests that the next bottom may mark the final bottom for this consolidation. This is also visible in the Stochastic Indicator, now in the middle of the trading range. Silver usually bottoms out when this indicator is close to the 20 level. Again, it might be the case that we will see a small move lower before silver begins its rally, which confirms points made in the section dedicated to gold.
The final confirmation comes from the analysis of the silver:UDN ratio.
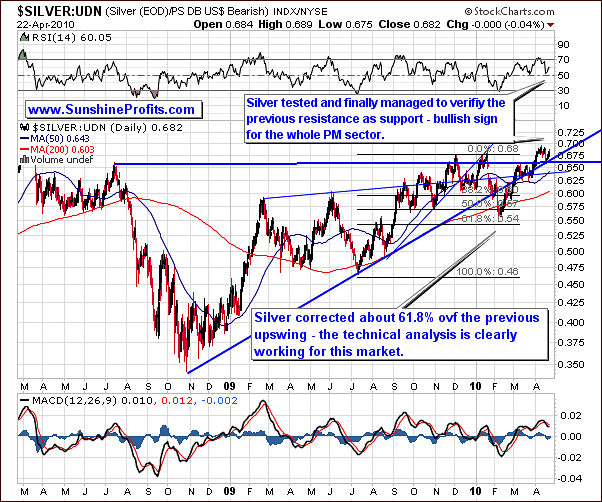
Looking at the UDN ratio, similar to what we saw in gold, when the ratio moves above its previous high, consolidation is likely. Silver has managed to move above its previous high in April. It has now moved lower with strong support created by a rising resistance level and a July 2008 high. For the first time in years it has managed to verify this level as support, which suggests further strength is to be expected in this market. This confirms points made earlier in this update.
Summing up, we repeat a portion of what we stated last week: There appears to be little downside risk right now with this metal, as it is the case with gold. If silver declines before rallying strongly it seems that it will drop only slightly according to the signs we see presently.
Precious Metals Stocks
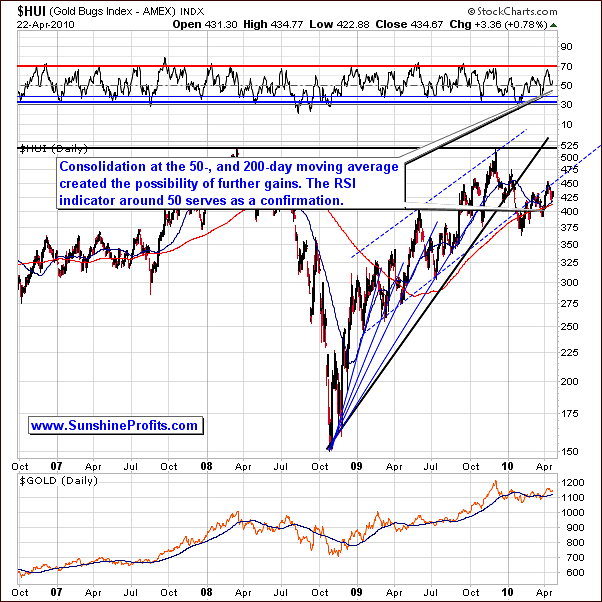
HUI - Gold Bugs Index - last week we mentioned that we expected a pause in the rally and if one materialized it would be a normal development - this is what we saw this week. The index has moved down to the 50-day and 200-day moving averages, which provided support. The RSI is now in the middle of the trading range around 50 and this provides significant room for upswings and downswings. The trend is now up and we have seen higher highs and higher lows of late. We expect some consolidation in the next several days, which will then be followed by another move higher.
In the short term, last week we stated that we expected to see a correction in the market. Although we saw some slight downward movement, we feel this was simply due to consolidation and not the beginning of a severe plunge.
Periods such as this allow the PM investors to breathe, that is, fresh buying power keeps prices high, speculative capital then leaves the market, a bottom is formed, speculative cash reenters, another rally begins, and so forth.
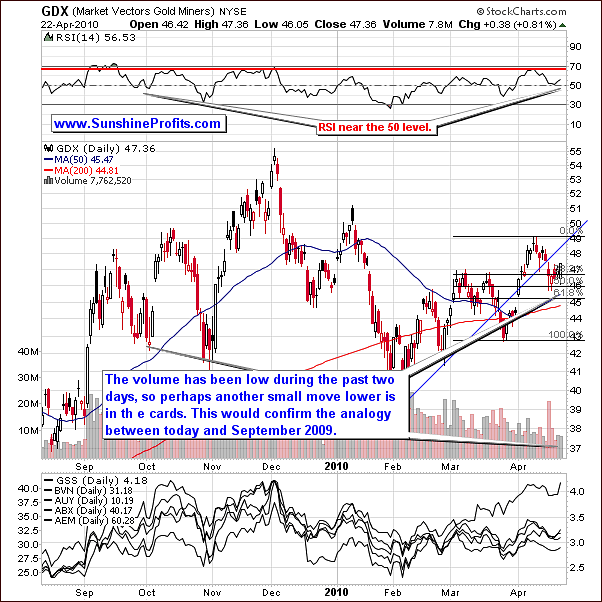
The RSI is close to 50 today, similar to September-October 2009. We saw a double bottom formed back then and expect this is where we may be headed once again. Once we've seen this, a strong rally is likely to follow.
The volume has been low recently, which also suggests that we may need to see a slight decline before the big rally materializes. We don't expect this small decline to take GDX below the $45-$46 area, and - as it was the case in gold and silver - unless you are highly-leveraged Day-Trader, we don't think that betting on this slight decline is a good idea.
The last chart dedicated to the precious metals stocks is the GDX:SPY ratio.
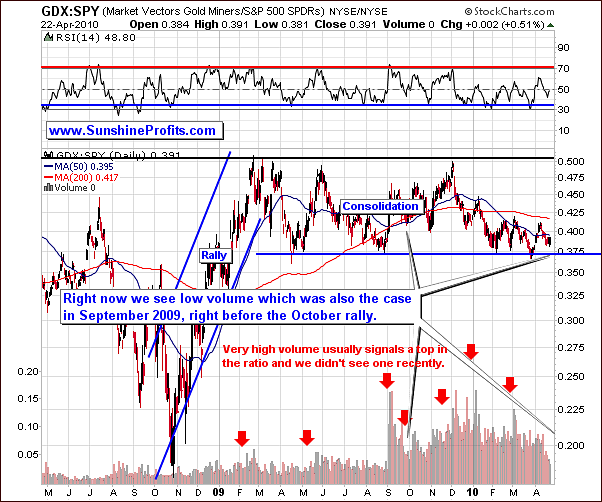
We wrote about this particular ratio in the April 2nd, 2010 Premium Update, so you might want to read it for more details. As a quick reminder - one of the ways to use this ratio is to look for high volume after a visible upswing in order to get a confirmation that the top is in. At this moment, this technique does not suggest that we are near a significant top, as the ratio has not been rising recently, and the volume was relatively low.
Please note that the volume was low also at the end of September 2009, after the initial part of the rally. Back then the ratio corrected about half of the preceding upswing before the bottom was formed, and this is also what we expect to see this time - this means that the bottom (second bottom of the double-bottom formation) is slightly below we are today, or that the final bottom has been already put, and that the second bottom will not take PMs and PM stocks below their recent low.
Summing up, a rally in the PM stocks appears to be just around the corner, although we expect several days remaining in this consolidation and still expect PM's to move upward once the consolidation is completed.
Sunshine Profits' Unique Indicator
We have just seen a buy signal from our short-term bottom indicator (from the Premium Charts section), which suggests that a rally is in the cards relatively soon.
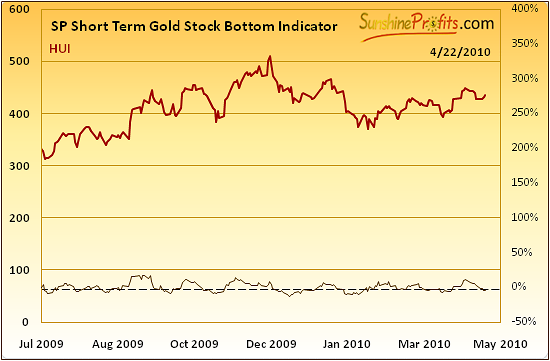
The SP Short Term Gold Stock Bottom Indicator gives us a buy signal once the indicator is below the horizontal dashed line and then starts to rise. This is what we have just seen, and consequently we are to expect a rally in the next several days, which is in tune with what we wrote about the PM market in the previous part of the update.
The particularly interesting fact is that this indicator has been very reliable in the previous months, so ignoring its signals appears to be a bad idea. For instance, the last two times that we've seen buy signals from this indicator were on March 26th and 31st - right before the sizable March - April rally.
At times, this indicator is a few days too early to predict the end of the decline and a start of the new rally, but this is also in tune with what we wrote previously - that we might see one more slight move lower before the final bottom is formed. Still, it doesn't seem to make much of a difference, because we believe that it's a good idea to be invested in the PM sector even if the slight decline is in the cards.
Other Information
While the analysis of charts is essential while projecting the future price movements, it is useful to pay attention also to signals coming from "behind the charts." This time it means the market sentiment based on what we know many investors are thinking. We know that because we talk to, and receive many letters from Precious Metals Investors and Traders.
The particularly interesting thing this week is that although prices have moved rather insignificantly lower (from the long-term point of view) from the April high, many Investors feel that the rally is over, and that PMs are to move much lower from here.
This indicates that there is a lot of capital waiting on the sidelines ready to get back in once Investors get convinced that we are to see higher prices. When is this capital going to flow into PMs? Precisely at higher prices, thus further fueling the rally. A small rally will convince part of Investors waiting on the sidelines that they should enter the market before it's too late. This will drive price higher, which in turn will cause other Investors to jump back in, and so on.
Moreover - one of our Readers (not a Subscriber) sends us "you're wrong!" e-mails when PMs are around the top and we post a bearish essay on gold - which serves as a very reliable confirmation that the top is indeed in. The interesting fact is that this week, this Reader sent us "a big decline is beginning, watch out" e-mail. We don't want to be disrespectful here, but since this Reader used to be wrong several times precisely around local tops, then perhaps this e-mail serves as an additional confirmation of the points made earlier - that a rally is coming.
Generally, fear among investors combined with bullish readings from charts is something that makes us even more confident that higher prices are to be expected in the following weeks.
Before summarizing - we've got a surprise for you. Do you recall the October 30th, 2009 Premium Update, in which we asked you which new feature would you prefer us to implement next: thorough analysis of the CoT reports, or the detailed analysis of seasonal patterns?
The outcome of the survey was that we should focus on the seasonal patterns. While we are still working on automatization of the model and we're fine tuning details, the good news is that what we have at this point can already help us making detailed calls regarding the precious metals market.
Today we would like to feature two monthly charts (daily seasonal patterns dedicated to April and May) and briefly describe how one can use them and what are they suggesting at this point.
While the idea of seasonality is nothing new - most investors are aware of the summer doldrums pattern, which means that virtually all markets tend to trade sideways in the middle of the year, we are taking it to the whole new level not only by focusing on the precious metals sector itself, but also by taking a very detailed approach allowing for the seasonal patterns to be used also in short-term trades. Additionally, we are measuring the quality of projections made using this tool. As you will soon see, there are times when these patterns are really reliable and there are times when they are to be approached with caution.
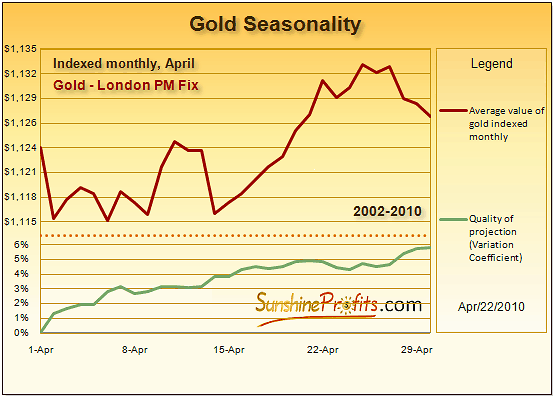
The way the above chart "works" is this - we've checked gold's performance in each April from 2002 to 2009 and extrapolated gold's average performance to where it was at the beginning the month. If the history is to repeat itself then perhaps the average performance of gold in April provides us with a "road map" to where it is likely to go during the whole month.
Of course gold does not move in the same way each year at the same day, but at times these tendencies could provide a valuable confirmation or (which is even more important) non-confirmation.
As you may see on the above chart on April 22nd gold tends to be slightly higher than at the beginning of each month, which is rather in tune with what we have right now. In the following days gold is still likely to be slightly higher than it was at the beginning of this month. Please note that the green slope moves lower after April 22nd or so. This means that the "uncertainty" has decreased meaning that the quality of projection is better.
In other words, even if gold was not slightly above the April 1st closing price, it would be more likely to move to this level in the following days.
We understand that this may seem complex, but please note that the purpose of us featuring this tool in this update was to provide you the outcome of the analysis that we've conducted using it and at the same time to provide you glimpse of one of the things that we're currently working on for you. This is not the final version of this tool (we're still fine-tuning it), and we assure you that once the full version is implemented on the website we will provide you with appropriate tutorial, instructions, and examples of using it.
So, what does the daily seasonal chart suggest for April? It confirms the points made earlier - a consolidation and perhaps the second bottom of the double-bottom formation is in the cards.
Now, what's even more interesting is what these charts suggest for May.
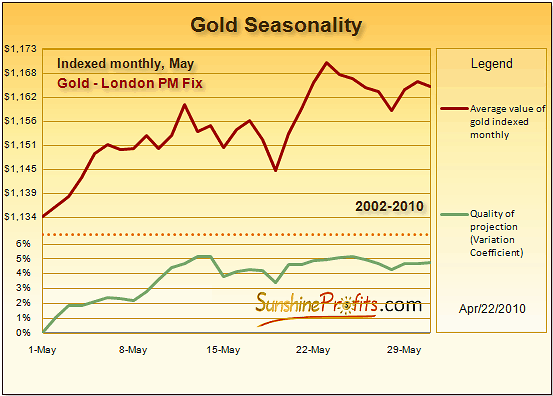
Based on the above chart (naturally, we don't have the price for May 1st, so we assumed that it will be the same as on April 22nd) it seems that the next month will indeed provide us with a sizable rally, and gold at $1,170 would be something quite normal.
Of course the "seasonal road map" is based on an average, so the next high may be much higher than $1,170. Still, the point is that May will provide us with much higher gold prices (and we expect silver and mining stocks to follow). Based on the analysis of the quality of the projection (the lower the better) it seems that the first part of May is particularly likely to provide us with higher prices. Given the current market juncture, this could mean that the second bottom of the double-bottom formation is to be formed at the end of this month, after which gold rallies strongly.
Summary
The general stock market seems to be ready to continue to climb higher even though it is massively overbought, while the USD Index may top out soon. Gold, silver, and mining stocks appear to be moving mostly on their own instead of blindly following signals coming from other markets. The readings from our correlation matrix combined with other techniques suggest that the PM sector is to rally along with the general stock market, however it may not take place right away.
Implications for our Subscribers:
Long-term investors need do nothing. We see higher prices in the weeks ahead so there is no need to change positions at this time by selling the long-term holdings.
Traders / Speculators - if you are not highly-leveraged Day-Trader, and you are out of the market at this point, we believe it would be a good idea to get back into the marker now even without waiting for the final low to be put. Many signs point to an upward movement for PM's with very little chance of significant downward movement of any kind expected.
This completes this week's Premium Update.
Thank you for using the Premium Service. Have a great weekend and profitable week!
Sincerely,
Przemyslaw Radomski

