
It turns out that precious metals are not the greatest investment opportunity in the universe after all. A painting that Picasso created in a single day in March 1932, "Nu au Plateau de Sculpteur (Nude, Green Leaves and Bust)," sold for $106.5 million, a world record, at Christie's Tuesday night, the same day that the equity markets swooned for the first time this week. (The big shock was to come two days later.) Just imagine how much the painting would have been worth if Picasso had taken two days to paint it.
But kidding aside, this has been a very interesting week for the financial markets and for gold. I had just deplaned from a short trip to Paris Tuesday when I looked at my laptop and saw the broad sell-off in the markets and commodities as investors questioned the viability of the Greek rescue package. Fears that the Greek debt crisis might spread to other European countries -- and perhaps across the Atlantic -- pummeled U.S. stocks on Tuesday, just as investor confidence was building that the worst of the economic crisis was over.
At first it looked like Wall Street's conventional wisdom of "Sell in May and Go Away," which did not pan out in 2009, might be making a comeback. Investors gave an unequivocal "thumbs down" to the Greek bailout plan. Stock markets plunged 2 percent or more in several financial centers and for nations at the epicenter of the crisis, the plunge was worse: Athens fell 6.7 percent; Lisbon was down 4.2 percent; and Spain (based on unfounded rumors of an impending rescue) declined 5.4 percent to a nine-month low. The euro fell to a 13-month low against the dollar.
Gold also took a substantial hit on Tuesday and we received plenty of worried e-mails from Subscribers. We have re-examined the charts and the proprietary Sunshine Profits tools and indicators and immediately sent out a Market Alert. We suggested that although the decline in the PM sector appeared scary, there were still many signs that it was not the end of the rally. We also suggested that investors who had been waiting for a pullback to add to precious metals and mining stock positions might now want to take the opportunity. This was putting into effect the famous Warren Buffet's motto: be fearful when others are greedy, and be greedy when others are fearful.
We wrote: We believe it would be a good idea to get back in with your speculative capital even if the market is to move slightly lower. We believe that the risk/reward ratio reward favors being long right now, and paying attention to this particular ratio is - based on our experience - the key to multiplying one's profits over time.
Subscribers who heeded the alert and faced the fear have done very well. Anyone who bought about 150 shares of GLD at the time we sent out the Alert has made enough in three trading days to pay for a year's subscription to the Premium Service - not to mention gains that were made if one used leverage. On Wednesday gold prices shrugged off the weakness to post a marginal gain as selling prompted by cash-strapped investors fizzled and the euro came off its lows. Gold for June delivery added $5.80, or 0.5%, to settle at $1,175 an ounce on Comex. The big story took place on Thursday. In what looked like a painful flashback to the darkest days of 2008, pandemonium reigned on Wall Street. In moments of uncontrolled selling, major indexes fell nearly 9 percent. While the Dow Jones industrial average tumbled more than 550 points in about five minutes, falling almost 1,000 points on the day, gold held its position and began climbing as panicked investors sought safe haven. Even after the Dow managed to recover two-thirds of its losses and closed down 347.80 points, or 3.2 percent, at 10,520.32, gold kept climbing. Most actively traded gold, for June delivery, hit $1,211.90 on the Comex division of the New York Mercantile Exchange, the yellow metal's strongest price since early December. This took place despite the continued rally in the U.S. dollar
The case for gold is looking better all the time. As you already know, the Greek story is far from over. Investors are spooked by the possibility that the E.U. and IMF could be hard pressed to come up with additional aid, possibly hundreds of billions of dollars more, to stem the financial contagion if it spreads to countries such as Portugal and Spain. The European Central Bank has been forced to water down its own rules to accept sub-investment grade Greek bonds as collateral. If the European Union took six months of procrastination and debate to put together a workable package for a small country like Greece, what will happen if they have to do the same for a large economy like Spain?
And the Greeks themselves are not exactly embracing the bailout, as evident by Greek demonstrations which turned deadly this week when three people were killed after protesters set fire to a bank in central Athens. It's hard to rescue a country that doesn't seem to want to be rescued. Greece's parliament voted Thursday to pass the three-year €30 billion package of austerity measures, as had been expected. However, there are several problems inherent in the Greek system. They have a lax taxation system coupled with a huge black market. They have massive entitlements and fat pensions for state workers. And, most serious of all, the people don't show much enthusiasm for the austerity measures needed to cure their ailing economy. Greece's wealthy have recently pushed up the prices of London luxury real estate in a rush to take their money out of Greece.
As the situation in Greece gets worse, banks are becoming cautious about lending to one another again. One key risk measure - the spread between overnight and three-month lending rates - has hit an all-time high.
Why are the banks spooked?
Many hold government debt from counties like Greece, Portugal and Spain. If down the line these countries feel the need to "restructure" their debt (a polite euphemism for 'tell the creditors to take a hike'), that would have an unpleasant effect on European financial institutions.
Greece will make their bond payment in May, and then in November, but it's difficult to know how things will play out in Europe in the near future. It looks like there will be a change of regime in London. It is possible that Germany will also undergo a change in leadership. Spain will continue to see unemployment levels creep higher.
All this could be the perfect set up for gold. In the 2008 credit crisis the problem was private debt and liquidity drying up. Now the issue is sovereign debt. What safe haven is left for money to flee to? Gold's unique selling point is that it is nobody else's liability, as was demonstrated so clearly during those moments of panic on Thursday. That will make it very attractive when the world's financial system comes under more sovereign debt pressure.
Summing up, the fundamental situation appears to be very bullish for gold. It is often said, that the U.S. Dollar provides a safe haven status, but it that really the case? Did everyone forget about the gargantuan twin deficit that increases each day? Did the massive amounts of U.S. debt in the hands of foreign investors suddenly stop being a problem? Did really so much change yesterday as far as the global economic situation is concerned that the stock indices plunged so heavily? Not really. The thing that changed was market's perception toward the above mentioned factors determining the currency exchange rates. Therefore, fundamentals are one thing - but market's participant's emotions are quite another thing, and we still need to take charts into account before making any timing calls.
So, unless you have an original Picasso hanging in your living room, let's begin this week's technical part with the analysis of the U.S. Dollar. Let's start with the long-term USD Index chart (charts courtesy by http://stockcharts.com.)
USD Index
In our previous report we wrote the following:
We expect the USD local top to be reached in the next week or two. With the RSI still below 70 and past tops occurring at 70 or higher, we expect some sideways movement or slight uptrend as the RSI moves closer to 70.
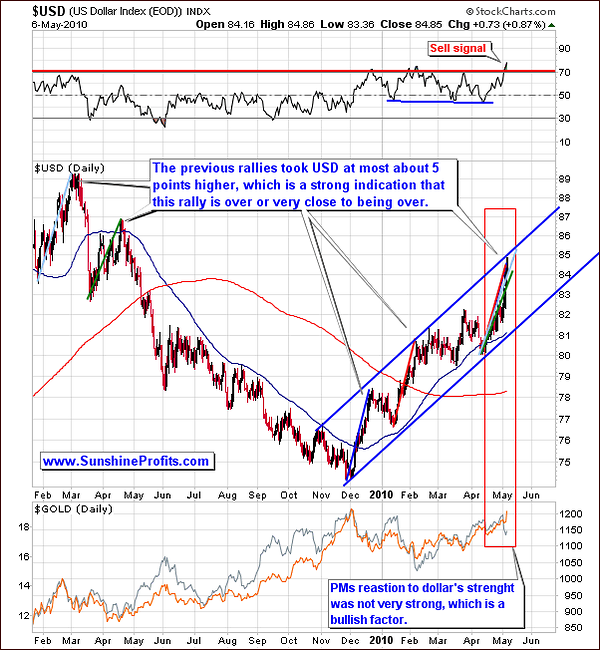
With what we have seen this week, many signs point to this rally being over or very close to a local top today. The USD moved about 5 points higher since the April 2010 bottom, which marked the beginning of the rally. Regardless, we are now bearish for the short-term. We base this on a number of signals which are visible in today's long term chart. First, we see that the USD is trading along the upper border of its trading channel, which serves as a resistance level. Secondly, the RSI has risen above the 70 level.
Please take a look at the previous rallies - we've marked them with different colors on the above chart. If the very recent rally is going to be similar to what we've seen in the past - and it is highly probable that it will - the rally is likely to be over or it's very close to being over. We have extrapolated the previous rallies to the current situation (taking the April bottom as the beginning of this rally) and it turns out that we are now in the area that is very likely to mark the end of this upswing. Nearly all indications are that the USD top will be reached in the 84 to 85 level, and we have just seen the USD Index move slightly above the 85 level and retrace below it.
So what is the impact on the precious metals market? During the past week, PM's showed no sign of severe collapse. Though silver did appear weak, gold performed very well and we remain bullish overall on precious metals. We will have more to say on this phenomenon in the following part of the update.
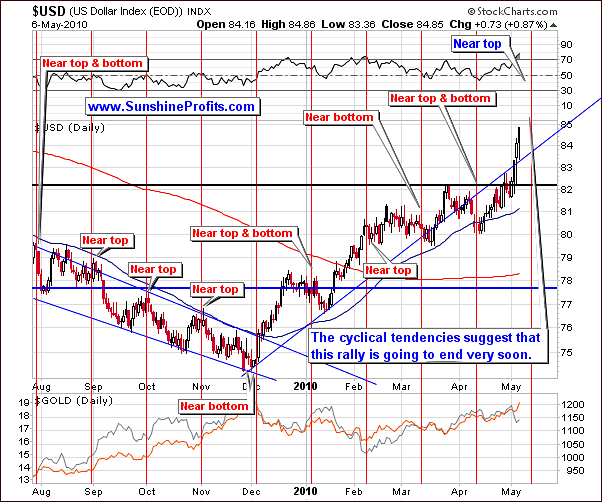
This week's short-term chart clearly shows another factor, which supports our belief that the current USD rally is in fact over or very close to its end. Last week we mentioned that the vertical red lines in the short-term chart frequently correspond to local tops and bottoms. We further stated that it was unclear which would occur in early May. Now - taking into account the recent strong upswing - it seems very likely that it's going to be a local top. Naturally, this implies a downward trend in the days or weeks ahead. All these indicators are bullish for the PM sector and cause us to remain bullish short-, medium-, and long-term for gold, silver and mining stocks.
Let's take a look at the volume for more detailed analysis.
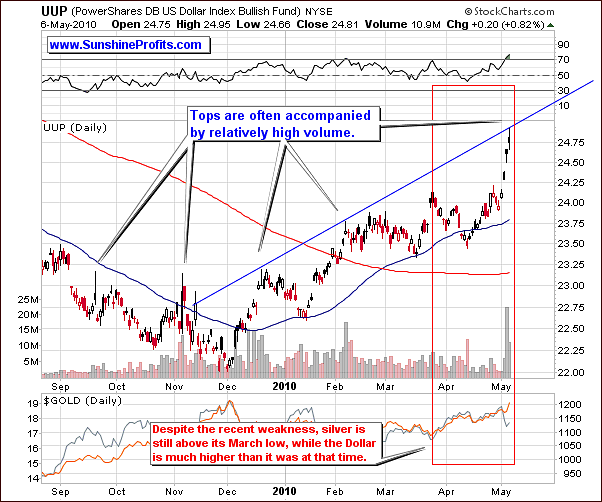
Looking at the UUP ETF, ETF being a proxy for the USD, we see the RSI at a level of 70 today. This is a sell signal for USD. We also can see that previous tops have been accompanied by high daily volume. The daily volumes this week have dwarfed what we saw last week. This huge spike in trading volume is yet another factor which supports our belief that we have reached a local top or we will see one soon. Still, this is not the most bullish aspect of the above chart.
The most bullish part of the above chart is the relative performance of gold - and yes, also - silver. Although the white metal has just moved much lower, silver managed not to slide below its late March low. With the USD showing significant strength of late, the white metal overall has actually held up fairly well. With the outlook bearish for the USD, we remain bullish on all precious metals. We expect to see a strong rally across the PM sector beginning rather sooner than later.
Summing up, indications are that the USD has reached a local top and that PM's will do very well soon. The PM rally will quickly accelerate from what could be a short consolidating period, depending on when the USD decline begins. The sooner we see USD downward movement, the sooner a strong PM rally will begin. It does not appear we will have long to wait. We remain, to quote from last week, either bullish or more bullish on gold, silver and mining stocks.
General Stock Market
Thursday saw a huge reversal in the general stock market accompanied by huge volume. There seemed to be a selling mood which accelerated for several hours though the mid-day period. It seems that we have seen the end of the last rally in a big way. But all is not negative when we look a little deeper. Even though the market's close was significantly lower than the prior day, a look at the intra-day activity shows that there was actually a substantial recovery from today's low point and it is quite likely we will see this bounce continue at least in the short term.
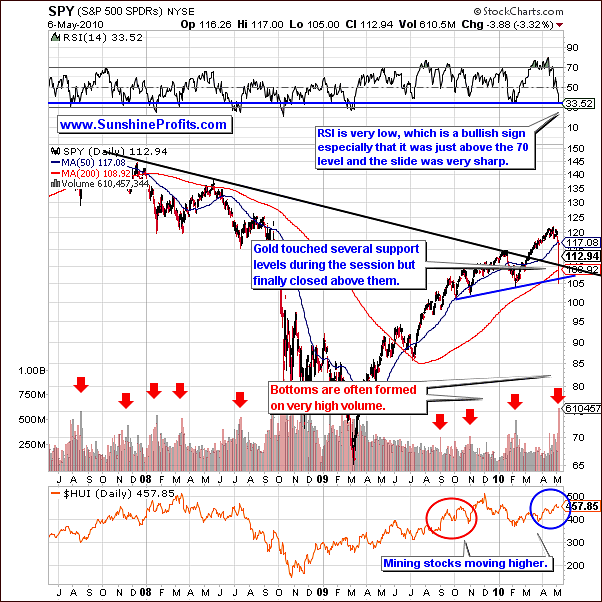
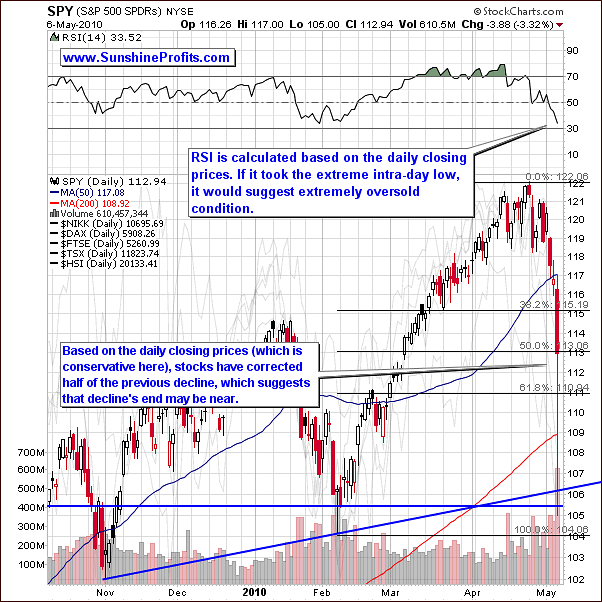
Many factors point to this coming trend. Today's SPY chart yields three positive signs that support a bullish sentiment for the short term. The closing price around 113 is above the multi-year support/resistance level - the declining black line. It is also above the 200-day moving average and above the rising support line created by previous months' lows. The true confirmation comes from the volume levels which were profound. The RSI has not been this low in months and when we saw a similar level last year, it corresponded to the final low of a previous decline. An RSI level this low most likely signifies a buy zone. The negative momentum of the RSI index is also profound, especially given the fact that it was just above the 70 level.
Moreover, in 2009, the RSI rarely fell below 50 and this week's downturn indicates a strong possibility of this decline being over as well.
Please note that the RSI indicator on the above chart is based on daily closing prices and therefore it didn't take Thursday's huge intra-day reversal into account. Should that be the case, it would provide us with even more bullish reading.
The amount of capital which left and entered the market was huge. Support levels work or have merit because of people's beliefs, stop/loss orders, buy/orders and the like. The automatic buy/sell orders have already significantly come into play. The strong reversal late in the session indicates many of these orders have been triggered already. Those wishing to exit the market, in all likelihood have already done so, or will do so very soon. That is to say, there are not many sellers left, and the buying power was strong enough to push prices up several hundred points in the DJIA. All of these factors support a bullish sentiment at this time.
Moving to the short-term SPY ETF chart, we see that the late day upswing after the severe early hours decline was nearly a 50% correction when compared to the February-April market rally, which is one of the levels that are generally likely to hold during a correction. Moreover, the support levels created by the February low (based on the closing prices) and the rising support line (blue lines on the chart) have been verified.
Therefore, the short term chart suggests that this decline, although short and sharp may actually be over. 50% of the loss has already been recovered.
The confirmation comes from the analysis of the financial sector.
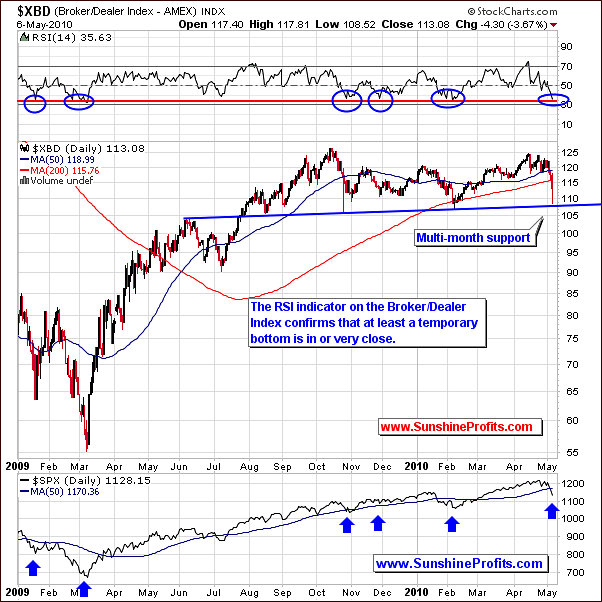
The XBD broker-dealer index serves as a proxy for financial stocks. Multiple support levels have been reached and historically the lows found here correspond to those in the general stock market.
Summing up, although the decline seen this week was both scary and huge, many signs point to a short-term bounce or what could be called the beginning of a new rally. The RSI and volume levels have both been very reliable indicators in the past and for this reason we maintain a bullish outlook in spite of what at first glance could easily have been construed to be quite negative.
Let's take a look at the correlation matrix to find out what does the above analysis mean for gold, silver and mining stocks.
Correlations
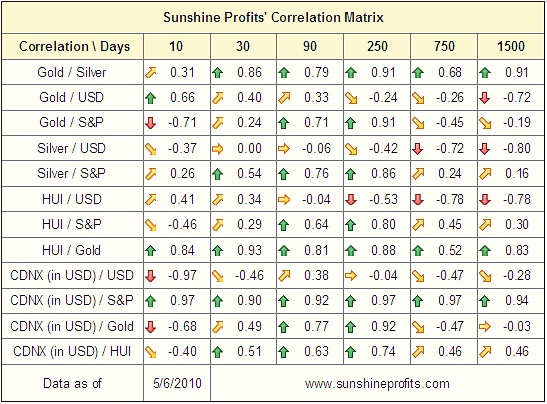
The correlation matrix this week is very interesting. The 30-trading-day column indicates that the correlation between gold, silver and HUI with the USD is quite weak, which is a quantitative representation of the fact that precious metals held or even rose slightly in spite of the USD strength this week. PMs are still rather correlated with the general stock market, but the strength of the correlation appears to have weakened significantly. This reflects the fact that gold and gold stocks have held up relatively well when the main stock indices plunged. Silver's performance on Thursday also suggests that it may not follow main stock indices much lower.
A look at the 10-trading-day column is where we see even more details. PM's and PM stocks and the general stock market show low (silver) / negative (gold/HUI) correlation. Again, this is a very bullish clue and indicates a rise in precious metals even if the general stock market declines. Gold moved much higher when the market moved sharply downward this week. Silver didn't collapse but rather moved slightly higher. Precious metal stocks also rose. The 30-trading-day column in the correlation matrix may soon reflect this to a bigger extent as well.
The 750-trading-day- and 1500-trading-day columns explain why silver and precious metals other than gold have been a bit weak during the past few days. Their long term correlation with the general stock market is higher than that of gold. For the very long term, which can be seen in the 750 day and 1500 day columns, gold has a negative correlation with the general stock market while silver and mining stocks do not. In the long run gold generally moves in the opposite direction of the general stock market, but silver and precious metal stocks generally often move in the same direction as other stocks. The soft bounce seen late this week in stocks may lead to silver and precious metals moving much higher.
Summing up, we remain bullish on gold, silver and mining stocks which have continued to show relative strength (especially gold) regardless of other factors. Much will depend on the strength shown in the general stock market in the next few days. In the very short term gold may move a bit lower if main stock indices rise, as it may be sold by those, who purchased it as a safe haven, but we don't expect this phenomenon to persist for long.
Gold
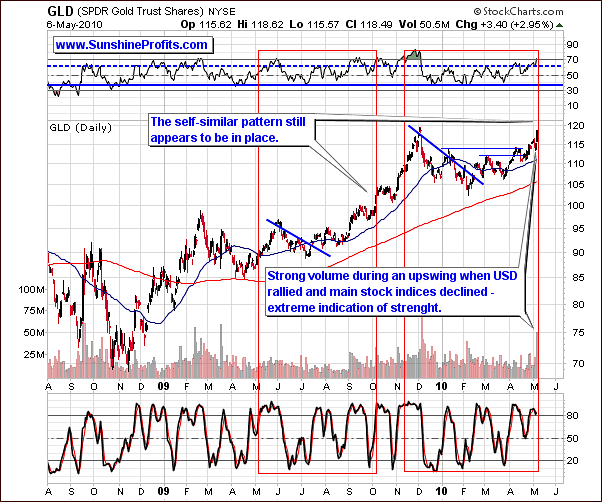
Moving on to the gold market itself this week, we are currently at a very exciting point. We do want to touch on our recent update of May 4th however. Recall that we suggested not to exit the market even if gold did move slightly lower (not below $1,155). Furthermore, we felt it was time to reenter the market if speculative capital was on the sidelines. Indications were that gold was to move higher, whether or not a slight downturn was seen or not. A look back to the end of this week shows this is exactly what happened. Gold (here - the GLD ETF - proxy for gold, useful for trading purposes) did drop slightly and then moved upwards with vengeance, and those who were waiting on the sidelines might have missed this move.
The self-similar pattern was quite confusing last week. Recall that we felt that this pattern may no longer be useful. This week however, it does seem to help and supplies additional details to support our bullish sentiment.
Today we see a situation nearly identical in many ways to early October 2009. High daily volume levels, higher closing prices, RSI in the 70 range and the stochastic indicator all coincide when comparing these two periods. Taking other signs into account along with these factors causes us to now to suspect that previous 2009 highs may very well be surpassed. Last week indicators did not reveal this - in fact that was unlikely. However, based on this week's price action, previously weak sentiment, as well as PMs holding up extremely well is a strong indication that we may surpass levels reached in December 2009. Restating this important development, a breakout above previous highs seems to be probable for gold, and is also possible for silver and mining stocks.
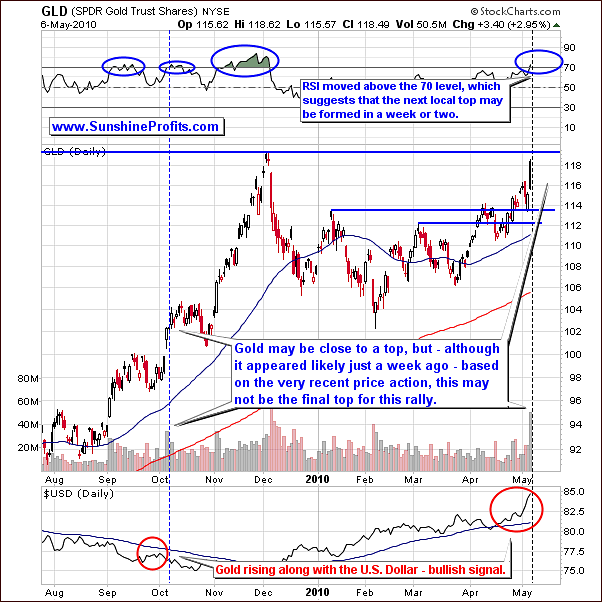
Moving to the short-term chart, recall that last week we stated the self-similar pattern did not give us any clear direction. Due to this week's significant volume levels as well as other factors, we have a much clearer picture. The increasing volume and price levels are quite similar to what we saw in October 2009. The RSI also is at the same level. It seems that gold may move slightly higher before eventually topping out. This should happen over the next 2-3 weeks and gold may actually move above its previous high. Please note that the RSI above 70 indicates gold will not top out immediately. More than likely a local top will be seen in a few weeks or so, just as it was the case in the past - please take a look at the areas marked with blue ellipses on the above chart.
Additionally, we remain bullish on gold in view of the fact that both gold and the USD have shown upward trends recently. This pattern is quite similar to what we saw last September in advance of gold's October rally. This week USD surged and gold moved up sharply. For all of the above reasons, we are more bullish this week than last with respect to gold.
Before summarizing, we would like to take this opportunity to reassure you that the points made in the April 23rd Premium Update regarding the gold/dollar/euro are still up-to-date.
Back then we argued that the decline in the value of the euro does not have to lead to the analogous move in the price of gold (priced in USD). We wrote the following:
(...) it's not hard to imagine European investors to purchase gold in response to the Greece-related turmoil. Yes, there will be investors willing to purchase dollars as a safe-haven (which we find rather ironic at this moment), but some may be willing to purchase PMs. As in many other cases - charts provide timing details, and right now, the situation appears bullish - also from the non-USD perspective.
This is what we've just seen, and what we are still likely to see in the coming days - strength in gold even if euro declines.
Summing up, our view today is that gold may surpass its previous highs as it continues to show strength and taking all factors into consideration, we see many indications that a further rise is likely for gold, although we may see a consolidation slightly above or below the December 2009 high. We will supply more details as we move through the 2-3 week period ahead.
Silver
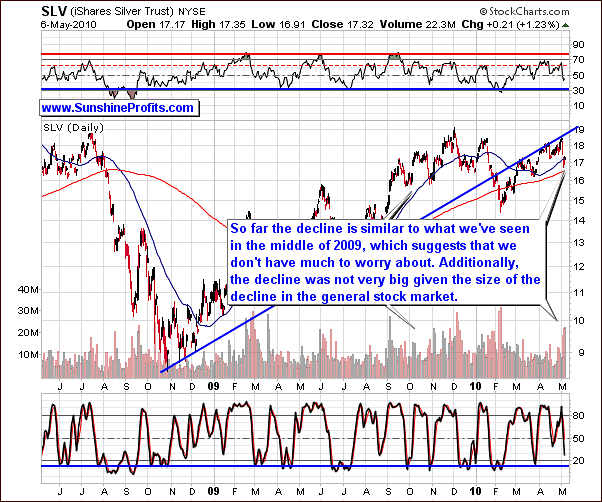
Silver appears to have bottomed out this week. This is in line with what we have stated earlier with regards to gold and the general stock market. The reason behind silver's weakness this week is it's correlation with the general stock market due to multiple industrial uses. Being a precious metal, silver sometimes follows the trends set by gold. However, silver has more industrial uses than gold and therefore may, at times, more closely follow the trends set by the general stock market.
Supply and demand situation for silver is still favorable. Emerging economies such as China and India are likely to continue to positively impact the direction of silver's price. Still, this week silver moved sharply lower. In our May 4th alert, we stated the downside appeared to be $17.30 ($17 for the SLV ETF). This level was breached intra-day but the closing price was higher. Silver is now at its 50-day moving average level which should provide support as was the case many times in the past. Higher volume has accompanied bottoms in the past and we have seen such levels this week.
Silver did not plunge at all on Thursday, actually rising about 1%. This is in spite of a day where the general stock market was severely down in the range of 5%. Indicators which normally are useful have little benefit this week due to the huge impact felt from the general stock market. The RSI level and stochastic indicator point towards a period of sideways price movement or a slight downturn, but these signals don't seem to be reliable at this point.
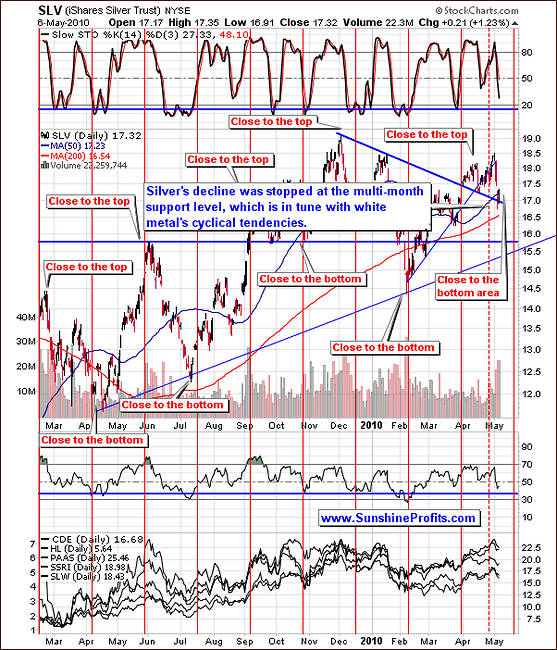
Moving to the short-term chart, cyclical tendencies appear to be in place. These are valid to use in projecting future price levels. The indications are that we are close to if not at a bottom today. Although silver has moved lower this week, it stopped at the multi-month support level, which is in tune with normal cyclical tendencies. Silver's price may move higher, especially if the general stock market rallies even slightly. In short, this is what we expect sooner rather than later given all of the above factors.
Summing up, silver has continued to show weakness but has probably reached its bottom, and higher prices are coming. The general stock market did not cause a severe downturn this week and for both these reasons we expect silver to move upwards fairly soon.
Precious Metals Stocks
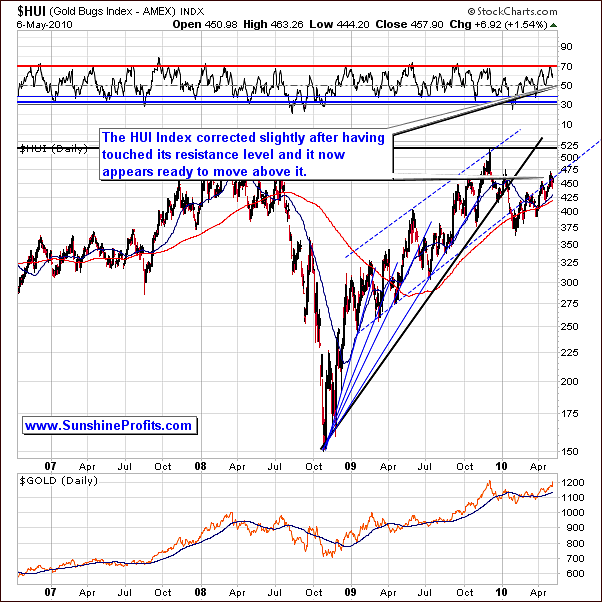
The long-term HUI Index chart last week showed us that a local top had likely formed. This top had indeed materialized but it was soon followed by a bottom. This quick correction caused the RSI to move below 70. It no longer appears to be an overbought situation in the HUI Index, and mining stocks may therefore move higher.
Please note that the HUI Index is just one of the proxies that can be used to analyze the precious metals stocks - there are many other indices, which could provide us with slightly different readings especially if they are based on stocks listed on a non-US exchange (for instance in the UK), but in the end divergences are not likely to be long-lived. The point is that if you are following a different index, the short-term divergences between it and the HUI Index should not make you concerned. In the vast majority of cases the analysis of the HUI Index will provide useful conclusions also for investors following other PM stock proxies (for instance XAU, GDX ETF.)
Short-term chart provides us with more details.
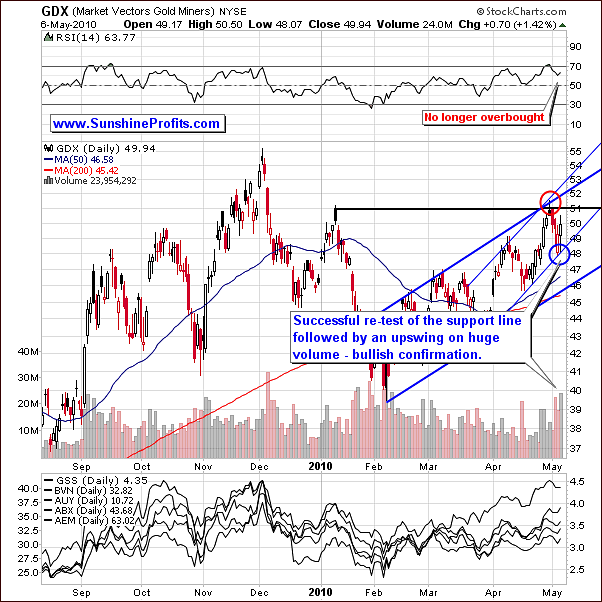
As for precious metals stocks remember that last week, we had an RSI close to 70, which indicated a probable local top. We went on to suggest that day traders could watch for a short-term correction in the near future and possibly take advantage of this situation.
In this week's alert, we stated that had not yet seen a clear bottom but did not expect PM stocks to go much lower (not below $47.5.) This week PM stocks actually moved higher after a quick, short decline. This is a very bullish signal, especially considering the bearish week seen in the general stock market. Precious metals are highly correlated with the general stock market as noted earlier in this update. Given that PMs did not follow the trend of the general stock market this week further confirms our bullish take on the PM sector today.
Summing up, we expect further strength in the mining stocks and this may well be further amplified by a rally in the general stock market.
Precious Metals Stocks vs. Other Stocks
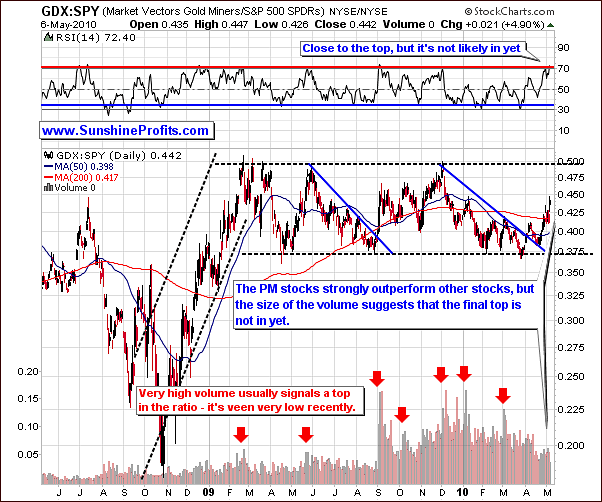
As a quick reminder - the GDX:SPY ratio shows the performance of PM stocks relative to other stocks. Recently, the PM stocks have strongly outperformed other sectors. RSI level is near 70 today and its rise to this level has been quite sharp. In the past, tops have been reached with high volume levels present. We have recently seen relatively low volume on a daily basis. This indicates a strong likelihood that we have not yet reached a top, even though the rally in the ratio was sizable. There is a possibility that the top (followed by a consolidation, not a plunge) will be attained in the next few days if gold moves higher. This is especially true if gold should surpass its 2009 high.
Following this anticipated top, we may simply see a period of consolidation as opposed to a downturn. This would replicate what we saw in 2009. A short consolidation period followed by a move upwards would, of course, require a confirmation as well. Since we have seen low volume levels of late, it appears there is room for further gains.
Platinum

The platinum chart provides us with similar information. In fact, it provides interesting details for the whole PM sector. Normally, the RSI above 70 indicates a top is near which is, of course, an early sell signal. However, this was not the case recently. Conversely, the RSI is actually at a buy level for platinum. Usually this corresponds to similar buy periods for gold, silver and precious metals. Platinum trends seen in the above chart suggest that prices will rise - not fall. Furthermore, the 50 day moving average, which is where platinum currently rests, normally marks a bottom for this metal.
SP Gold Bottom Indicator
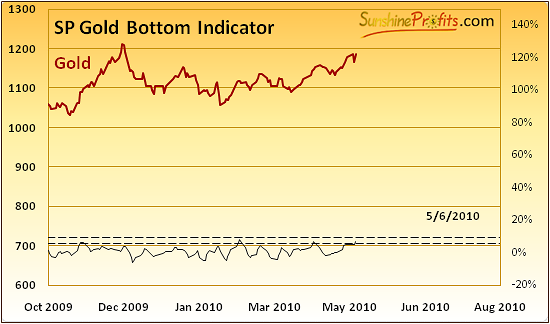
Another confirmation that another rally is likely after an upswing and a consolidation comes from the analysis of one of our unique indicators - the SP Gold Bottom Indicator. The indicator flashes a buy signal when indicator breaks below lower dashed line, or when it breaks up through the upper dashed line. Since it is already above the lower dashed line, it will soon move below it, thus creating a buy signal.
We did not see this happening yet, but it is likely to take place once gold moves slightly lower. Therefore, the next downturn is likely to provide us with another buying opportunity (perhaps around the December 2009 low.)
In the April 16th, 2010 Premium Update we wrote the following:
According to its name, we've designed this particular indicator to signal favorable buying opportunities in gold and this is exactly what it did this week. Please note that buying opportunity does not necessarily correspond to the exact bottom - it is rather a time/price combination, which will provide you with decent returns in several weeks, not necessarily right away.
Therefore, what this indicator signaled this week was that we are to see gold moving higher in the medium term - which confirmed what we had written in the previous update - namely, that we are still bullish on gold in the medium term.
As far as short-term implications are concerned, please take a closer look at the above chart. There were several times when we've seen the buy signal during the past several months, and each time some kind of consolidation followed. (...)
Please note that we have in fact seen a rally after a consolidation in the past, and this is also what we expect to see in the near future.
Daily Seasonals
In the April 23rd Premium Update, we have provided you with the "pre-alpha" version of our new tool dedicated to the precious metals market - the daily seasonal charts. We have provided you with two daily seasonal charts - April and May ones. Back then we wrote that this tool suggested that a consolidation and perhaps the second bottom of the double-bottom formation is in the cards.
This is exactly what we've seen, so you might be wondering what does this new technique suggest for the coming days/weeks. Of course, on April 23rd, 2010 we didn't know the price of gold from the beginning of May, but we do now, so we would like to provide you with a follow-up.
Please note that we have changed the way the "quality of projection" line works to make it easier to interpret - the higher the line is, the higher the quality of particular price projection. This is not the final version of this tool, we are still working on it, but it is "ready enough" to include it in our analysis.
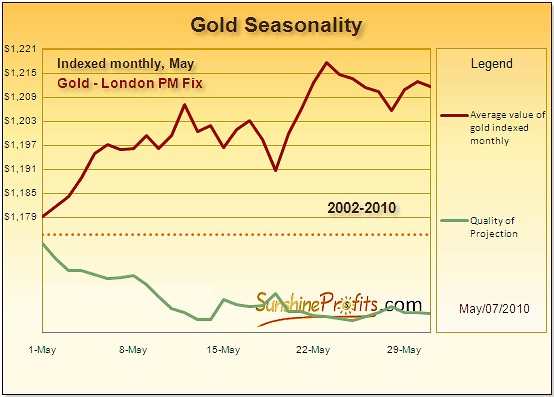
The daily seasonal patterns perfectly confirm what we wrote so far in this week's update. Please note that we have already seen the first part of the May upswing. What is likely to follow is continued strength until the middle of the month when gold is likely to dip before moving higher once again. This is in perfect tune with what we wrote earlier - gold is likely to move higher - to the December 2009 high and then consolidate before moving higher once again.
Summing up, the daily seasonals confirm points raised earlier, which makes them even more reliable. The situation remains bullish for the whole PM sector.
Juniors
As stated in the Key Principles section, the list of top juniors will be updated approximately every 4 weeks, so this is the Update that should contain the revised version of the list. However, before providing you with details, we would like to comment on this sector's performance in general.
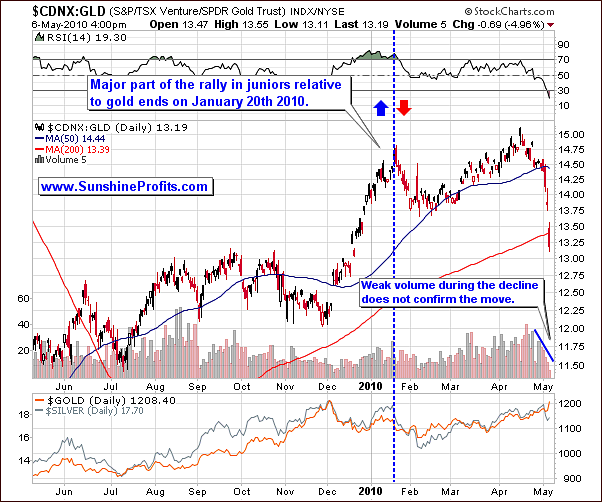
The TSX Venture Index to GLD ETF ratio provides us with the average junior's performance relative to the underlying metal. If this ratio is likely to move lower it is best to switch one's junior's holdings to gold and vice-versa.
We have commented on the above chart in the February 5th, 2010 Premium Update, and since much of the information presented at that time is important also today, please take a moment to read the following quotation. About 3 months ago we wrote the following:
Since we may still be in the early part of the decline on the general stock market, and the number of our Subscribers is increasing very quickly, we would like to take this opportunity to remind you of our current views on the sector. By the way, if you didn't read the November issues we highly recommend that you do, as they include our very-long-term price projections for this bull market.
There is one more thing that I'd like to comment on this week, and that is the situation in the junior sector. While this is nothing new to you, if you've been following our commentaries for over a year, it seems that it may prove useful to remind this part of our analysis to new Readers. In the essay posted on September 19th, 2008, we wrote the following:
(...) junior/senior ratio is reasonably correlated with the general stock market. This is another thing that justifies the severity of this decline. As the stock market fell, the junior/senior ratio plunged as well. (...) periods where juniors rallied relative to the HUI Index - were accompanied by a rise in the general stock market. The question is what will happen next on the main stock indices.
The juniors have been rallying recently, but so did the general stock market, which is another confirmation of the points raised over a year ago. Since the general stock market is likely to move lower sooner or later, it may mean that the juniors' outperformance will also disappear for some time.
Please note that the correlation matrix also includes details of influence USD and main stock indices have on juniors (CDNX - the Toronto Stock Exchange Venture index is used as a proxy), and numbers imply that the general stock market has a very strong influence on the junior sector.
Consequently, if you are heavily invested in juniors, you may want to consider switching at least a part of your holdings into big, senior PM stocks, bullion, even cash (depending on your investment preferences). If you are risk averse, switching from juniors into physical gold/silver, seems to be a good idea. For more information about structuring your portfolio, please go through the Key Principles section.
Combining the above information with points made earlier in this update - namely, that the general stock market's decline may be over soon - indicates that it may be a good time to get back into juniors. How much should you buy depends on many factors - we have commented on that in the Key Principles section, and we highly recommend that you read it. Which stocks would we buy at this moment? We would diversify in many companies from our top junior rankings. Please examine the tables below for details. Again, for more information on how you can use these lists please refer to the Key Principles section, especially to the part dedicated to juniors.
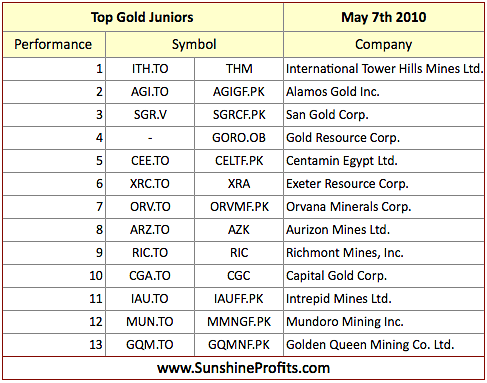
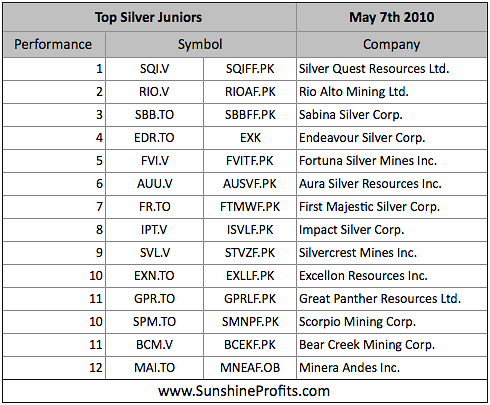
Once again, there are virtually no changes since the last month, meaning that the stocks that were strong (on a comparative basis) last month are still holding relatively well.
Summary
Although recent price movements have been discouraging, especially for Silver Investors, the trends and signals we see this week indicate that this is likely to be an opportunity to add to one's long positions, not necessarily a beginning of a more severe plunge. Although the possibility of a sharp sell-off always is present, we do not feel this is probable based on our analysis of today's charts.
The USD Index appears to be topping, while the general stock market appears to be ready to move higher soon. These are positive factors for the PM sector, but the most important factor here is that gold, and silver were moving higher (or not moving very strongly lower on a relative basis) despite previously bearish influence coming from USD and the main stock indices. This, combined with analysis of individual PM charts, additional confirmations from other charts, our own indicators, and previously weak sentiment for PMs suggests that this rally may continue for a while.
The situation is most clear on the gold market, and it seems it might be a good idea to base timing in other markets on this particular market. This means for instance selling/buying PM stocks when it is a good time to sell/buy gold.
We currently expect gold to move to the December 2009 high within a week or so, after which it would consolidate for some time (week - three weeks) and then rally once again. The target for this particular rally is unknown at this time, but we can't rule out that this rally could take gold to $1,500.
Summing up, we remain bullish on precious metals overall.
This completes this week's Premium Update.
Thank you for using the Premium Service. Have a great weekend and profitable week!
Sincerely,
Przemyslaw Radomski

