
"It's Greek to me," is one of the most clichéd phrases in the English language and, like a host of many others, it comes from Shakespeare. It means "I couldn't understand a thing that was said." It is rather strange that the Greek language would come to symbolize something that is incomprehensible, given that Western civilization is replete with Greek words-democracy; philosophy and history to name just a few.
Nowadays the words, which most occupy the Greeks, are annoying words like: default, debt binge, structural reform, bond sell off and rescue package.
All those pesky little words rattled the financial markets this week as Greece's credit rating was lowered to junk status in the same week that Greece's Prime Minister called his country's economy "a sinking ship." Investors around the globe were spooked by perceptions that European leaders have not yet shown enough resolve to contain the fallout from Greece's problems. This was in addition to the political resistance in Germany to use taxpayer money for a rescue. European leaders scrambled to quell the market instability with German officials moving to free up billions of dollars for an international aid package.
And gold?
If went up, of course.
Gold struck historic highs this week in euro, sterling and Swiss franc terms, while dollar-priced metal hit 2010 peaks even as the euro tumbled. In fact it is also rallying at the moment of writing these words.
Subscribers to the Premium Service were well prepared for the rise in gold prices. We gave a "heads up" as early as April 9th when we said a brief pause or corrections was likely to occur short-term, but that the rally will resume relatively soon. Even when the gold market hit an air pocket last week and dove $25 in a few minutes with news of the Securities and Exchange Commission's civil fraud charges against Goldman Sachs, we urged in a Market Alert posted April 23rd, to hold on and stay the course. Convinced that a rapid rise is just around the corner, we wrote that "we believe that speculative capital should be placed back into the market now as the downside risk is minimal compared to projected upside gains."
We made those calls based on technical analysis without knowing in advance that Standard & Poor would cut Greece's debt to junk level this week. The agency also downgraded Portugal's debt by two notches.
Was it just a lucky call on our part? Without a doubt, news of economic instability vaults gold prices. But gold was heading up based on technical analysis with or without the downgrading of Greek bonds.
What does the future hold for gold? Bullish without a doubt.
What does the future hold for this Greek crisis? It doesn't look good. When the euro was first introduced Nobel Prize winner Milton Friedman wrote to a friend, "As you know, I am very negative about the euro and I am very doubtful about how it will work out. However, I am less pessimistic about it now than I was earlier simply because I never expected that the various countries would display the kind of discipline that was required in order to qualify for the euro."
We now see the Friedman's cautious optimism was premature and his initial instinct correct. Including Greece in the Euro zone ten years ago gave Greece a massive credit subsidy and access to cheap money. What did the Greeks do with all this cheap money? Instead of investing it to boost their competitiveness, they squandered some of it on the 2004 Summer Olympics and spent much of the rest on imported products, especially from their long-time trading partners in Germany.
Greek politicians might come to the conclusion that the only way to avoid civil unrest in Greece and to claw their way out of the quagmire may be to drop the euro and re-establish their own national currency, the Greek drachma. This would allow the Greek government to devalue the currency in order to stimulate exports and economic growth. Today this is a political-monetary tool, which Athens does not have in its arsenal.
From an economic point of view, letting Greece quit the Eurozone might be the easiest solution to the debt crisis, but we doubt that it will take place. It would give a stern warning about the need for fiscal discipline and would also avoid the severe consequences of the bailout. Can the strong Eurozone nations bailout the entire group of weaker nations? We're not just talking about Spain, Portugal, Italy and Ireland. Let's not forget countries like Hungary, Ukraine, or Romania, where the fiscal situation is not much better.
Even though Greece is viewed by some Europeans as a bottomless pit, the political implications of kicking Greece out make this option unlikely. You cannot build trust and a sense of unity among the members of the Eurozone by kicking one of them out at the first sign of trouble.
On the other hand, it is easy to understand the frustration of the hard- working German taxpayer. Greece has lived beyond its means, running up huge deficits to pay for lavish public sector wages and benefits and then fudging official statistics to cover up its profligacy. Anger is increasing in Germany, with many asking why they should pay for things like the generous Greek pension plan. The German newspaper Bild sent a reporter to Athens last week to see how the broke Greeks deep in crisis are coping.
The headline ran "Crisis? What crisis? Business as usual in Greece." After visiting a casino near Athens, being refused receipts by taxi drivers, gas station attendants and even for a newspaper he purchased, the reporter came to a conclusion that "In plain language: All income is black. No control, no taxes."
What really drives the Germans crazy are the Greek pension benefits. A Greek worker can get as much as an 80 per cent pension, whereas in Germany is comes only to 46 per cent. The Greeks receive 14 pension payments a year - monthly, plus an extra one at Easter and at Christmas. Germans only get 12 payments.
There are a few points to be made about all of this.
Although it is easy to understand the Germans' indignation, let's keep in mind that German firms enabled and profited from the Greeks' overspending. If Greece gets a bailout much of the money will most probably wind up right back in Germany. In 2008 Greeks bought 8.3 billion euros worth of German goods, mostly new cars, and other machinery, while Germany bought only 1.9 billion euros worth of low-value products from Greece, such as textiles, olive oil and tomatoes.
Another point to be made is that Greece is suffering from a particularly severe case of a general economic malaise afflicting the majority of the world's economies. Let's keep in mind that both the U.K. and the U.S. have deficits above 10 percent of GDP, and many nations all over the world are way above the 5 percent limit. Seen in this context, Greece is only a severe symptom of the larger disease. We are sure to see many more crises of this type throughout the next few years. And while the future of fiat currencies is shaky, the future of gold couldn't be shinier.
Speaking of fiat currencies, let's begin this week's technical part with the analysis of the U.S. Dollar. Let's start with the long-term USD Index chart (charts courtesy by http://stockcharts.com.)
USD Index
In our previous report we wrote the following:
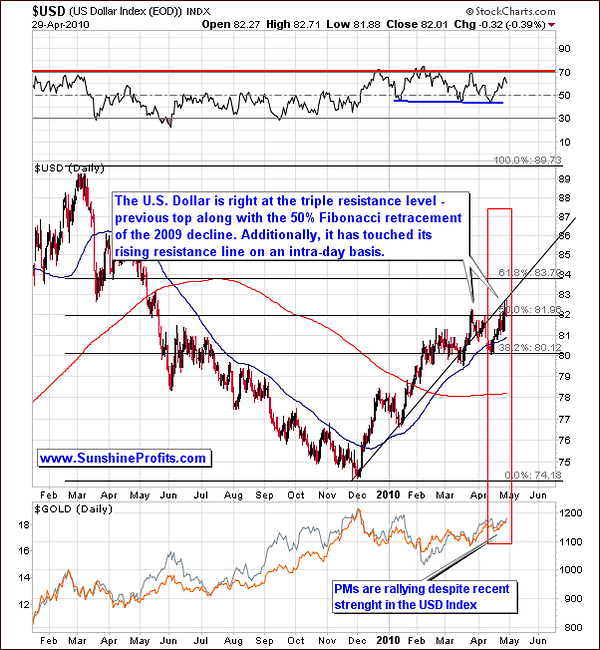
The USD is approaching a resistance level at the 50% Fibonacci Retracement of the 2009 decline as well as a previous stop. This may hold this rally in check. However, the PM markets remain strong....whether this happens in one week or two is unclear at this time but we believe that the decline in the USD is in the cards sooner or later.
We did not see many changes this week in the USD or in our long-term outlook. Looking at the long term chart we have seen further strength as the USD moves slightly higher, rising about ½ of 1 percent. Precious metals continue to rally with gold and gold stocks showing strength throughout the week. Although staying low during most of the week, silver followed this trend on Thursday. This is in line with what we observed and expected last week. The strength of PM's has held and we remain bullish for this sector in the coming weeks. Based on what we've seen lately, gold, silver and mining stocks are likely to show continued strength regardless of USD trends.
So what will happen next? We expect the USD local top to be reached in the next week or two. With the RSI still below 70 and past tops occurring at 70 or higher, we expect some sideways movement or slight uptrend as the RSI moves closer to 70. This is further confirmed by what could be called a triple resistance level currently in play. The USD is close to its late March high and the 50% Fibonacci level as well as having moved to the rising resistance line on an intra-day basis. While it is still possible that the USD rally continues and perhaps index reaches the 83 or 84 level, thus resulting in some sideways movement for gold and silver, we do not see anything close to a plunge in this sector. The precious metal markets have shown great strength recently and we do not expect any significant negative impact from the USD continuing to show upward movement. Should the USD rally stall or reverse, the PM sector will see acceleration in its upward movement.
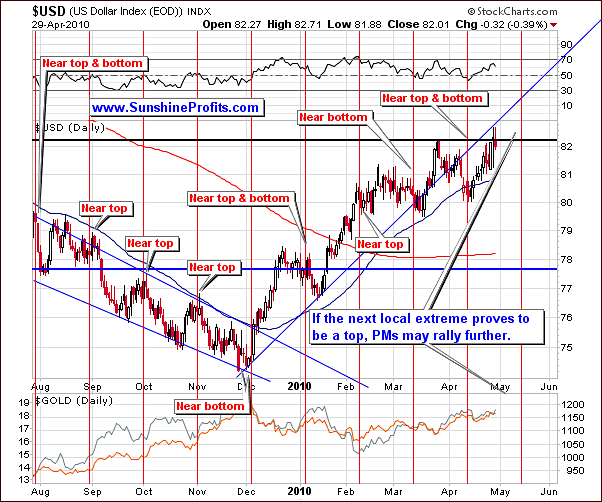
This week's short-term chart shows much more cyclical tendency details than we observed last week. We find that we are in the middle of two extreme points. The vertical red lines of the above chart typically align with tops and bottoms on a "near" basis. Should the rally continue this week, we should expect a local top around the 2nd week of May. It is unclear however as to the type of extreme we will see. If the rally were to stop now, we could very well see a local bottom in the 2nd week of May. Much depends on what happens in the next few days.
Summing up, given the recent strength of gold relative to the USD Index, the PM's are expected to do well or even better. If the USD top occurs in two weeks, the PM rally will accelerate from what could be a consolidating period over the next ten trading days or so. This PM rally is likely to take off even sooner if the USD does not continue its upward movement in the next few days. So we could say at this time that we are either bullish or more bullish on gold, silver and mining stocks.
General Stock Market
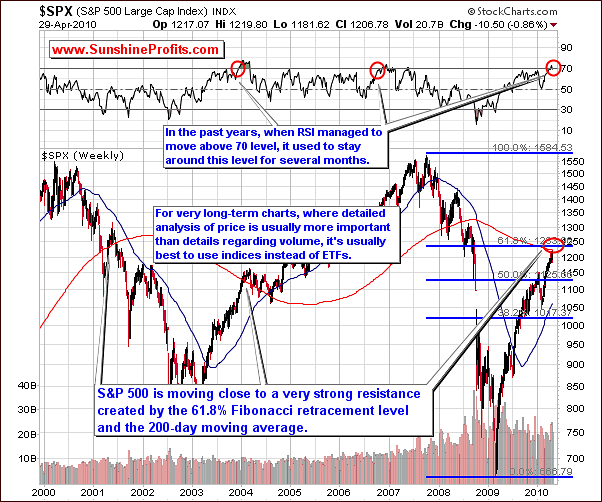
We still expect to see a general stock market correction in the not too distant future. This week there was very little change in the S & P Large Cap index chart. It is nearly identical to last week. The recent decline meant nothing with respect to the long-term picture although it was clearly visible on a day-to-day basis. A further rally is likely.
As we stated in a previous update, in past years, when RSI levels were in the 70 range, they normally remained there for months. This generally signified an overbought situation and a sideways period or downturn in the market. We have also seen levels very close to the 200-week moving average. Since we are not presently above it, we would expect the rally to continue until such time as we see the RSI fluctuate above and to this line. This is what we expect from studying past trends. As we use past trends and patterns to forecast the weeks ahead, it is always best to keep in mind that these tools can only steer us in the most likely direction. Each period in time has unique factors which may cause the trends to be quite different from what would seem to logical based on a prior time period.
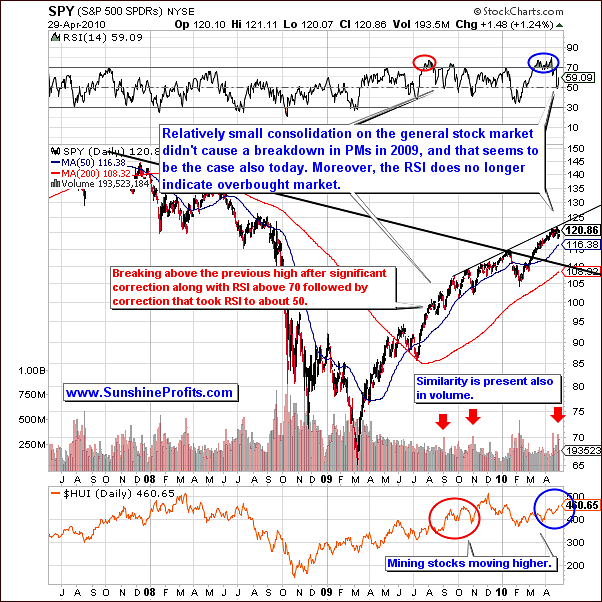
Moving to the long-term SPY ETF chart, we do see some changes as compared to last week. The market has been consolidating for several days and this has caused the RSI to move much lower, actually touching the 50 level. This indicates we are no longer in an overbought situation. We are therefore presently bullish as the trend surely appears to be upward. A further rally is likely given that the overbought situation is behind us.
Looking back to 2009, we see similarities. An overbought period was followed by an RSI plunge to 50 (marked on the chart with red ellipse) which quickly resulted in a stock market rally. Several weeks ago, we mentioned that this was likely to take place and we see it now (marked on the chart with blue ellipse). This has been confirmed by volume levels recently, thus validating that our analogy with 2009 is still intact. During the final part of the decline, we also saw a decline in the high volume levels. We saw this twice in 2009, during periods of consolidation and slight decline. Perhaps, our current consolidation interval is coming to an end.
The likely implications for precious metals can be surmised from a look at previous periods with similar trends. We saw PM's rally in very similar situations and we expect to see this once again. We remain medium term bullish on gold, silver, and mining stocks.
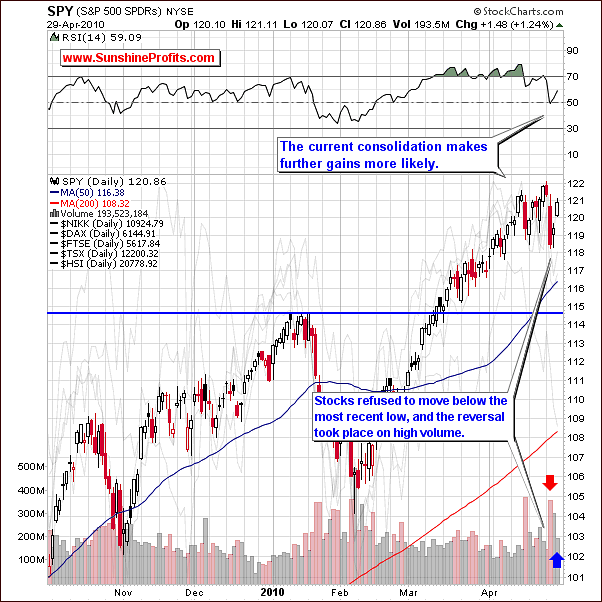
Moving to the short-term chart, this week we've seen further consolidation. The general stock market managed to move up for the week with higher volume levels. When there was a decline, notice that it was quick and sharp. However, once it had dropped to the level of a previous recent low, it quickly moved upward on higher volume. This is a bullish sign and shows true market strength. The implication is that there are is a lot of capital waiting for lower prices to enter the market right now, and fresh buying power is what might fuel further rallies. The volume levels confirm this point and the rally may very possibly continue from here. This is likely to result in higher precious metals and precious metals stock prices.
Summing up, though the general stock market has been rallying strongly since February, we again state that the correction which we still feel is inevitable, may still be some time away. The market appears to have gained some strength of late which should hold off a short-term correction for the near future.
Correlations
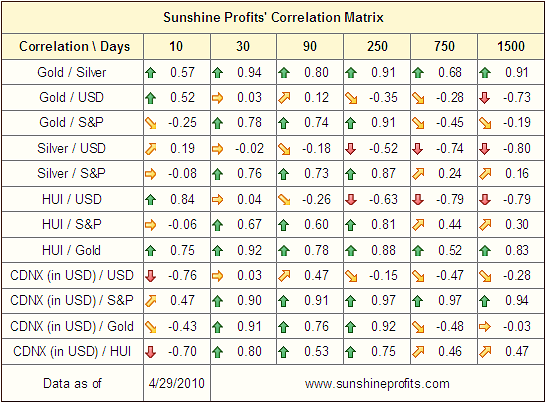
There is virtually no change to the correlation matrix for this week. Once again, the USD and precious metals are uncorrelated and the high correlation readings are seen between PM's and the general stock market. Gold, silver and gold stocks continue to be highly correlated with the general stock market and therefore our previous bullish points apply here as well. The lack of correlation with the US dollar resulted from a situation where gold continued to rise in spite of the recent strength shown by the USD. We expect this trend to continue in week ahead and once again reaffirm our bullish outlook for the PM sector.
Summing up, we continue to feel that PM's will move higher along with the general stock market. The correlation values above once again confirm a continuation of PM's and general stock market trends being quite similar. This will be further confirmed as we move through this update into the precious metals charts themselves.
Gold
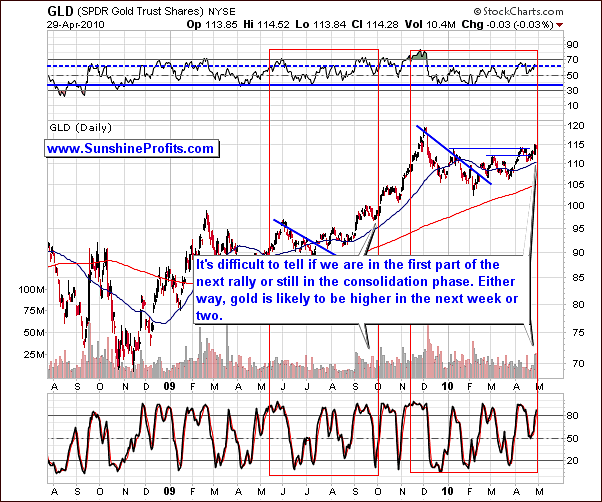
Gold prices moved higher this week. Today the question is have we reached a local top or would we call this a pause in the rally? We feel more strongly that the latter is true. The gold rally most likely will continue over the next week or two with short periods of sideways movement possible. The situation is to some extent unclear mainly due to the lack of clarity in the self-similar pattern. In October 2009, we saw a similar period to what we've seen recently followed by a rally. We also have seen consolidation patterns come to an end. In either case, a downward movement occurred first followed by a rally. We do not feel at this time that one should bet on a downward movement in the short term. All signs point to higher gold prices in a week or three regardless of what happens in the next few days.
One more observation of importance needs to be stated here. Based on previous trends and taking into account numerous factors, the ultimate top for this rally will probably be most likely formed around the December 2009 high. During 2009, gold's first attempt to surpass a previous high was not successful and we have also seen this pattern many times in the past. The price moved close to the level of the previous high and then declined. A subsequent rally, months later resulted in moving past this level. Once again we do not expect the current rally to visibly surpass the December 2009 level - it may move briefly above it. The next rally may very well take it higher but it does not appear this will happen now.
When gold hits its 2009 high, it could mark the end to the usefulness of this self-similar pattern. It simply may no longer apply, as the pattern would suggest further gains ahead. However, we will need to see confirmation of this assumption before accepting this to be true.
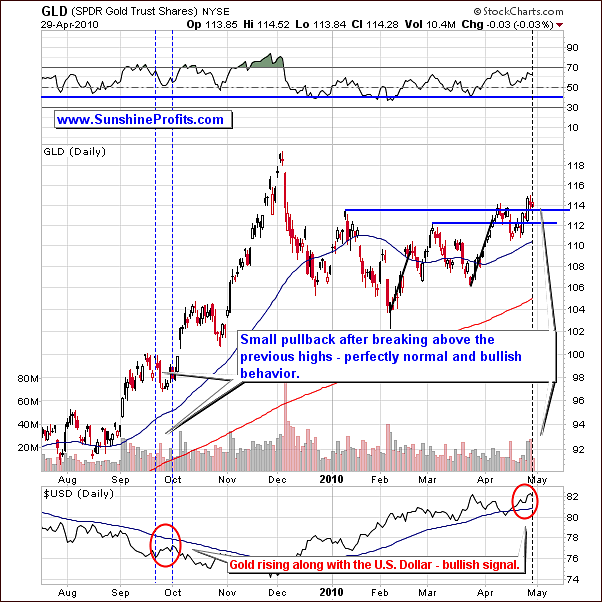
Moving to the short-term chart, it is unclear as to where we are today in comparison to vertical lines on the above chart. If it is the first late-September line that we have just seen, then we will see another move lower before rallying further, but if it is the second line, we are likely to move higher right away. Note that when the USD managed to rise during the final stage of a rally, gold also rose and this was followed by a bigger upward movement. We have seen this pattern in recent weeks, with the USD and gold moving upwards. This is a bullish trend as mentioned in our USD analysis earlier in this update.
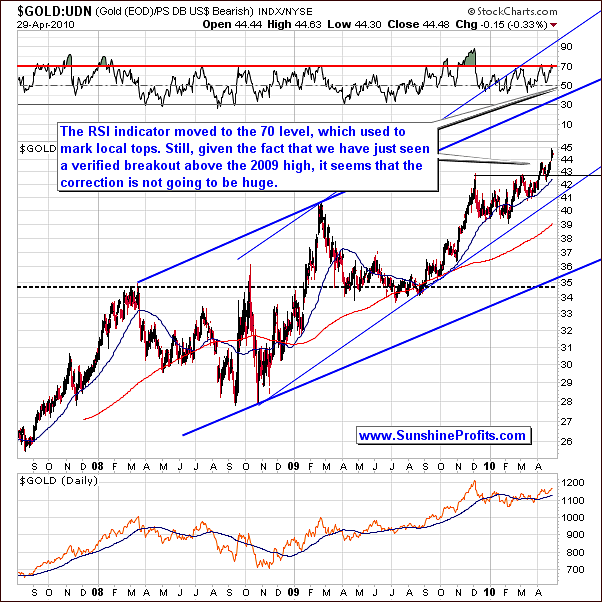
We will now comment on gold from a non-USD perspective (which more or less corresponds to the gold in euro). The RSI has moved to the 70 level. In the past, this has suggested a local top or an imminent consolidation period, therefore it seems that we may be coming to a local top though not necessarily a big one. At the end of September and October 2009, gold (on the above chart) moved slightly lower before its next rally. We may see some sideways movement now or a further rise due to gold's present strength - the situation is unclear at this point as far as short term is concerned.
Historically, an RSI of 70 marks a local top when gold is in a consolidation phase. Presently we are at a level above the previous high and this breakout has been verified. This points towards an even bigger move forthcoming - not necessarily a lengthy consolidation period. When we look back to 2007-2008, we see similar patterns to what has transpired from February 2010 to now. Taking this into account leads us to the opinion that a consolidation, if it does occur, will not be lengthy or extreme. We do not expect prices to go much lower, though we may see a slight decline for several days. It is our opinion that this decline is not worth trading and the expected subsequent rally should be the focus at present.
Summing up, we stated last week that speculative capital [should] be placed back into the market now as the downside risk is minimal compared to possible upside gains and we continue to feel that this strategy is appropriate.
Many indicators point to a rapid rise taking place very soon - possibly with a target at the December 2009 high. Although a short sideways moving period or even a slight downturn in the trend may indeed be seen, it is not expected to be in place for any length of time and it will not preclude the impending rally. Being on the sidelines now is more of a risk than any other action based on what we see for the coming weeks in the gold and PM sector. Of course this comment is based on our own risk preferences / preferred investment time-frame (we are not Day-Traders). At times, you may want to take a different action than we do, as you prefer to approach the market in a different way than we do - that's why we provide a detailed analysis instead of a one-sentence "we're going up" comment.
Silver
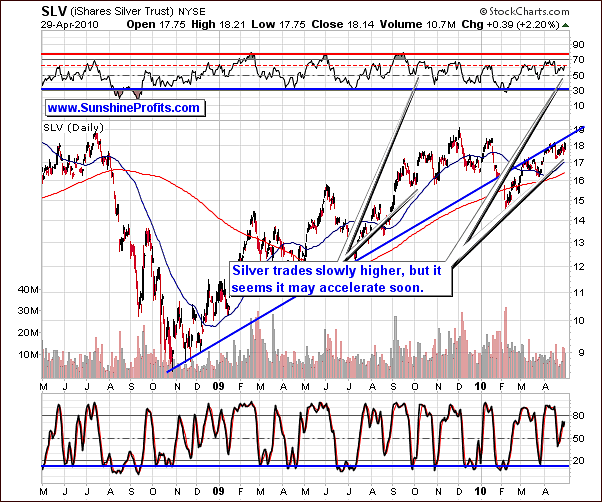
Last week, we spoke of a possible double-bottom in silver; the second bottom is not likely to be formed much below the first one. We felt that investors should stay in the market as there did not appear to be any signs that pointed towards exiting (and we've restated that on Wednesday after which silver moved over 50 cents higher.) Silver did move higher this week, but the threat of a small decline before an eventual big rally is still a possibility. As with our early discussion of gold, we restate that the very short term is also unclear in the case of the white metal. Previous performance of the SLV ETF leads us to believe that it may rise to the level of $19 in the near future before taking a breather. This would correspond to silver at about $19.40
Wherever it tops out, exiting a long position now does not appear to be the right action. No matter what happens in the short term, we should see higher prices for silver in the next week or three.
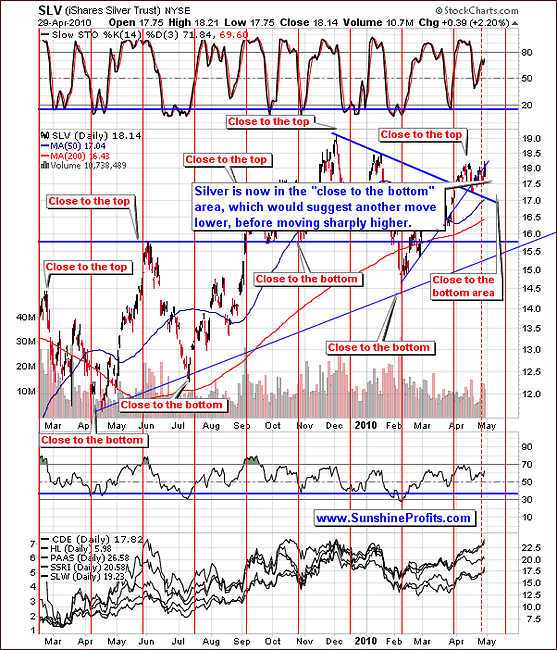
Moving to the short-term chart, we can see a confirmation of points made earlier. Although some cyclical tendencies do appear, these are normally less precise than those seen for the USD. Presently silver is in the "close to a bottom" area and we expect to see a bottom within the next several weeks. It may be the case that the bottom is formed before silver moves up once again or it might be the case that silver surges soon, tops out, and finally forms a bottom in late May (most of the month is the "close to the bottom" area).
Although there is a possibility of a decline before the rally continues, the probability of a large decline appears to be very limited. There is a much greater chance of upward movement, possibly a very strong movement even if a slight downturn precedes it. Waiting for the probable rally seems to be preferred at this time over exiting the market.
Summing up, details of the short-term outcome on the silver market are not clear, but based on the analysis of different scenarios and the probability that each of them occurs; it seems that exiting the market at this point might be premature. The most probable target for this rally appears to be at the December 2009 high at the $19.40 level ($19 for the SLV ETF.)
Precious Metals Stocks
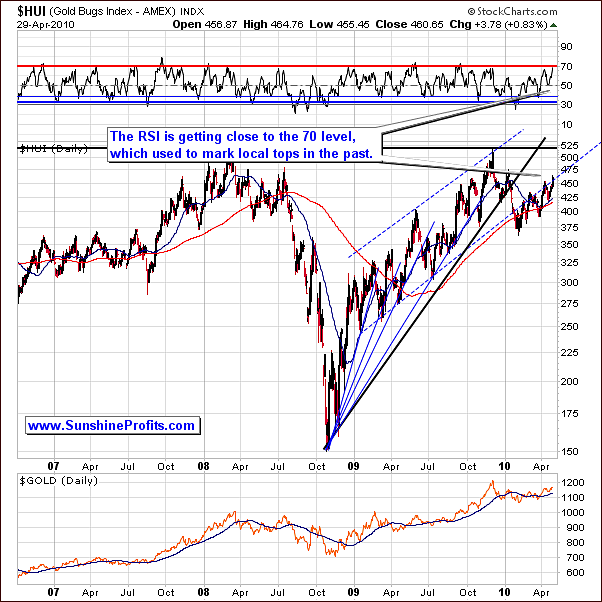
HUI - Gold Bugs Index - The situation in PM stocks this week is quite interesting. As we discussed earlier, the metals are in an unclear short-term position presently and gold stocks are not exception here. However, if we see a consolidation here - before rallying further, the decline in PM stocks is likely to be more volatile than the one in gold. PM stocks usually follow the trends set by gold and silver, but given the fact that mining stocks are currently at the resistance level and the RSI indicator is right at the 70 level, we think that a small pause in gold could easily correspond to a decline in PM stocks.
Still, based on the recent strength in gold (also including today's move) it seems that PM stocks will also rally. If the rally in PM stocks stops reacting to positive impact of higher gold and silver prices, it will serve as an indication that a top is near.
Let's take a look at the short-term chart for details.
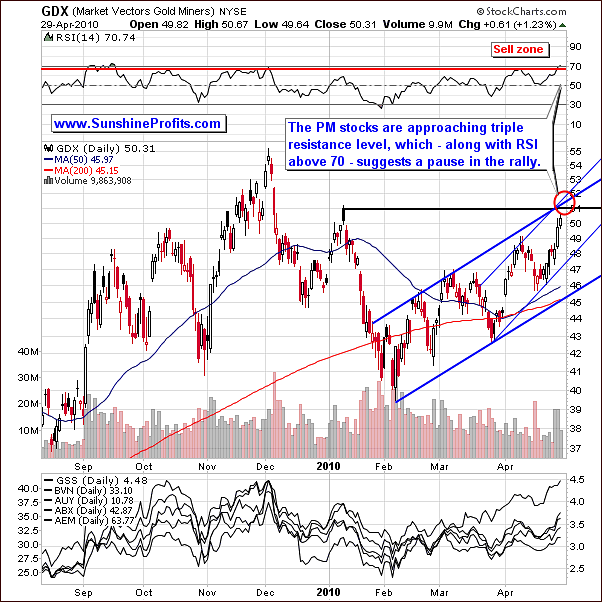
The RSI has reached the 70 level, which in the past meant that a local top is relatively close. Still, please note that in both September, and November 2009 RSI stayed overbought for weeks before the top was finally formed. We are now at the upper border of the previous trading channel, which suggests that mining stocks might want to for ma small top here. We may see a break above this line but would have to have verification for it to be meaningful.
The short-term chart shows many interesting details this week. The GDX ETF indicates what could be called a triple resistance level. The RSI is clearly in the sell zone. The 2010 high from January has been approached. The upper borders of both the medium and short term trading channels are also in play. We have seen low daily volume on Thursday. This indicates that although the top may not be in, it will probably be reached soon. Combining this information with the long-term chart indicates that perhaps PM stocks may move higher from here followed by a period of consolidation or decline thus verifying this breakout.
Summing up, the technical situation on the PM stocks is slightly bearish, but if the underlying metals rally (and that seems to be probable at this point), the mining stocks are likely to follow. Since we would expect PM stocks to top out along with PMs, it seems that it might be a good idea to analyze this sector through the underlying metals. In other words, although the short-term top may be reached soon, it seems that it would be a good idea to ride out the consolidation that it may cause and sell when gold and silver reach their December 2009 highs.
The analysis of ratios confirms points made above.
Ratios
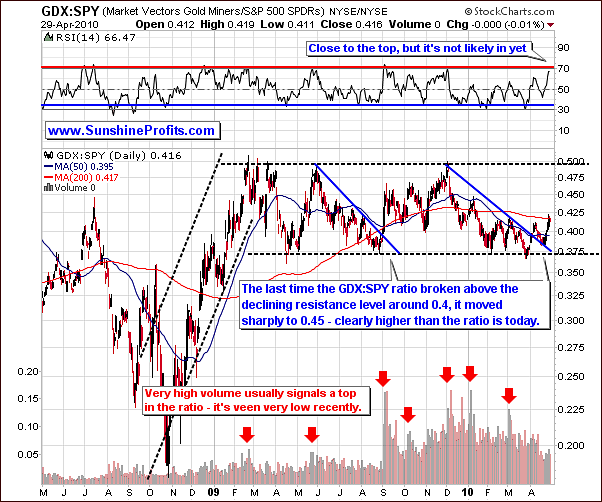
The GDX:SPY ratio measures precious metal stocks performance vs. the general stock market. It is a useful tool for estimating when a top or bottom is in for PM stocks as this ratio usually tops out along with PMs and PM stocks. Please note that virtually each time we've seen a top in the ratio, it was accompanied by big volume. Presently, it is obvious that the daily volume is relatively low. This indicates the top is not yet in. We see that the RSI is approaching 70. It will reach this level if the PM market moves upward again.
Please note that previously when the ratio moved above the declining resistance level near the 0.4 level, it quickly moved upwards to the 0.45 range. We haven't seen a rally this big so far, which suggests that it is not over yet.
Another confirmation that a major top is not in comes from the analysis of the silver:gold ratio.
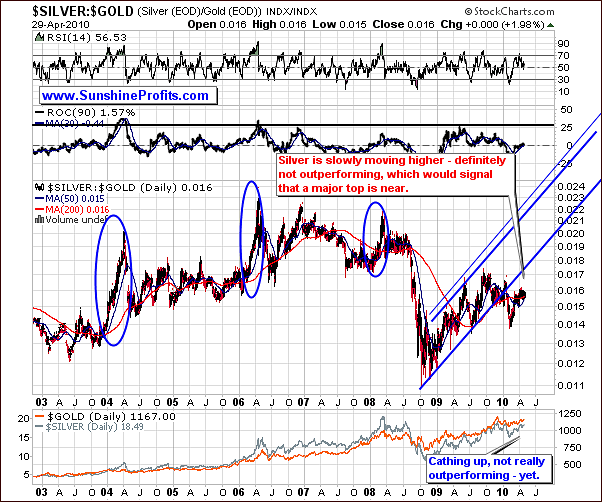
The silver to gold ratio chart is the one, which we prefer to analyze over the gold to silver ratio which essentially measures the same thing. Silver tends to outperform gold at the end of a rally. Recently, silver has not done this, in fact for the most part has been catching up to gold. This indicates that the end of the rally is not close. We see no bearish implications here.
Summing up, the analysis of ratios reassures us that the final top for this rally is not yet in.
Summary
The USD Index seems to be ready to move lower sooner or later, which is either very or slightly bullish for precious metals at this point. The general stock market is consolidating, which makes another rally more and more probable, which is positive news for the PM sector.
Expectations for gold and silver in the short-term are unclear presently. A small consolidation might be in cards but we don't recommend betting on it by exiting the market right now. In any case it is likely that gold and silver will move to their December 2009 high during the 1-3 weeks. At that time we will have more details such as volume, readings from our unique indicators, etc. and we will let you know if we believe that the top is indeed forming or are PMs likely to move even higher.
The technical situation for PM stocks is less favorable, but ultimately mining companies' profits depend on the prices of metals not the other way around, so it is likely that PM stocks will follow metals and the top will be formed higher than we are today. At the moment of writing these words the GDX ETF is right in the middle of the red ellipse marked on the GDX chart earlier in this essay suggesting that a consolidation is needed before it can move higher once again. This is something that Day-Traders may want to take advantage of by selling PM stocks now and waiting to re-enter after a visible decline (perhaps to the $49 level). Still this is not recommended for most Investors / Traders because the momentum in gold appears strong, and by exiting now one risks missing out on the late stage of the rally that could take GDX ETF to $54 level or so.
This completes this week's Premium Update.
Thank you for using the Premium Service. Have a great weekend and profitable week!
Sincerely,
Przemyslaw Radomski

