
There is no reason to raise a glass of ouzo to toast the sweeping rescue package announced by Europe over the weekend which temporarily eased fears of a market collapse but left lots of doubts. The biggest question on investors' minds is will it work for the long term?
What was once a local worry about the debt burden of one of Europe's smallest economies has quickly gone global. Time seems to be speeding up. A decade ago, it took more than a year for the chain reaction that began with the devaluation of the Thai currency to spread beyond Asia to Russia, which defaulted on its debt. This time, the crisis ricocheted from country to country in seconds, as traders last Thursday dumped almost everything when the stock market briefly plunged nearly 1,000 points. The only thing that held steady and climbed up in those terrifying moments was gold.
It's a basic law of economics that you can't save a failing company by refinancing its debt forever, nor can you do the same for ailing nations. None of the basic problems were solved last week, only postponed.
Friday, the euro slid to the lowest since the aftermath of Lehman Brothers' bankruptcy and stocks tumbled on concern the sovereign debt crisis could lead to the euro's breakup. Rumors that French President Nicolas Sarkozy threatened to leave the euro didn't help the battered currency. And a spurt of candor from a senior German banker didn’t help either. Josef Ackermann, chief executive of Germany's Deutsche Bank AG, said on a German ZDF television talk show late Thursday that he was unsure that Greece could overcome severe budget deficits and be able to repay its debt. Adding to the pressure on the euro were remarks made yesterday by former Federal Reserve Chairman Paul Volcker, who said "there is a great risk of the potential disintegration of the euro."
We wrote in previous Premium Updates that we wouldn't be surprised if European investors begin to pile into gold, and according to media reports, this is exactly what has taken place. Alarmed at the plunging value of their currency, Europeans are leading an exodus out of the euro and into the yellow metal. Gold has been hitting records in euro terms since February. The burgeoning demand pushed gold for delivery this month up 1.6% on Tuesday to settle at an exchange-record $1,219.90 on the Comex division of the New York Mercantile Exchange. On Wednesday most actively traded gold for June delivery rose $22.80, or 1.9%, to $1,243.10 an ounce, the strongest settlement for such a contract.
Gold backed funds report that most of the inflow is from European investors. At the Austrian Mint in Vienna, for example, demand for gold coins and bars has soared. Since April 26, the mint has sold, almost exclusively to Europeans, 243,500 ounces of gold, compared to 205,300 ounces in the entire first quarter.
The flight by Europeans into gold indicates that they still harbor deep concerns about the potential consequences of the bailout package that exceeded in size the United States bank bailout two years ago.
As details became clearer of the package's main component - a promise by the European Union's member states to back $560 billion in new loans to bail out European economies - many began questioning the wisdom of solving a debt crisis by taking on more debt. Some, like investor Jim Rogers, see it as one more nail hammered into the coffin of the euro.
Let's not overlook the fact that this rescue package is in fact another lifeline to some of the world's largest banks in France and Germany, which hold the majority of the ailing countries' debt.
According to an essay titled A Greek Tragedy in the Making, published by the Ludwig Von Mises Institute (Austrian School of Economics) the bailout sets the stage for far greater problems down the road than if the PIIGS (Portugal, Italy, Ireland, Greece and Spain) were allowed to default and restructure their debt obligations.
The most infuriating aspect is that the Eurozone, California, et al., will arrive at this same juncture again in about 3 years or so, when they must pay interest on their current debt plus the one trillion in bailout dollars and repay the maturing debt.
Given that governments are reluctant to take their lumps now, what are the odds that they will do the right thing - outright default and debt restructuring - three years hence when the debt bubble is that much larger, the economy is in worse shape, and the pain of default and austerity is much higher than today's? The words "slim" and "none" come to mind. The world is firmly ensconced on the path to an inflationary depression.
The article suggests that people can protect themselves from the coming storm by buying precious metals such as gold and silver and select other commodities since inflationary depressions transfer wealth from holders of paper assets to holders of hard assets.
The bailout has bought a modicum of time for the PIIGS before the noose tightens once again. Fortunately, it has also provided time for the prudent and informed to prepare for the crisis and acquire hard assets while the getting is still good.
On another matter, we wrote about Prime Minister Gordon Brown's unfortunate sale 10 years ago of about 60% of Britain's gold reserves at a rock-bottom price of $275 an ounce. This move, which cost the British taxpayer about several billion dollars, earned him the nickname-- "Golden Brown." We find it ironic that on the day that British voters went to the polls to say good-bye to Brown, gold marked a new all-time high against the Pound Sterling. And then this week, on the day that he resigned, gold reached yet another all time high of €960.41 in London. Perhaps gold was also saying good-bye to "Golden Brown."
Those of you that have been following the Premium Updates for a while realize that we tend to be careful and cautious in what we say. If something is only slightly likely, we will report it as such - not as a sure bet. We have unique charts, tools, cycles, technical and statistical analysis at our disposal and this combination proved to be very reliable, but still - it's not a crystal ball.
However, in the last Premium Update, posted on May 7th, we were as explicit as we can get. We said there was a "strong indication that we may surpass levels reached in December 2009" and that we "expect gold to move to the December 2009 high within a week or so". In the following Market Alert we've stated that the final targets for this rally are even higher.
Subscribers who bought gold when the markets opened last Monday morning are up almost 4% gaining about $45 per ounce in a week. Gold did indeed move to the December 2009 high and surpassed it.
To see what is in store in the coming weeks for precious metals let's begin this week's technical part with the analysis of the U.S. Dollar. Let's start with the long-term USD Index chart (charts courtesy by http://stockcharts.com.)
USD Index
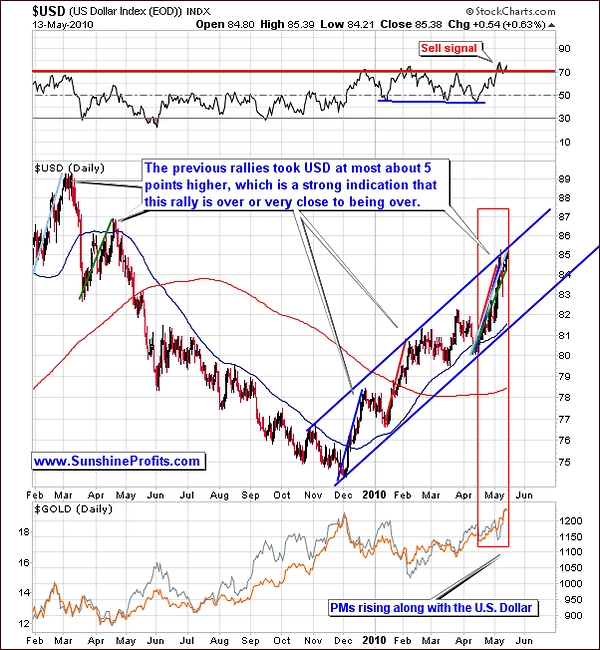
This week, the USD mainly moved sideways, almost in a holding pattern in view of its recent rally. Whereas we had seen upward movements in the 5-point range recently, this week saw an increase of only .09 or about 1/10th of 1%. That is to say, although the downturn has not yet begun, it is very probable that the rally, which has stalled for several days, is very close to being over. The anticipation for the near-term is a downward movement for the USD. We should see an end to this rally very soon and the RSI holding above 70 is continuing to give off a sell signal.
As to the precious metals markets, we see that they have continued to perform well this week. Gold's upward trend moved in excess of 4% this week although as we mentioned earlier the USD saw little change and more importantly did not decline. Once again, upward movement of gold in conjunction with a sideways USD market is a bullish sign for the PM sector on the whole. Indicators are that the PM sector rally is approaching its final stage and this will be seen more clearly when the USD decline begins. Gold has shown great strength of late whether the USD is in an uptrend or trading sideways. As always, a Market Alert will keep our Subscribers' current should anything develop in the coming days.
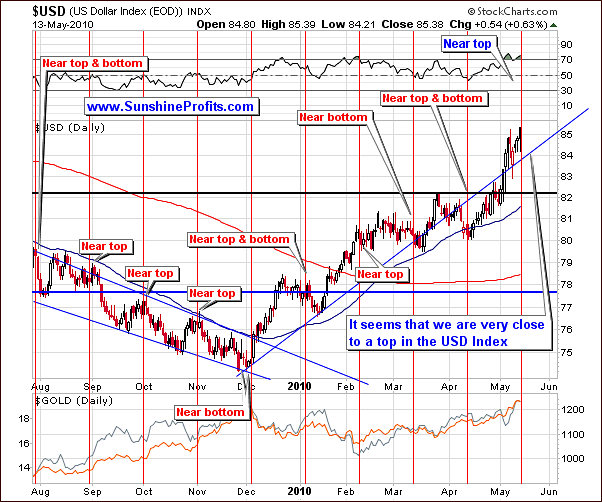
This week's short-term chart confirms what we have stated previously. The cyclical patterns indicate we are close to a top and expectations are that this top will be reached very soon, most likely in a few days or less. The vertical red lines on the short-term chart normally correspond to local tops and bottoms and our analysis at this time leads us to feel a top is likely very soon. The overbought situation alluded to previously in still present today.
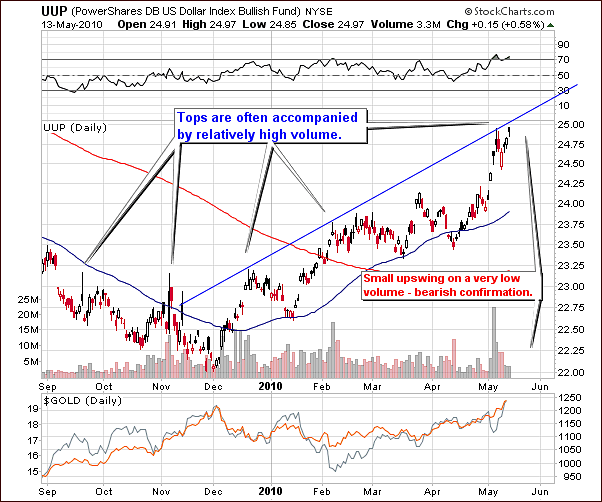
The UUP chart this week confirms what we stated last week. We have in effect seen a top nearly formed with high volume trading levels. During this past week, we saw slight declines and upward movements both occurring with very low volume. The indication here is that buying power is drying up. This is a non-confirmation signal and is consistent with other indicators leading us to have a bearish outlook for the USD at the time of this update.
Summing up, increasing prices accompanied by low volume levels are bearish indicators. It is likely at this time that we have seen the 2nd top of a double top formation. Having reached this 2nd top and with the RSI giving a sell signal, we are bearish in the short term for the USD and bullish for gold, silver and mining stocks (the latter tend to lag during the final stage of an upswing, though.)
General Stock Market
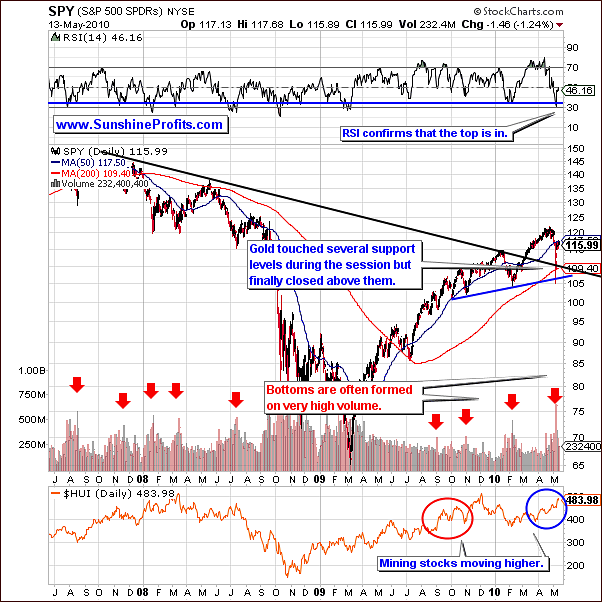
This week's long-term chart confirms what we stated last week in that prices were likely to rise. Recall that the sharp decline on Thursday last week bottomed out mid-day and we observed an uptrend for the rest of the week. The SPY moved up about 3 points this week, which corresponds to an S&P increase of 300 points or so. The RSI this week further confirms last week's bottom, moving up from the 30 level to about 50.
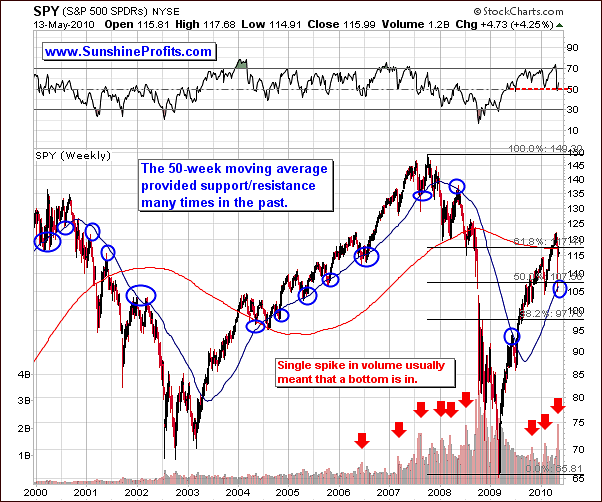
Looking at the very-long-term picture, increased volume is very likely to be seen at the time a local bottom has been reached. In past years, this has been seen numerous times. One phenomenon, which has also been observed, is that a single spike in volume suggests that the following rally is going to be dramatic. This is what happened in July of 2007 and what we see happening right now. We see indications that the trends in 2010 are consistent with many similar patterns of 3 years ago.
The sharp decline recently stopped at the level of the 50-week moving average. This is likely to be the local bottom. Historically this 50-week moving average level has frequently coincided with local bottoms making it highly probable in this situation as well. Strong support and resistance has been seen over the previous decade with respect to this average. This is a bullish signal not to be ignored. The RSI indicator based on the weekly closes points to a local bottom as well.
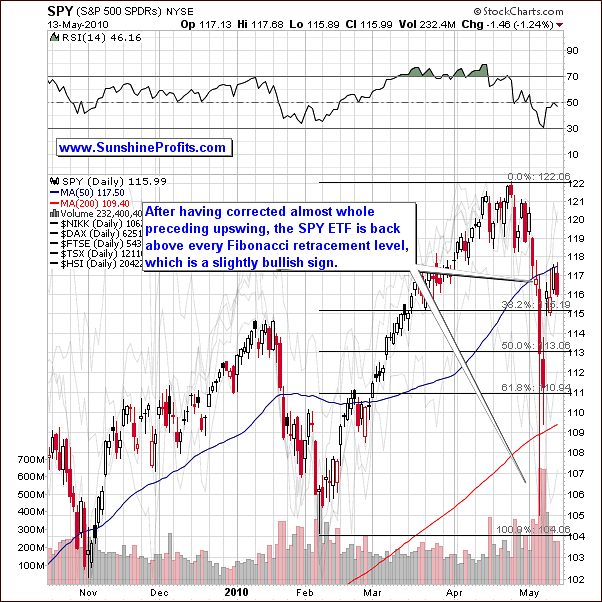
The short-term SPY ETF chart this week is unclear with respect to detailed timing and price level trends. We see that the whole preceding rally has been corrected and we are above every important Fibonacci retracement level today. This is a slightly bullish sign for the upcoming weeks.
Summing up, precious metals are likely to continue to move in their own way as they have in past weeks. They have not of course been following the general stock market and the general stock market sideways movement this past week clearly suggests that the rally will continue. The only thing in the main stock indices that would make us re-consider our short-term bullish stance on PMs would be signs of a severe plunge in stocks - and we certainly don't see that happening at this point.
Correlations
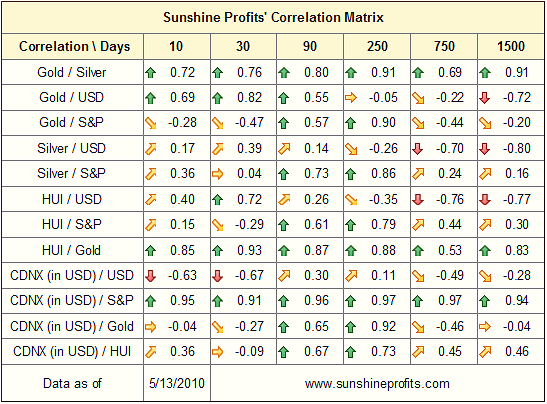
This week's correlation matrix, as mentioned in our recent Market Alert, really seems to be upside down. The precious metals and the general stock market have slightly negative correlation when we look at the 30-day column. What this reflects is that the precious metals on average have been performing the opposite of the general stock market. This is a quantitative confirmation that PMs are able to rise on their own, even without positive influence from the general stock market.
When we look at the correlation between the USD and gold, things are even weirder. Gold, silver and mining stocks have shown positive correlation with the USD and this is simply not normal. When we see gold rising along with the USD index, most of this is due to the weakness of the euro. Let us explain.
The biggest part of the USD index is the exchange rate between the USD and Euro. A positive correlation here indicates a negative correlation between gold and the euro. This is actually normal. The severe recent problems involving Greece have weakened the euro. Details of this newsworthy item were provided in the opening section of this update.
The correlation coefficient does not tell us that gold stopped reacting to the USD weakness, but rather that it is reacting to the weakness of the Euro. Gold has been rising while the Euro has been in decline. For this reason and many others, which we will cover in this update, we are bullish in the short term for gold.
The correlation coefficient that we see today does not invalidate this outlook. At first glance, it seems logical that this would be the case but due to the euro and the Greece situation, the opposite is true.
Summing up, this week's correlation matrix seems, at first glance to be quite confusing and mixed up. However, when the underlying relationship between Greece, the euro, gold, and the USD are studied and analyzed, the picture comes more into focus.
Simply put, the positive correlation between gold and the USD is a direct result of the weakness of the euro. The situation with Greece has had such a profound effect on the European currency that it has actually resulted in gold and the USD both following similar trends which is highly unusual.
We will delve into details later in this update but suffice to say for now; we are bullish for the short-term on gold in spite of its current positive correlation with the USD and the fact that we are bearish on the USD.
Gold
This week we will begin by focusing on the spot gold index itself, which increases the accuracy of our price projections. Normally, we have in the past used a proxy chart but this week have decided to go with the actual spot gold index itself. As mentioned in the previous updates when analyzing SPY ETF and S&P 500 Index itself, a derivative can be a less than perfect reflection of the movement in the price of a given asset, and this important if we're drawing long-term resistance/support levels.
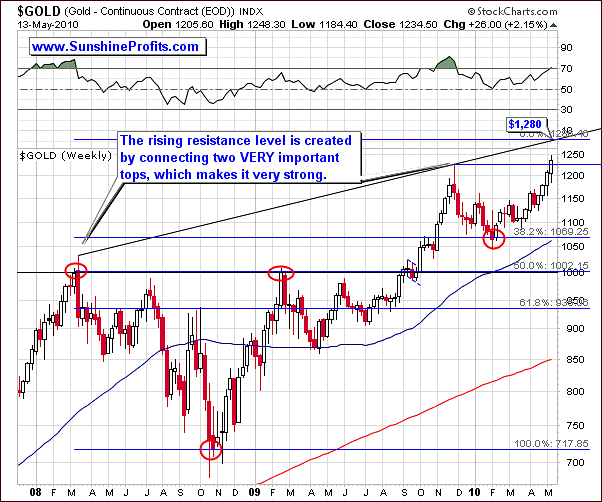
When we connect the highs from 2008 and 2009, and create a resistance line, which has an upward trend (since the 2009 high was above that of 2008), it gives us a projected target of $1,280 and this is a very strong resistance level, which we are approaching.
In most markets, even when a rally is strong and long and goes to very high levels, there is normally a period where the trend takes a breather and goes through a consolidation phase. It can be quite short in length but normally it will be for a moderate time period.
The resistance line, which we described earlier, is likely to stop a very strong rally such as we have seen recently especially since it seems that there is so much bullish noise in the media about gold. Applying the Phi number (1.618) - often used when calculating retracement levels - also confirms this fact. Based on weekly closing prices and combining important turning points (local tops and bottoms), as we said earlier, the target level is $1,280. This confirms our previous analysis. The above chart does indicate that gold is quite strong at this point, as it has just broken above the December 2009 high on relatively high volume. Still - we expect the volume to decline soon or at least slightly before it reaches the $1,280 level. This rally has been confirmed and it is our belief that the indicators today are pointing to a probable end to the rally soon - probably not longer than a week or two away. The RSI is also around the 70 level which indicates that we may be near the top.
There has been much news about soaring gold prices recently, which has caused the sentiment to get quite high. These new investors are not the regular day-to-day traders who are in the gold market frequently, nor are they strong believers in the fundamental situation of the PM market. This will cause the situation to become overbought and we expect an eventual downturn.
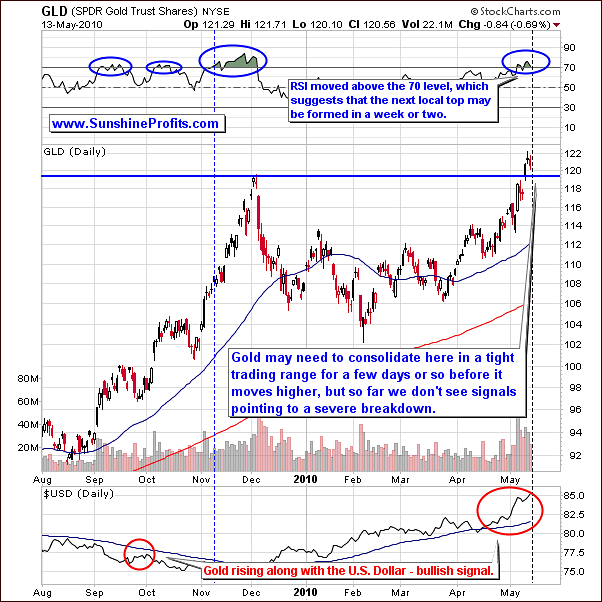
On the long term GLD ETF chart this week, we see a self-similar pattern, which gave us some clear indication in our May 7 update. This week the signals are somewhat blurred. We have a very wide range to analyze and it indicates in some ways that the rally is in its final stage. Also, we could be entering a small consolidation phase such as we saw in mid October last year. The RSI in the range of 70 of course is bordering on an overbought situation. Volume levels, which have been consistently high indicate that we are very close to the end of the rally and this further confirms points that we have made earlier in this update.

Taking a look at the short-term chart, the RSI, which of course is based on daily closing prices, is the same as we saw previously in the above chart and as we saw last week, it indicates that we will probably be seeing a local top in the next week or two.
Please note that gold has just moved above the December 2009 high, so a small pullback to this particular level should not surprise you. If it does materialize, it will not invalidate our current bullish stance.
The final chart in this section looks at the price of gold from a non-USD perspective. We realize that this part of the commentary might be confusing, so please keep in mind the following - we believe that gold is going to soon reach price of 1,280 USD.
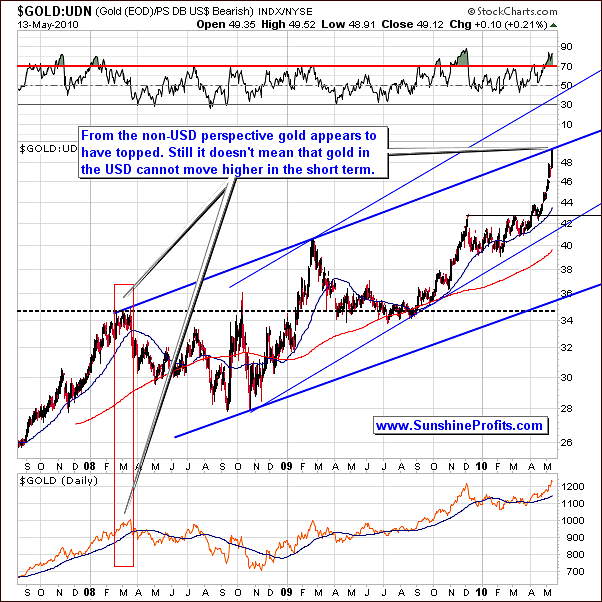
Taking a look at the above chart, the RSI is showing that we are in an overbought period right now. This is similar to what we saw in 2008 and 2009 at the tops for each year respectively. When we connect 08 and 09 tops, the target price is in line with where we are right now. If your market strategy is to trade into euros, pounds or other currencies (other than the U.S. Dollar that is) it might be a good idea to do this now - to get out of gold and into your local currency. Please note that this means selling gold only if you would be switching from gold to something else than the U.S. Dollar - for instance euro.
Please take a look at the red rectangle on the above chart, as we may see similar performance in the following days. A decline in the USD could easily cause the price of gold to increase (in USD terms) but at the same time it could have no effect on the price of gold in other currencies, for instance in euro.
Therefore, the above chart does not invalidate our earlier points. The gold price in USD is likely to increase but if the USD value itself declines, then the effect on the price of gold from the non-USD perspective may be quite minimal. Even if we are at a resistance level today (in Euros for instance), we continue to believe that gold most probably will go higher (in U.S. Dollars) before it eventually declines significantly.
Summing up, the indications are that gold will reach a level around $1,280 before the current rally ends, but at the same time we don't expect much higher gold prices in other currencies. A slight downturn (gold in USD) may be seen before gold reaches its eventual top and this should not be cause for concern. Non-USD traders, however, may wish to exit the market now and convert their gains into the local currency of choice.
Silver
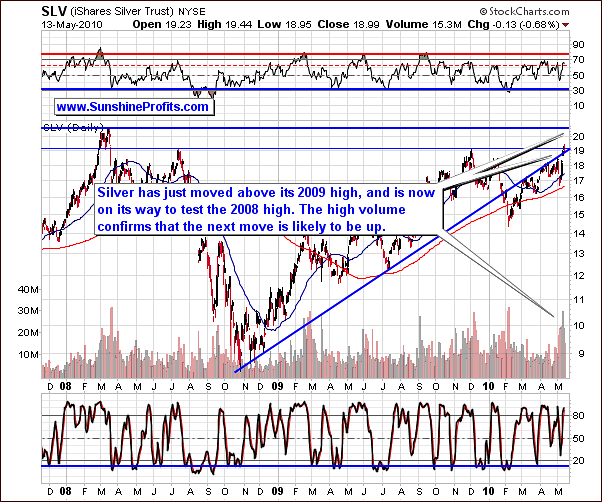
Moving on to silver, the long-term chart for the white metal, if you recall last week, we stated would likely show an upturn. Earlier, we had seen a sharp decline and in last week's update advised against worry, for the decline was relatively low compared to that of the general stock market. What we have seen this week is a bounce in the general stock market and silver is now at a level higher than 2 weeks ago, in the range of its 2009 high (its almost 7% higher since we posted our previous update). Given gold's recent strength, we expect silver to also move higher and we have confirmation of support for this expectation.
Indications are that silver's rally will likely be stopped by the level of its high in 2008. Historical trend analysis leads us to believe that silver will reach a level of about $21 (about $20.50 - 20.60 in the SLV ETF). We expect to see at this time a corresponding RSI much higher than today, to a level close to 70. This will likely mark a local top. The volume has been strong recently meaning confirming that the rally may have further to go.
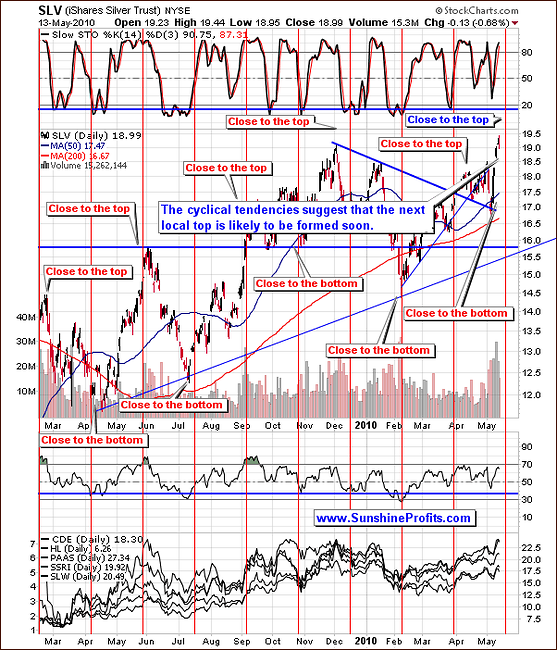
As we move to the short-term chart, and analyze the cyclical tendencies we are led to believe that and extremes may be seen in the next several days - based on the recent price action - it's likely to be a top.
Different extremes frequently coincide with the red vertical lines in the above chart. Generally, the current vertical line suggests that we are in the "close to the bottom" territory, and consequently we have just seen one, but given all other signals mentioned above in this update it seems that we might still see a top relatively soon. If that is the case, the red vertical line could very well mark the day when it's going to take place.
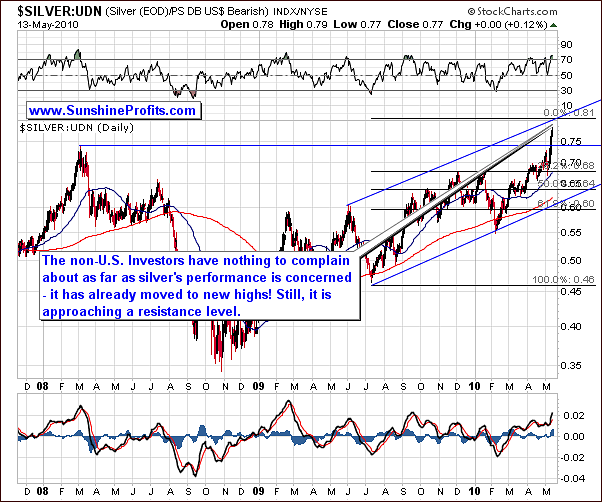
Moving to a silver and non-USD chart, we get additional insights as to what we expect to transpire in the near term. Gold is presently at a resistance level and it may not go any higher. Silver is still visibly below its final target. As we have mentioned many times in the past, silver tends to outperform gold during the final stage of a particular rally. This is the case for the whole bull market, when silver vastly outperforms during the final stage, but it is also visible in smaller upswings and we expect to see this tendency also this time.
From the non-USD perspective silver is not at its strong resistance level yet and gold (again, from the non-USD perspective) is, meaning that the technical factors are in place for a move higher in silver without similar move in gold. Now, from the USD perspective (if USD declines) it would mean that gold rises and silver rises even more - meaning that the white metal outperforms, which is precisely what we would be looking for as a confirmation that the top is very close.
So, silver could go higher in the coming days and weeks, while gold may move sideways from a non-USD perspective. Silver is presently above its 2008 high, so non-US Investors have been quite happy with its recent performance.
With respect to timing and targets, once again we used the Phi (1.618) number to come up with the target value. We have extrapolated previous moves using the October, December and January highs along with its July low. Viewing silver from a non-USD perspective, we extrapolate a target of .81. This is further confirmed by the upper border of the rising trend channel.
Summing up, silver seems poised for an upturn very soon. Even in its recent decline, the white metal has shown signs of stability. The general stock market did not cause a severe downturn last week and we continue to expect silver to move upwards fairly soon. The 2008 high slightly above 20 seems to be where the trend will move towards and probably top out at. Analysis of all our tools and charts seem to indicate a local top in the next week or two.
Precious Metals Stocks
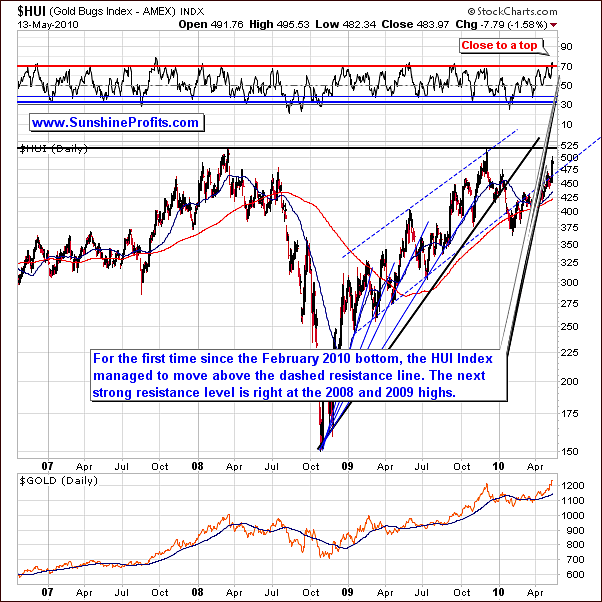
With respect to the mining stocks, last week we mentioned that the HUI was ready to move above its resistance level. As we know now, this finally happened for the first time since its February bottom. The strength of this move and the resulting momentum are significant. We may, in fact, see the whole PM market move higher. The RSI, slightly above 70 suggests that we are close to a local top but not necessarily at one.
What we see in our analysis of the charts leads us to believe the local top will be at or near the 2009 high. This reasoning is based on the fact that this level proved to be a very strong resistance level during both 2008 and 2009 highs, and moreover, it corresponds to targets mentioned when analyzing gold and silver.
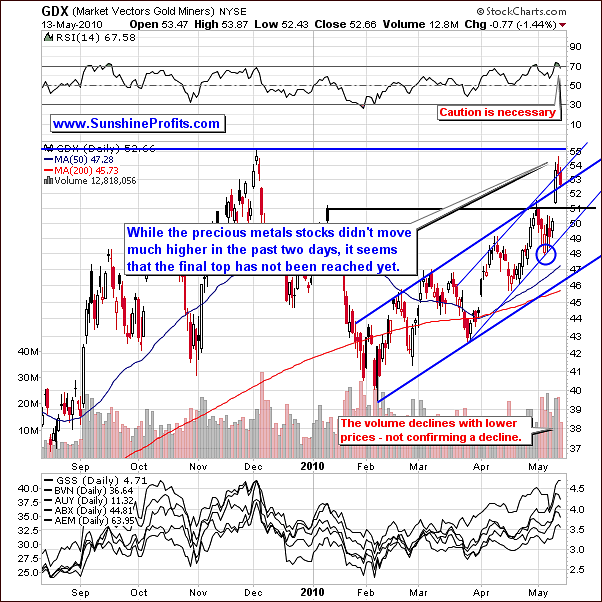
Turning to the short term GDX ETF chart, we can analyze volume, which recently has seemed to be on the low side along with lower values of the ETF. This is normal during small pullbacks - not a signal of coming decline. So, we are somewhat bullish at this time seeing a small move upwards. Indications are that we may see a level of 55 or even slightly higher than we saw in 2008, which saw a top at about 56.5.
Mining stocks do not show as great a potential as silver and gold at this time. In the latest Market Alert we wrote the following:
Given the strength of the momentum (confirmed by volume) it seems that PM stocks may need to slow down before the local top (also in gold) is reached. This is what we usually see before the top is in, and we haven't seen it so far.
We have further stated that:
(...) if a lot of your speculative capital is currently in the mining stocks (or even in options on these stocks) you might want to limit these positions, as the risk/reward ratio for this part of the PM market is not that favorable anymore (it's even less favorable for short-term options on PM stocks). Besides, if you've entered the market when we've suggested doing so in the previous alerts/updates, this position has already generated you substantial profits.
Given the timing of that alert it enabled one to sell GDX above the $54 level, which is just slightly below the final target for this rally. Consequently, the risk/reward ratio was no longer favorable.
One other fact, which we wish to make note of here, is that the bottom, which we forecasted, took place exactly as stated (marked with the blue ellipse on the chart).
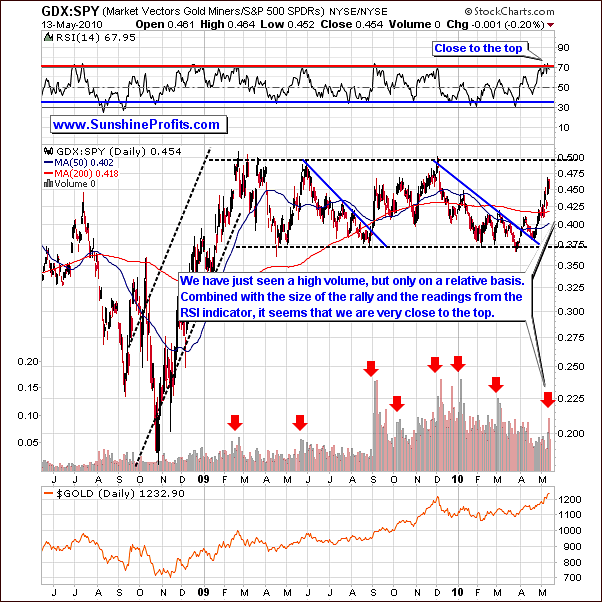
For a final chart in this section, the GDX:SPY ratio often forms tops and bottoms along with PMs and PM stocks. Therefore, what's bearish for the ratio is partly bearish for the whole PM market. As we have mentioned in the previous updates, tops are often accompanied by a huge volume, and they take place when the RSI is right at the 70 level.
The latter has been the place recently, so the question is of the volume has been high or not. We have marked it on the chart with a big red arrow as it is visible on a relative basis, but if we take into account the volume that we've seen from November 2009 to mid-April 2010, we see that the very recent volume is quite normal.
Comparing the current situation to what we've seen in November 2009 (final stage of the rally), it seems that perhaps we might need to see more significant spike in volume before we can state that the top has been confirmed.
We will advise as more information becomes available. We can re-state at this point that we are not as bullish on mining stocks as we are on gold and silver.
Summing up, we are presently less bullish on PM stocks than on PMs, and we believe that they are not going to perform as well in the final stage of the rally, which by itself will serve as a confirmation that it is - in fact - the end of the rally.
Sell in May and Go Away?
In this section we would like to touch on the popular belief that precious metals - and especially silver - tend to drop heavily this time of the year. The saying suggests selling in May and going away - is this really the best way to go? At Sunshine Profits we're rather reluctant to take the common knowledge for granted - we prefer to dig deeper and check ourselves if every fact is really fact, not just an opinion.
By the way, this approach has led us to stating that dollar cost averaging is not a good way of purchasing one's precious metals assets (you will find details at the bottom of the section dedicated to physical bullion). One of the questions that we received this week was if we recommend the http://www.silversaver.com service. In a nutshell - that's a very convenient way to invest in silver over time using the dollar cost averaging. The answer is no, we do not recommend it, particularly because of the dollar cost averaging system, which we believe means lower rate of return during a strong bull market.
Anyway, moving back to the main topic what we would like to discuss in this section - while the "sell in May and go away" phrase does appear close to being true, we would still prefer to provide you with details before making final calls. This week, we will provide you with two seasonal silver charts, as the white metal is known for is seasonal tendency do decline in May. Let's begin with the May chart, and then we will move to the June one.
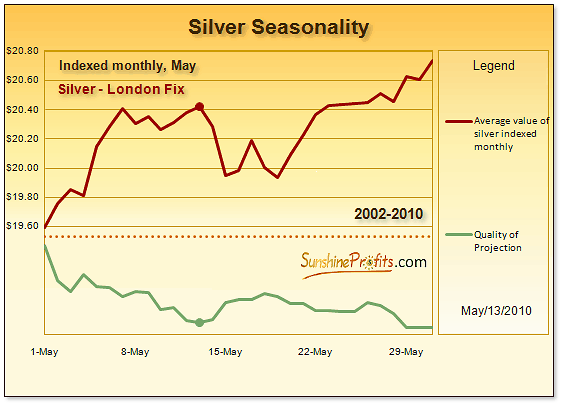
Surprising, isn't it? Based on the way silver performed in the month of May from 2002 to 2009 we see that silver has tended to move over $1 higher during May with the top being right at the end of the month. Yes, there is also a tendency for the white metal to move lower in the middle of the month, but it tends to rise once again in around the third week of the month or so. Then, the local top is formed around the end of the month.
Taking a look at the quality of projection, it tells us that silver being 80 cents above the May 1st level is more certain at about May 27th, than it is at May 13th. Therefore, although it may seem like a no-brainer to dump one's silver holdings right now, seasonal tendencies don't scream "sell" at this point yet, as silver tends to rise during the whole month of May. In other words, while we may move slightly lower from here, seasonal tendencies suggest that PMs are going to be higher at the end of May than they are at this moment.
The situation in June is quite different...
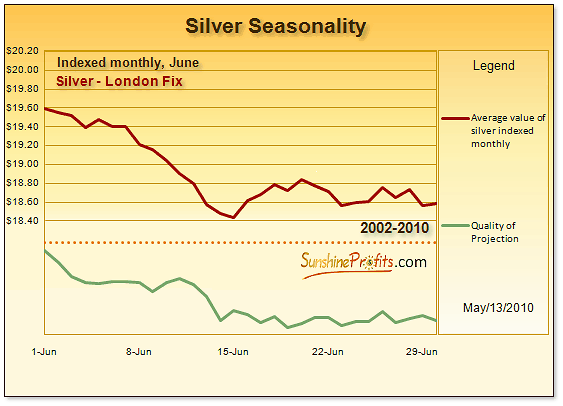
While the second half of June is nothing to call home about, the first two weeks tend to wipe out May's gains. While silver used to rise about $1 in May or so, it also used to decline about the same amount in June.
The first 10-15 days of June are most likely to provide us with lower silver prices - still, silver most usually doesn't plunge before the end of the month.
Summing up, silver - and also the rest of the PM sector - is not likely to plunge before the end of the month, but still, the main part of the analysis comes from the current charts that we've covered earlier in this update. The main point is that the "sell in May and go away" is slightly inaccurate, as the top is usually formed right at the end of the month. If one took this advice to the letter and sold in early May each time during the past 7 years, one would on average miss out on a $1 rally each year in silver. Therefore, let's keep in mind that there's much more to the analysis of the seasonal tendencies than just suggesting to "sell in May and go away."
Therefore, the analysis of silver's seasonal patterns confirms points made earlier in this update.
Other Information
One of the questions that we have received this week was about the stop loss orders, and why we don't provide details regarding them when we mention other price levels. The reason is that - for instance, as featured throughout this update - there are many other things that need to be considered before closing a position than just the price itself.
Take volume - if we get even a $30 decline in gold or so but the volume is very tiny it would serve as a strong buy signal, but if the same move materialized on massive volume, one should seriously consider getting out of the market. In the former case - a stop loss of $29 below the current gold price, could not only diminish one's previous gains but it would also cause one to miss out on the following rally.
Another question that we received this week was about lagging juniors. What should one do with stocks that have not been performing well?
Generally, the universal answer is not to focus on the current price itself, but on the profit potential. Stocks from our rankings appear to have very good potential and in fact this is the criterion that we use while preparing the ranking. Therefore, it is imperative to make sure that one owns stocks that have the biggest profit potential even though it might mean selling laggards. Still, since we are so close to the top, it might be a good idea to sell the lagging stocks and buy strong stocks once we're close to the bottom. Either way, please be sure to diversify in many junior stocks.
There's one more thing that we'd like to tell you before summarizing. There's a small improvement on our homepage, that you might find useful if you've been following the indicators in the Premium Charts section. The link that takes you to the page with current signals has been "customized" so that it tells you when was the last time that any of the indicators flashed a signal. This way, if you wish to check if there's something new in this section, you won't have to click for details - a quick look on the link will be sufficient. Of course, you might still want to monitor these indicators and analyze them if you wish.
Summary
The USD appears to have topped, the situation in the main stock indices is rather unclear in the short run (a severe downturn, however, seems to be unlikely), and we remain bullish for the PM sector in general. It is our view based on current information that we are in the final stages of the current rally in gold, silver and mining stocks.
Gold appears to have topped out from a non-USD perspective but there does seem to be additional room for continued gains in terms of the USD. Silver, which has exceeded its 2009 high from a non-USD perspective, appears likely to continue trending upwards for the near-term in both currency markets. In the coming days we expect to see silver outperforming gold, while mining stocks are to underperform.
In the latest Market Alert we've stated that it seems that this rally could take gold to $1,280, silver to $21, and we could see the HUI Index at 520 ($56.5 for GDX ETF) or so and these targets are up-to-date also today. At this point it is unclear how low could the PM market go after the top is formed, we will let you know once we have more information. As always, should anything change, we will send out a Market Alert.
This completes this week's Premium Update.
Thank you for using the Premium Service. Have a great weekend and profitable week!
Sincerely,
Przemyslaw Radomski

